Articles
Routinely-collected general practice data
are complex, but with systematic
processing can be used for quality
improvement and research
Simon de Lusignan MSc MD MRCGP
Senior LecturerNigel Hague BSc MB BS
Research FellowJeremy van Vlymen BEng MSc
Research AssistantPushpa Kumarapeli BSc
Research AssistantPrimary Care Informatics, Division of Community Health Sciences, St George’s Hospital Medical School, London, UK
ABSTRACT
Background UK general practice is computerised, and quality targets based on computer data provide a further incentive to improve data quality. A National Programme for Information Technology is standardising the technical infrastructure and removing some of the barriers to data aggregation. Routinely collected data is an underused resource, yet little has been written about the wide range of factors that need to be taken into account if we are to infer meaning from general practice data. Objective To report the complexity of general practice computer data and factors that need to be taken into account in its processing and interpret-ation.
Method We run clinically focused programmes that provide clinically relevant feedback to clinicians, and overviewstatistics to localities and researchers. However, to take account of the complexity of these data we have carefully devised a system of process stages and process controls to maintain referential integrity, and improve data quality and error reduc-tion. These are integrated into our design and pro-cessing stages. Our systems document the query,
reference code set and create unique patient ID. The design stage is followed by appraisal of: data entry issues, howconcepts might be represented in clini-cal systems, coding ambiguities, using surrogates where needed, validation and piloting. The sub-sequent processing of data includes extraction, migration and integration of data from different sources, cleaning, processing and analysis.
Results Results are presented to illustrate issues with the population denominator, data entry prob-lems, identification of people with unmet needs, and howroutine data can be used for real-world testing of pharmaceuticals.
Conclusions Routinely collected primary care data could contribute more to the process of health improvement; however, those working with these data need to understand fully the complexity of the context within which data entry takes place.
Introduction
General practice is highly computerised in the United Kingdom (UK), and the use of information tech-nology in routine practice is set to increase. A National Programme for Information Technology (NPfIT) is standardising the infrastructure throughout the National Health Service (NHS).1 This will facilitate data aggregation for two reasons. Firstly NPfIT will reduce the number of clinical systems; and secondly, making them all compatible with a national infor-mation Spine will facilitate inforinfor-mation sharing. In addition, the move to a single comprehensive con-trolled vocabulary for structured data, SNOMED-CT (Systematized Nomenclature of Medicine – Clinical Terms), will make it easier to transfer data between different services, including the primary care computer record.2 Newcontractual arrangements for general practitioners (GPs) will provide a further boost to record structured data, and build upon existing data quality initiatives.3 The newGP contract includes financially incentivised, evidence-based quality targets, such as measuring and controlling cholesterol in patients with ischaemic heart disease.4A limited set of general practice computer codes is used to monitor progress towards achieving these targets.
Current experience would suggest that even where there is a single national coding and classification system, variation and complexity exist. In the UK, we currently have a single coding system, often referred to as the ‘Read codes’. However, this has a number of versions, including the 4-byte and 5-byte variants of the earlier hierarchical system, as well as the more complex concept-based Clinical Terms Version 3.5This is further complicated by a number of other factors: one system does not use the Read drug dictionary, preferring a proprietary alternative; some general practice computer systems allowthe user to create their own codes and add them to the classification or have them as free-standing unmapped items; the coding systems are dynamic: newcodes are added all the time without old ones being removed. Generally the older codes from previous coding and classifi-cation systems, which are often more generic, cannot be mapped forward and therefore are left accessible via the coding look-up engine. There is an old adage in informatics: ‘You can map many to few; but you can’t map fewto many’. Where a more general code exists it can be mapped to more specific ones; but more specific codes cannot be mapped to generic ones. For example, the ethnicity code 9S6.. for ‘Indian’ can’t be readily mapped forward to the more detailed 9i... codes. For example, 9SA4. – North African Arab/Iranian has several alternative codes in the 9i... hierarchy as 9iF.. – Other, 9iFA. – North African or 9iFD. – Iranian.
These newer codes allow a larger number of codes covering more specific ethnic backgrounds. Some-times these older codes are selected because their less specific nature fits better with the more generic nature of primary care.
Routinely collected data from general practice is an underused resource. It has the potential to be harnessed to provide information about the quality of care, data for health service planning, and can also be used for research.6This paper describes the method which we have developed for working with primary care data for over ten years and provides examples of the clinical analyses that are underpinned by this approach. We describe the systematic approach we use to take account of the complexities of primary care data.
Method
Introduction:
Our method has three elements:
1 a system for ensuring traceability of any data processed, which is applied across all projects undertaken
2 a design method which ensures proper planning and piloting of data extraction
3 a processing system with quality controls at each stage.
System for ensuring traceability
It is important that data used for analysis is traceable, that is, any data item can be checked back to its source data. To achieve this we have identified a number of components which must be labelled in every project. These are:
. a query library – which holds the queries used to extract the data for the project
. listing and storage of a copy of the look-up tables
used to code and decode data. Generally this will consist of a Read look-up engine, either a defined version of CLUE (Clinical Information Consultancy Look Up Engine)7 or Triset browser.8We usually also need to specify additional look-up tables where a clinical system does not use Read codes for drugs or uses system-specific codes
. unique identifiers for each practice, primary care
numbers with unique arbitrary references extracted from practice systems, which we convert into case-insensitive, numeric-encoded ASCII (American Stan-dard Code of Information Interchange) format so they can be used in a range of database tools
. finally, a system of metadata headers ensures that
those cleaning, processing and analysing these data know what is original and what is derived data, and the queries from which the data were derived.9
Design
All data projects require careful planning. Design processes need to meet the objectives of any given project but need to be flexible and evolve. As our projects are usually clinically focused we need to define: (1) the dataset we plan to extract, (2) audit criteria, and (3) an analysis plan before data collection commences.
As the capacity and capability of computer systems have increased, so we have been able to extract and aggregate more data and perform more complex analyses. We judge whether output is up to standard by using the definition of data quality used in total data quality management (TDQM) as data fit for purpose by its consumers:10that is, in our case, data useable to improve chronic disease management, to improve the health of populations and for research.
The design process also includes the production of project documentation, and ensuring the process meets the standards set out in information governance and research ethics guidelines. We conclude the design stage by piloting the data extraction and processing. Important lessons learned from this are fed back into the design process.
Process stages
Our method of processing data has seven further distinct steps after the design phase.11The phases are an adaptation of taxonomy for error classification published by Berndtet al,12developed in the context of quality assurance of the healthcare data warehouse.
These are:
1 appraising data entry issues 2 data extraction
3 migration of the data into the data repository 4 integration of the data with other data sources 5 data cleaning
6 data processing 7 data analysis.
Appraisal of data entry is important as many things can influence what is recorded in computerised rec-ords. These range from bias associated with particular picking lists to the potentially distorting effects of
targets. Previously, data extraction was exclusively carried out using Morbidity Information Query and Export Syntax (MIQUEST), a Department of Health-sponsored data extraction software. More recently a broader range of tools have started to become avail-able (such as the Apollo SQL Interface13 and the proprietary extraction of the entire practice dataset from back-up tapes); as computer systems become compatible with the national Spine, so the scope to extract data will increase further.
Migration and integration of data require careful control. We have developed a system of metadata that allows consistent titles to be applied to data from the point of extraction to that of analysis. We use a variable name (effectively a column header) compounded from a number of sources. The first part of the variable name is a bi-gram which describes the type of data; next comes a repeat number to say whether this is the first time the data item has been collected; and, finally, the Read version 2 code for the data item being collected.9 Data cleaning involves removing out-of-range values and converting values where there is clearly a mixture of units (for example, heights in metres and in centi-metres are all converted into centi-metres). Data processing involves looking at the frequency of all the codes within each variable; converting them into plain English; and then grouping them into useful categories to meet the audit criteria or analysis plan defined at the design stage. Data analysis is done in a standard statistical analysis package; we generally use SPSS (Statistical Package for Social Sciences).
Our first step in analysis is ensuring that we have an accurate population denominator; without this much of the analysis would be meaningless. Although UK general practice has a system of registration that should only allowindividual patients to register with one GP at a time, GP lists are known to be inflated above the population numbers shown in the census data.14 Prac-tice list turnover also appears to influence recorded prevalence of disease: the higher the turnover the lower the apparent disease prevalence. Data loss occurs as only paper records are transferred between prac-tices, and structured, coded data has to be manually re-entered.
We next examine the prevalence of the disease or problem being investigated. Local variation in age–sex profile influences disease prevalence, as inevitably most chronic disease increases in prevalence with advancing age. For single practices, providing age–sex profiles compared with the national average is usually suf-ficient to convey an understanding of why prevalence might be different – we do this using bar charts or population pyramids.
Orientation of programme
Our method always involves feedback of clinically relevant evidence-based comparative data to the end-user of systems who have provided the data. This is summarised both at the practice and locality level, and in our viewis best done in a non-judgemental edu-cational context.3
Results
Design
Defining the dataset to be extracted, developing robust audit criteria and devising an analysis plan are critical parts of managing a research study. Box 1 shows the dataset used and audit criteria from an atrial fibril-lation (AF) study, designed to investigate whether there was scope to further improve the quality of care of patients with AF.16
Overcoming the barriers to data entry
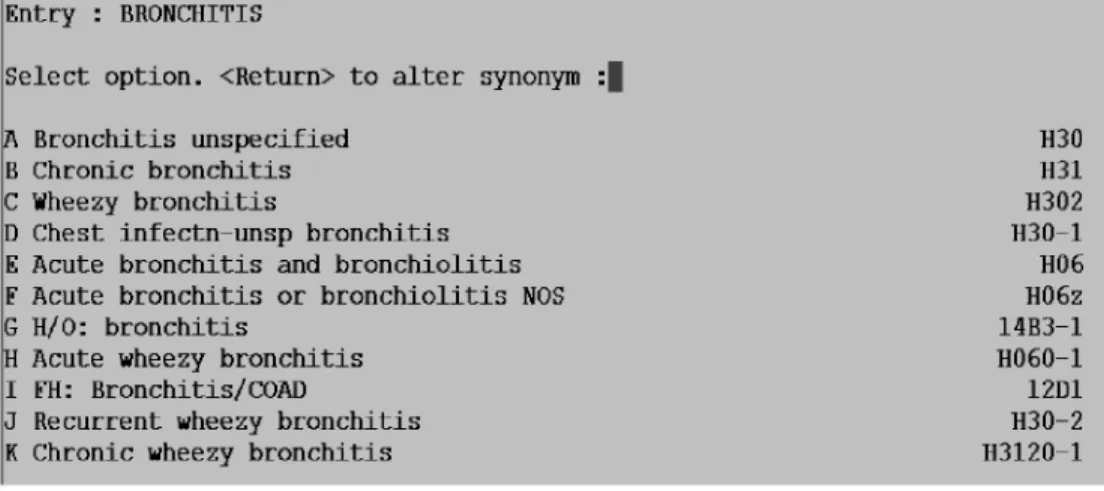
Problems can arise because of confusion about the classification system. Bronchitis provides examples of this. In patients with bronchitis it is not obvious from the coding screen (see Figure 1) that the H06 code should be used for acute disease, and that any of the codes that belong to the H3 hierarchy imply the patient has chronic obstructive pulmonary disease (COPD). This picking list is taken from one particular general practice computer system; other systems offer different lists which could bias code selection in a different way.17
Example output from routinely
collectedgeneral practice data
Examples are provided of output from: (a) a large cross-sectional study; (b) data used to identify at-risk groups; and (c) early results from the use of a new therapy. In a study based on a population of 2.4 million patients we were able to demonstrate, based on general practice data collected in 2002, that half of patients with coronary heart disease had their cholesterol raised above the target level of 5 mmol/l, and of these only half were prescribed a statin (see Figure 2).18
We have processed data to identify groups of patients at risk. We have calculated the glomerular filtration rate (GFR) in patients with creatinine recorded to assess whether they have chronic kidney disease (CKD). We have also assessed stroke risk in patients
with AF. In both cases patients at risk were identified who could benefit from readily available, low-cost, evidence-based interventions.19 Table 1 shows the proportion of people with stage 3 to 5 CKD who have cardiovascular disease, hypertension and dia-betes.
Table 2 demonstrates there are considerable num-bers of people with atrial fibrillation suboptimally managed (only the data for male patients is shown, but the same phenomena were seen for females).
We have also used this method of data collection to monitor the efficacy of the cholesterol-lowering drug ezetimibe. Early data from 12 practices suggest that it achieved similar lowering results to that reported in clinical trials.20
Where data are difficult
Although we can graph the age–sex profile of the practice, ethnicity data important in many disease areas (including CKD) are usually recorded in less than 0.5%of cases.19We were also not certain whether undiagnosed CKD in computer records was due to poor computer data quality or true failure to record this diagnosis in GP records. Only a manual search of 500 paper records confirmed that the computer data were reliable.21Data quality is also variable between different clinical areas. The input problems associated with the diagnosis of bronchitis make it hard to extract meaningful data about COPD from general practice computer records. The situation is even more difficult in osteoporosis. We have collected data from 78 practices and found that practices use different codes to label the same group of patients. Many more patients are on anti-osteoporosis therapy than have the diagnosis.22 However, feedback of the inter-practice variation in data recording does seem to improve data quality.23
Discussion
Box 1 Example of dataset and audit criteria taken from a study to examine whether there was scope to improve the management of atrial fibrillation (a heart rhythm disorder with an increasedrisk of stroke)
DATASET
Demographic details MIQUEST unique ID, age and sex
Diagnostic data Atrial fibrillation, hypertension, diabetes, coronary heart disease, TIA (transient ischaemic attack) or stroke, heart failure, mitral valve disease Cardiovascular risk factors Blood pressure, BMI (body mass index), smoking status, cholesterol level,
electrolytes, ECG (electrocardiogram) recording, echocardiogram results, INR (international normalised ratio)
Drug treatment Warfarin, aspirin, clopidogrel, dipyridamole, digoxin, ACE inhibitors
AUDIT CRITERIA 1 Co-morbidity
. The percentage of people with AF who have cardiovascular co-morbidities recorded, including previous
stroke or TIA, diabetes and heart failure
. The number of people with mitral valve disease or a history of rheumatic fever
2 Blood pressure management in AF
. The percentage of people with a blood pressure recorded
. The percentage of people with a blood pressure above the 140/85 mmHg and 150/90 mmHg thresholds
3 Left ventricular hypertrophy
. The percentage of people with an ECG or echocardiogram result . The proportion of these that indicate left ventricular hypertrophy 4 Lifestyle in people with AF
. The percentage of people with a smoking habit and BMI recorded
. The proportion of smokers and those with a raised BMI 5 Lipids and monitoring of electrolytes
. The percentage of people who have had their cholesterol measured . The achievement of national targets (<5 mmol/l for total cholesterol)
. The percentage with electrolytes recorded, and number with hypo- or hyperkalaemia or impaired renal
function
6 Anti-thrombus and anti-coagulant treatment
. The percentage of people with concurrent cardiovascular disease who have been offered anti-platelet or
anti-coagulant therapy; and the proportion where therapy is current (prescribed in the last three months)
. Recording of contraindications to aspirin and warfarin
. Proportion of those currently on warfarin with an ‘in range’ INR (2.0 to 3.0)
is recorded as a mixture of narrative (free-text) and structured and/or coded data. The informatician usually only extracts the coded data, with associated dates and numerical values, and derives meaning from this.
Greater standardisation of data recording between practices also has a role to play in improving the information that can be derived from general practice computer system data. This can be achieved by taking
part in data quality programmes like PRIMIS+,24 reducing the number of different computer systems that practitioners use, and looking to achieve more standardisation in the approach to managing con-ditions. The 2004 newGP contract, with its associated financially incentivised quality targets, has also had an effect on clinical coding, by specifying particular codes upon which performance will be measured. Across Cholesterol < or = 5 mmol/l Cholesterol > 5 mmol/l
No. of patients = 21 265 No. of patients = 21 287
42 552 patients with IHD who have a cholesterol recording
Not prescribed a statin No. of patients = 21766
Prescribed a statin No. of patients = 20 786 ‘Normal’ cholesterol
No statin
No. of pts = 10124
Raised cholesterol No statin
No. of pts = 11642
‘Normal’ cholesterol Prescribed a statin No. of pts = 11141
Raised cholesterol Prescribed a statin No. of pts = 9 645
Figure 2 Rule of halves for management of cholesterol in patients with heart disease
Table 1 Proportion of patients with cardiovascular disease, hypertension and diabetes with normal or mildly reduced GFR compared with those with stage 3 to 5 chronic kidney disease
Subgroup Patients with GFR
60 ml/min/1.73 m2
Patients with GFR <60 ml/min/1.73 m2
All 2
Qualitative descriptions
Normal GFR (>90)
Mildly reduced GFR (60–89)
Moderately reduced GFR
Severely reduced GFR
Kidney failure
Stage of CKD Stage 3 Stage 4 Stage 5
Number n=5791 n=17 619 n=5191 n=211 n=47 n=28 859
All
cardiovascular disease
21.9% 43.0% 74.3% 83.9% 89.4% 44.8% P<0.001
Diabetes 7.7% 9.6% 14.9% 25.6% 19.1% 10.3% P<0.001
IHD 4.9% 13.2% 26.5% 31.8% 23.4% 14.1% P<0.001
Heart failure 0.4% 1.3% 8.5% 17.5% 8.5% 2.6% P<0.001
Peripheral vascular disease
0.6% 1.1% 2.8% 6.2% 2.1% 1.4% P<0.001
Cerebrovascular disease
1.9% 4.5% 11.9% 14.7% 14.9% 5.4% P<0.001
Hypertension 13.2% 31.0% 55.4% 64.5% 80.9% 32.1% P<0.001
BMI recording 67.1% 75.9% 77.2% 73.5% 70.2% 74.3%
much of the rest of Europe primary care uses the more limited International Classification of Primary Care (ICPC).5
General practice data has limitations. There are problems with the denominator, which is known to be inflated.14 Data are inevitably incomplete for a variety of reasons, and missing data requires careful interpretation. The meaning of medical language and medical knowledge change with time, making it im-portant to interpret data in the context of the time at which it was reported.
Rector has challenged the reuse of routinely col-lected data and stresses the difficulty of data colcol-lected in one context being used in another.25 However, despite its limitations there has been a growth in the usage of general practice data, as reflected by the large numbers of databases that are listed in the Directory of Clinical Databases (DoCDat).26
Further research is needed to explore howto in-crease the lowlevels of ethnicity recording, and howto link more effectively to social class data than just using postal codes. Merging data with other sources from other agencies remains underdeveloped. Linkage to social services data may be problematic as social services use event- or problem-centred rather than person-centred records (for example, social services may have
a case conference, the output of which contains import-ant data about many individuals, whereas health records usually just relate to one individual).
Conclusions
Improvements in technology and data quality have meant that larger datasets can be extracted from clinical systems and processed in more sophisticated ways. There is a growing evidence base that routinely collected general practice data is used in audit to improve the quality of chronic disease management, for health service planning and research. Informati-cians and epidemiologists need to publish more de-tails about their methodologies, so that the consumers of their outputs knowthey have taken into account the complexities of primary care data.
ACKNOWLEDGEMENTS
The Primary Care Data Quality Programme, which runs within the Department of Community Health Table 2 Management of male patients with AF by degree of risk
Males No. of
cases (n)
% of people with AF
% prescribed warfarin
% prescribed aspirin
% hyper-tensive
% diabetic
% heart failure
Mean systolic BP (mmHg)
% smokers
Level of risk Very high: previous ischaemic stroke or TIA
87 17.3 51.7 31.0 55.2 10.3 20.7 137.0 32.2
High: age over 65 and one other risk factor, from: hypertension, diabetes, heart failure, left ventricular dysfunction
202 40.2 43.1 30.2 75.2 26.7 34.2 137.5 30.7
Moderate: age over 65, with no other risk factors, or age under 65, with other risk factors
141 28.0 42.6 30.5 22.0 7.1 3.5 135.9 32.6
Low: age under 65, with no other risk factors
73 14.5 28.8 15.1 0.0 0.0 0.0 129.2 35.6
Sciences at St George’s Hospital – University of London, has been funded by sponsors of clinical programmes and participating primary care trusts. MSD Pharma-ceuticals has been the largest sponsor through a series of unconditional educational grants.
REFERENCES
1 Humber M. National programme for information tech-nology.British Medical Journal2004;328:1145–6. 2 Wasserman H and Wang J. An applied evaluation of
SNOMED-CT as a clinical vocabulary for the computer-ized diagnosis and problem list.Proceedings of the AMIA Annual Fall Symposium2003:699–703.
3 de Lusignan S and Teasdale S. The features of an effective primary care data quality programme. In: Bryant J (ed). Current Perspectives in Healthcare Computing, 2004. Proceedings of HC 2004. Swindon: British Computer Society, 2004, pp. 95–102.
4 Fleetcroft R and Cookson R. Do the incentive payments in the newNHS contract for primary care reflect likely population health gains?Journal of Health Services Research and Policy2006;11:27–31.
5 de Lusignan S. Codes, classifications, terminologies and nomenclatures: definition, development and application in practice.Informatics in Primary Care2005;13:65–70. 6 de Lusignan S and van Weel C. The use of routinely collected computer data for research in primary care: opportunities and challenges.Family Practice2005;Dec 20; [Epub ahead of print] PMID: 16368704.
7 Clinical Information Consultancy (CIC). CLUE (CIC Look Up Engine). www.clininfo.co.uk/main/clue.htm 8 NHS Clinical Terminology Service. Clinical
Termin-ology Browser (Triset). www.nhsia.nhs.uk/terms/pages/ ct_browser.asp?om=m1
9 van Vlymen J and de Lusignan S. A system of metadata to control the process of query, aggregating, cleaning and analyzing large datasets of primary care data.Informatics in Primary Care2005;13:281–91.
10 Wang RY and Strong DM. Beyond accuracy: what data quality means to data consumers.Journal of Manage-ment Information Systems1996;12:5–34.
11 van Vlymen J, de Lusignan S, Hague N, Chan T and Dzregah B. Ensuring the quality of aggregated general practice data: lessons from the Primary Care Data Quality Programme (PCDQ).Studies in Health Tech-nology and Informatics2005;116:1010–15.
12 Berndt DJ, Fisher JW, Hevner AR and Studinicki J. Healthcare data warehousing and quality assurance. IEEE Computer2001;34:56–65.
13 Apollo-Medical. SQL Suite. www.apollo-medical.com/ products/sqlfeatures.htm
14 Ashworth M, Jenkins M, Burgess Ket al. Which general practices have higher list inflation? An exploratory study.Family Practice2005;22:529–31.
15 Thiru K, de Lusignan S, Sullivan F, BrewS and Cooper A. Three steps to data quality.Informatics in Primary Care 2003;11:95–102.
16 de Lusignan S, van Vlymen J, Hague Net al. Preventing stroke in people with atrial fibrillation: a cross-sectional study.Journal of Public Health2005;27:85–92.
17 Falconer E and de Lusignan S. An eight-step method for assessing diagnostic data quality in practice: chronic obstructive pulmonary disease (COPD) as an exemplar. Informatics in Primary Care2004;12:243–54.
18 de Lusignan S, Dzregah B, Hague N and Chan T. Cholesterol management in patients with ischaemic heart disease: an audit-based appraisal of progress towards clinical targets in primary care.British Journal of Cardi-ology2003;10:223–8.
19 de Lusignan S, Chan T, Stevens P et al. Identifying patients with chronic kidney disease from general prac-tice computer records.Family Practice2005;22:234–41. 20 Stein E, Stender S, Mata Pet al. Ezetimibe Study Group. Achieving lipoprotein goals in patients at high risk with severe hypercholesterolemia: efficacy and safety of ezetimibe co-administered with atorvastatin.American Heart Journal2004;148:447–55.
21 Anandarajah S, Tai T, de Lusignan Set al. The validity of searching routinely collected general practice computer data to identify patients with chronic kidney disease (CKD): a manual reviewof 500 medical records. Neph-rology, Dialysis, Transplantation2005;20:2089–96. 22 de Lusignan S, Valentin T, Chan T, Hague N, Wood O
and Dhoul N. Problems with primary care data quality: osteoporosis as an exemplar.Informatics in Primary Care 2004;12:147–56.
23 de Lusignan S, Hague N, Brown A and Majeed A. An educational intervention to improve data recording in the management of ischaemic heart disease in primary care.Journal of Public Health2004;28:34–7.
24 PRIMIS+. www.primis.nhs.uk
25 Rector AL. Clinical terminology: why is it so hard? Methods of Information in Medicine1999;38:239–52. 26 London School of Hygiene and Tropical Medicine.
Directory of Clinical Databases (DoCDat).www.lshtm. ac.uk/docdat/
CONFLICTS OF INTEREST
None.
ADDRESS FOR CORRESPONDENCE
Simon de Lusignan
Senior Lecturer, Primary Care Informatics Division of Community Health Sciences St George’s Hospital Medical School London SW17 0RE
UK
Tel: +44 (0)208 725 5661 Fax: +44 (0)208 767 7697 Email: slusigna@sgul.ac.uk