www.msjonline.org pISSN 2320-6071 | eISSN 2320-6012
Original Research Article
Comparison of platelet count by manual and automated method
Dileep Kumar Jain*
INTRODUCTION
Platelets are non-nucleated discoid 1-3µ cells, produced in bone marrow megakaryocytes by fragmentation of cytoplasm.1 Platelets serve both structural and molecular functions in blood clotting.2 Platelet count is frequently advised recently, especially in dengue fever season. Almost all pathology labs are overloaded with requests for platelet counts during outbreak of dengue fever every year, because of risk of bleeding if count goes very low (<10,000/mm3). Apart from this, regular platelet count is needed in patients on chemotherapy and in pregnancy induced hypertension, malaria, bacterial sepsis, leukemia.3
Platelet being common investigation in laboratory, we require economical and accurate method. Manual method by Neubaeur chamber needs 1% ammonium oxalate as
diluting fluid while automated method requires costly equipment (4-5 lakhs) as well as maintenance whereas manual slide method is simple, cheap, feasible, reliable if done properly.4 Results are comparable to automated method except if count is very low. Normal platelet count in healthy person is 1.5-4.0 lakh/mm3 of blood.1,5 Imoru in his study found multiplying by 20,000 to the average of 10 oil field platelet count yielded better results comparable to hematology analysers than multiplying by 15000 as advocated by some other authors.6
International council for standardization in hematology (ICSH) and International society for laboratory in hematology (ISLH) have recommended immuonoplatelet counting is the reference method for calibration of automated hematology analyzers. For this a flow cytometer and experienced technicians are required.5,7 Occasionallyplatelet satellitism may give wrong results Department of Pathology, Hind Institute of Medical Sciences, Safedabad, Barabanki, Uttar Pradesh, India
Received: 24 August 2020
Revised: 09 September 2020
Accepted: 10 September 2020
*Correspondence:
Dr. Dileep Kumar Jain,
E-mail: [email protected]
Copyright: © the author(s), publisher and licensee Medip Academy. This is an open-access article distributed under the terms of the Creative Commons Attribution Non-Commercial License, which permits unrestricted non-commercial use, distribution, and reproduction in any medium, provided the original work is properly cited.
ABSTRACT
Background: Since the emergence of dengue fever in the past few years, platelet count has become a routine test in every pathology lab. Common methods are by peripheral blood smears made from blood collected in ethylenediaminetetraacetic acid (EDTA) tubes, by neubaeur chamber, automated method by hematology cell counter.
Methods: Blood samples of 460 adult patients and 72 children (<15 years), including indoor and outdoor, between May to August 2019, attending Hind institute of medical sciences, were collected in EDTA tubes. Samples were properly mixed on blood shaker and immediately peripheral blood smears were made and stained with Leishman stain. Platelet count of every sample was done by peripheral blood smear and by Mindray (BC5150) automated cell counter, simultaneously.
Results: Results by manual slide method are slightly higher than automated method but significantly not different from automated method.
Conclusions: Traditional slide method can also be used if done carefully comparable to automated method especially useful in small labs which can’t afford automated cell counter.
Keywords: Platelet count, Manual, Automated, Cell counter, Peripheral blood smear
by automated cell counter in ethylenediaminetetraacetic
acid (EDTA) samples.8,9 Results of automated counters can’t be totally relied in severe thrombocytopenia also.10
Aims and objectives
To evaluate accuracy of manual slide method in comparison to automated method by processing same sample at the same time by both methods in same laboratory.
METHODS
We took 532 patients’ (460 adults and 72 children) platelet count into consideration between May to August 2019 including indoor and outdoor patients, attending Hind institute of medical sciences (HIMS), Safedabad, Barabanki. 2 ml blood samples were collected in tubes containing K3EDTA anticoagulant in central laboratory of HIMS. After proper mixing on blood shaker for 10 minutes, a CBC (complete blood count) including platelet count was done by Mindray cell counter (BC-5150). Simultaneously peripheral blood smears were made from freshly collected EDTA blood after proper mixing on shaker and stained with Leishman stain.11 Automated method on Mindray cell counter is based on principle of electronic impedance for cell counting. Automated hematology analyzer was regularly maintained and calibrated as per company guidelines. In slide method, we counted platelets under oil immersion lens (100X) in 10 fields, where RBCs are just touching each other in monolayer sheet, and then took average of ten fields multiplied it by 20,000. Those slides showing platelet aggregates or giant platelets were excluded from study.
Estimated platelet count/cu mm is equal to average count in 10 fields multiplied by 20,000 (thousand/mm3). The results were grouped as follows, a total of 532 samples were processed and platelet counts done by both methods. Out of these 238 were males and 294 females, 460 adults, 72 children. The processing of the data was performed usingR statistical software.
Table 1: Categorisation of patients into different group based on their platelet count.
Number of
patients Platelet count Group
93 <1.5 lakh/mm3 Low, group 1
426 1.5 -4.0 lakh/mm3 Normal, group 2
13 >4.0 lakh/mm3 High, group 3
Simple linear regression analysis and coefficient of determination (R2) for correlation analysis between the two methods were used. All tests were applied at a 99% level of significance. Mean platelet count by manual method was 2.02 lakh/mm3, while with automated method was 1.78 lakh/mm3.
RESULTS
Platelet counts by manual slide method are comparable to results by automated method done on Mindray (BC5150) 5part blood cell counter. The platelet count by manual method was slightly higher than automated method, but is quite accurate (p<0.01).
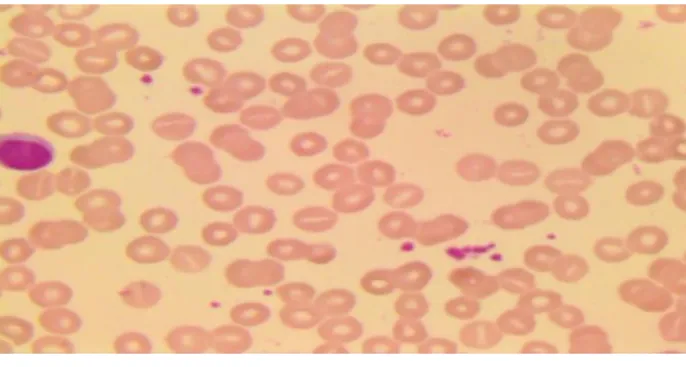
Figure 1: Platelets seen in clump (Leishman stain 10×100).
Figure 2: Giant platelet (Leishman stain 10×100).
A linear regression analysis was run for group 1 (using R statistical software) keeping manual platelet count as the dependent variable and automated platelet count as the independent variable. The results obtained were:
Coefficients:
Estimate std. error: t value Pr(>|t|) with (intercept) 0.43075 0.04871 8.843 6.74e-14, ceosal1$Automated 0.77730 0.05423 14.335 < 2e-16.
Residual standard error: 0.1785 on 91 degrees of freedom
Multiple R-squared: 0.6931, Adjusted R-squared: 0.6897
F-statistic: 205.5 on 1 and 91 DF, p value: <2.2e-16
The generated equation was:
𝑌 = 0.43075 + 0.77730 ∗ X
Table 2: Group 1 statistics (central tendencies).
Methods Mean Median Standard deviation
Manual 1.08 1.2 0.32
Automated 0.83 0.88 0.34
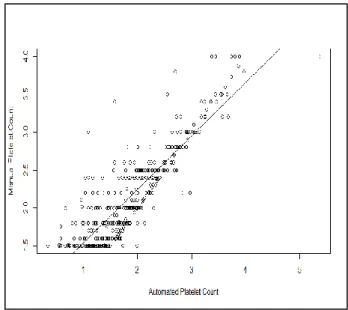
The above-mentioned results are statistically significant at 99.99% (p<0.0001) level of significance. Thus, we can reject null hypothesis at 99% level of significance. The same has been graphically depicted (Figure 3).
Figure 3: Regression analysis scatterplot of group 1 comparing manual and automatic platelet counts
showing moderate to wide dispersion.
A linear regression analysis was run for group2 (using R statistical software) keeping manual platelet count as the dependent variable and automated platelet count as the independent variable. The results obtained were:
Coefficients:
Estimate std. error: t value Pr(>|t|) (Intercept): 0.82855 0.03834 21.61 <2e-16, ceosal1$, Automated 0.70749 0.01909 37.07 <2e-16
Residual standard error: 0.2873 on 424 degrees of freedom
Multiple R-squared: 0.7642, Adjusted R-squared: 0.7636
F-statistic: 1374 on 1 and 424 DF, p-value: <2.2e-16
The generated equation was:
𝑌 = 0.82855 + 0.70749 ∗ 𝑋
Where Y= manual platelet count and X= Automated platelet count.
Table 3: Group 2 statistics (central tendencies).
Methods Mean Median Standard deviation
Manual 2.15 2 0.59
Automated 1.87 1.79 0.73
The above-mentioned results are statistically significant at 99.99% (p<0.0001) level of significance. Thus we can reject null hypothesis at 99% level of significance. The same has been graphically depicted (Figure 4).
Figure 4: Regression analysis scatterplot of group 2 comparing manual and automatic platelet counts
showing moderate to wide dispersion.
A linear regression analysis was run for group 3 (using R statistical software) keeping Manual Platelet count as the dependent variable and Automated Platelet count as the independent variable. The results obtained were:
Coefficients:
Estimate std. error: t value Pr(>|t|) (Intercept): 0.56386 0.37257 1.513 0.158, ceosal1$Automated 0.80911 0.07525 10.752 3.57e-07
Residual standard error: 0.3341 on 11 degrees of freedom
Multiple R-squared: 0.9131, Adjusted R-squared: 0.9052
F-statistic: 115.6 on 1 and 11 DF, p-value: 3.566e-07
The generated equation was:
𝑌 = 0.56386 + 0.80911 ∗ 𝑋
Where Y= manual platelet count and X= Automated platelet count.
Table 4: Group 3 statistics (central tendencies).
Methods Mean Median Standard deviation
Manual 4.44 4.50 1.09
Automated 4.84 4.91 1.28
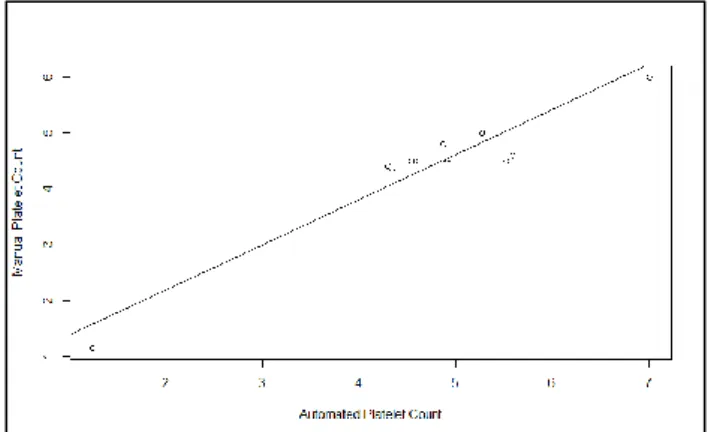
Figure 5: Regression analysis scatterplot of group 3
comparing manual and automatic platelet counts showing moderate to wide dispersion.
Table 5: Measure of relationship between manual and automated platelet count by Pearson correlation.
Variables Group 1
Group 2
Group 3
Pearson correlation 0.32 0.87 0.96
Slope 0.78 0.71 0.81
Intercept 0.43 0.83 0.56
DISCUSSION
Automated platelet count by cell counter has to be cross checked by slides because sometimes particles of similar size like platelet aggregates, platelet clumps, microcytes, WBC fragments, giant platelets also scatter light. This can happen with most expensive and accurate hematology analyzers also.12
Manual platelet count by thin air-dried film have enough accuracy, although manual platelet counts are highly variable as compare to automated platelet count.13Anitha
et al also in their study found no significant (p=0.4, thus the null hypothesis was not rejected that is the difference in mean is zero) difference of values between manual slide method of platelet estimation (2.76±0.71 lakhs/mm3) when compared with that of automated cell counter platelet value (2.64±0.73 lakhs/mm3 ).14 Bapai et al in their study also found no significant (p value = 0.69) difference of values between slide method of platelet estimation (0.94±0.29 lacs/mm3) when compared with that of automated cell counter platelet value (0.91 lacs/mm3±0.27).15 Mohamed-Rachid et al in their study noticed significant correlation between immunological technique and manual method (r=0.80, p<0.0001).16 Momani et al in their study reported that there is no significant difference in count by manual method as compared to automated method (p<0.05).12 Malok et al found very strong correlation between manual method and automated method (p=0.87, r=0.90) . They found mean platelet count by traditional method 269,000/μl and 268,000 by automated method.17 Castromayor et al found
significant difference between manual and automated
platelet count results with p value <0.05.13 Balakrishnan et al also found significant correlation between manual and automated platelet count (p=0.50).18 Webb et al found quiet close results in comparison to automated method by multiplying 15000 to average number of platelets in 10 oil fields.19 Anchinmane et al found very strong correlation by multiplying with 20,000 (r=0.9789).3 Maloket al also found strong correlation with automated count by multiplying with 20,000 (r=0.90).17 Lazreg et al in their study found Brahmi’s method that derives platelet count in stained blood smears by RBC: platelet ratio show better correlation with automated count (r=0.834) than Anitha’s method (r=0.596) where RBC count is not required , better suited for rural areas.20,21 Zainab et al found excellent agreement between different raters using
manual platelet estimation. Intraclass correlation
coefficient (ICC) across the four raters was 0.840 in patients with platelet count less than 1.0 lakh per cubic
millimeter.22 Lawrence et al compared triplicate
automated and manual platelet counts on
thrombocytopenic patients with platelet counts from 4-30×10(9)/l. The triplicate automated platelet counts differed by no more than 5×10(9)/l among themselves, whereas the manual counts varied by as much as 30×10(9)/l.23
CONCLUSION
A significant positive correlation is present between the manual slide and the automated method though correlation is slightly low in group 1(<1.5 lakh/cubic millimetre). Thus, manual method can be used in small labs where patient load is less, who can’t afford blood cell counter as it is costly to operate and maintain, especially for a country like India.
Funding: No funding sources Conflict of interest: None declared Ethical approval: Not required
REFERENCES
1. Afzal MM, Indira V, Colonel DR. Role of peripheral blood smear examination and manual platelet counts as an adjunct to automated platelet count. MRIMS J Health Sci. 2019;7(3):81-4. 2. Campbell NA. Platelets are pinched-off cytoplasmic
fragments of specialized bone marrow cells. In: Cain M, Minorsky P, Reece J, Urry L, Wasserman eds. Biology. 8th edn. London: Pearson; 2008. 3. Anchinmane VT, Sankhe SV. Utility of peripheral
blood smear in platelet count estimation. Int J Res Med Sci. 2019;7:434-7.
4. Becton-Dickinson. Unopette WBC/Platelet determination for manual methods. Rutherford, N.J.: Becton, Dickinson, and Company; 1996: 2.
French-speaking cellular hematology group. J Clin Med. 2020;9:808.
6. Imoru M. Determination of platelet and white blood cell counts from peripheral blood smear: an indispensable method in under-resourced laboratories. Int Blood Res Rev. 2016;5(2):1-7. 7. International council for standardization in
haematology expert panel on cytometry; International society of laboratory hematology task force on platelet counting. Platelet counting by the RBC/platelet ratio method. A reference method. Am J Clin Pathol. 2001;115(3):460-4.
8. Chakrabarti I. Platelet satellitism: a rare, interesting, in vitro phenomenon. Indian J Hematol Blood Transfus. 2014;30(3):213-4.
9. Zandecki M, Genevieve F, Gerard J, Godon A. Spurious counts and spurious results on haematology analysers: a review. Part I: platelets. Int J Lab Hematol. 2007;29(1):4-20. 10. De la Salle BJ, McTaggart PN, Briggs C, Harrison
P, Dore CJ, Lonair I, et al. The accuracy of platelet counting in thrombocytopenic blood samples distributed by the UK National external quality assessment scheme for general haematology. Am J Clin Pathol. 2012;137(1):65-74.
11. Kolawole F, Okogun G, Omisakin C, Adeyemi A, Ayodele E. Modified Leishman Stain: The Mystery Unfolds. British Journal of Medicine and Medical Research. 2014;4:4591-4606.
12. Asim M, Rame K, Mansour H, Bayan Z, Hala S, Ngah D, et al. Platelet count; automated vs manual estimation on blood smear Prince Rashid hospital, RMS. Int J Biol Med Res. 2015;6(3):5148-50. 13. Castromayor APA, Cadete J, Agreda L. Comparison
between manual and automated platelet counts of adult patients with thrombocytopenia at St. Paul's hospital Iloilo (SPHI), Philippines. HemaSphere. 2019;3(S1):1005.
14. Anitha K, Itagi I, Itagi V. Compasrison of platelet count by peripheral smear method and automated method in pregnant women. Natl J Physiol Pharm Pharmacol. 2014;4:39-42.
15. Bajpai R, Rajak C, Poonia M. Platelet estimation by peripheral smear: Reliable, rapid, cost effective
method to assess degree of thrombocytopenia. Inter J Medical Sci Prac. 2015;2(2):90-93.
16. Mohamed-Rachid B, Raya AF, Sulaiman AH, Salam AK. Comparative analysis of four methods for enumeration of platelet counts in thrombocytopenic patients. J Appl Hematol. 2015;6: 119-24.
17. Malok M, Titchener EH, Bridgers C, Lee BY, Bamberg R. Comparison of two platelet count estimation methodologies for peripheral blood smears. Clin Lab Sci. 2007;20(3):154-60.
18. Balakrishnan A, Shetty A, Vijaya C. Estimation of platelet counts: auto analyzer versus counts from peripheral blood smear based on traditional and platelet: red blood cell ratio method. Tropical J Pathol Microbiol. 2018;4 (5):389-95.
19. Webb DI, Parker L, Webb K. Platelet count assessment from peripheral blood smear (PBS). Alaska Medicine. 2004;46(4):92-5.
20. Brahimi M, Osmani S, Arabi A, Soltane B, Taghezout Z, Elkhaili BS, et al. The estimation of platelet count from a blood smear on the basis of the red cell: platelet ratio. Turk J Haematol. 2009;26(1): 21-4.
21. Lazreg H, Benaoum MN, Adda A, Brahimi M. Which method is the best for estimating platelet count?. Natl J Physiol Pharm Pharmacol. 2014;4: 177-78.
22. Hosni ZS, Khabori M, Mamari S, Al-Qasabi J, Davis H, Al-Lawati H, et al. reproducibility of manual platelet estimation following automated low platelet counts. Oman Med J. 2016;31(6):409-13.
23. Lawrence JB, Yomtovian RA, Dillman C, Masarik SR, Chongkolwatana V, Creger, RJ, et al. Reliability of automated platelet counts: comparison with manual method and utility for prediction of clinical bleeding. Am J Hematol. 1995;48:244-50.