Original citation:
Hyseni, L., Elliot-Green, A., Lloyd-Williams, F., Kypridemos, C., O'Flaherty, M., McGill, R.,
Orton, L., Bromley, H., Cappuccio, Francesco and Capewell, S.. (2017) Systematic review of
dietary salt reduction policies : evidence for an effectiveness hierarchy? PLoS One, 12 (5).
e0177535.
Permanent WRAP URL:
http://wrap.warwick.ac.uk/88526
Copyright and reuse:
The Warwick Research Archive Portal (WRAP) makes this work of researchers of the
University of Warwick available open access under the following conditions.
This article is made available under the Creative Commons Attribution 4.0 International
license (CC BY 4.0) and may be reused according to the conditions of the license. For more
details see:
http://creativecommons.org/licenses/by/4.0/
A note on versions:
The version presented in WRAP is the published version, or, version of record, and may be
cited as it appears here.
Systematic review of dietary salt reduction
policies: Evidence for an effectiveness
hierarchy?
Lirije Hyseni
1*
, Alex Elliot-Green
1, Ffion Lloyd-Williams
1, Chris Kypridemos
1,
Martin O’Flaherty
1, Rory McGill
1, Lois Orton
1, Helen Bromley
1, Francesco P. Cappuccio
2,
Simon Capewell
11 Department of Public Health and Policy, Institute of Psychology, Health and Society, University of Liverpool, Liverpool, United Kingdom, 2 University of Warwick, WHO Collaborating Centre, Warwick Medical School, Coventry, United Kingdom
*L.hyseni@liv.ac.uk
Abstract
Background
Non-communicable disease (NCD) prevention strategies now prioritise four major risk
fac-tors: food, tobacco, alcohol and physical activity. Dietary salt intake remains much higher
than recommended, increasing blood pressure, cardiovascular disease and stomach cancer.
Substantial reductions in salt intake are therefore urgently needed. However, the debate
con-tinues about the most effective approaches. To inform future prevention programmes, we
systematically reviewed the evidence on the effectiveness of possible salt reduction
interven-tions. We further compared “downstream, agentic” approaches targeting individuals with
“upstream, structural” policy-based population strategies.
Methods
We searched six electronic databases (CDSR, CRD, MEDLINE, SCI, SCOPUS and the
Campbell Library) using a pre-piloted search strategy focussing on the effectiveness of
pop-ulation interventions to reduce salt intake. Retrieved papers were independently screened,
appraised and graded for quality by two researchers. To facilitate comparisons between the
interventions, the extracted data were categorised using nine stages along the agentic/
structural continuum, from “downstream”: dietary counselling (for individuals, worksites or
communities), through media campaigns, nutrition labelling, voluntary and mandatory
refor-mulation, to the most “upstream” regulatory and fiscal interventions, and comprehensive
strategies involving multiple components.
Results
After screening 2,526 candidate papers, 70 were included in this systematic review (49
empirical studies and 21 modelling studies). Some papers described several interventions.
Quality was variable. Multi-component strategies involving both upstream and downstream
interventions, generally achieved the biggest reductions in salt consumption across an
a1111111111
a1111111111
a1111111111
a1111111111
a1111111111
OPEN ACCESS
Citation: Hyseni L, Elliot-Green A, Lloyd-Williams F,
Kypridemos C, O’Flaherty M, McGill R, et al. (2017) Systematic review of dietary salt reduction policies: Evidence for an effectiveness hierarchy? PLoS ONE 12(5): e0177535.https://doi.org/10.1371/journal. pone.0177535
Editor: Bhavani Shankar, SOAS, University of
London, UNITED KINGDOM
Received: July 18, 2016
Accepted: April 29, 2017
Published: May 18, 2017
Copyright:©2017 Hyseni et al. This is an open access article distributed under the terms of the
Creative Commons Attribution License, which permits unrestricted use, distribution, and reproduction in any medium, provided the original author and source are credited.
Data Availability Statement: All relevant data are
within the paper and its Supporting Information files.
Funding: Lirije Hyseni, Rory McGill and Lois Orton
entire population, most notably 4g/day in Finland and Japan, 3g/day in Turkey and 1.3g/day
recently in the UK. Mandatory reformulation alone could achieve a reduction of
approxi-mately 1.45g/day (three separate studies), followed by voluntary reformulation (-0.8g/day),
school interventions (-0.7g/day), short term dietary advice (-0.6g/day) and nutrition labelling
(-0.4g/day), but each with a wide range. Tax and community based counselling could, each
typically reduce salt intake by 0.3g/day, whilst even smaller population benefits were derived
from health education media campaigns (-0.1g/day). Worksite interventions achieved an
increase in intake (+0.5g/day), however, with a very wide range. Long term dietary advice
could achieve a -2g/day reduction under optimal research trial conditions; however, smaller
reductions might be anticipated in unselected individuals.
Conclusions
Comprehensive strategies involving multiple components (reformulation, food labelling and
media campaigns) and “upstream” population-wide policies such as mandatory
reformula-tion generally appear to achieve larger reducreformula-tions in populareformula-tion-wide salt consumpreformula-tion than
“downstream”, individually focussed interventions. This ‘effectiveness hierarchy’ might
deserve greater emphasis in future NCD prevention strategies.
Introduction
Non-communicable diseases (NCDs) kill over 35 million people annually. Common cancers,
cardiovascular diseases, diabetes, respiratory diseases and dementia together now account for
over two thirds of the entire global burden of disability and death.[
1
,
2
] These NCDs are mainly
attributable to just four major risk factors. Furthermore, the contribution from poor diet
exceeds the combined contribution from alcohol, tobacco and physical inactivity.[
3
] This poor
diet mainly reflects a predominantly unhealthy global food environment, dominated by
pro-cessed foods high in sugar, saturated fat, trans-fat and, crucially, salt.[
3
]
In the UK and other high income countries, over 70% of dietary salt is consumed in
pro-cessed foods such as bread, breakfast cereals, propro-cessed meats, snack foods, soups and sauces.
[
4
–
6
] This food environment contributes to excessive salt intake among adults, on average
10g/day or more,[
7
] far in excess of what the body actually needs.[
8
] High salt intake is a
major risk factor for increasing blood pressure,[
9
–
11
] cardiovascular disease,[
12
–
14
] stroke,
[
15
,
16
] and stomach cancer.[
17
–
19
] Moreover, a reduction in salt intake would substantially
reduce this risk.[
10
]
WHO recommends a maximum adult salt intake of 5g/day.[
20
] Different strategies and
policy options have been proposed to achieve this goal. Individual level interventions often
involve behavioural approaches, for example dietary counselling, leaflets or medical advice.
These are sometimes termed “downstream” or “agentic” interventions, and are dependent on
the individual responding. [
21
,
22
] Conversely, “upstream” structural interventions take place
at the population level and typically involve policies such as regulatory approaches, taxes or
subsidies. Finally, intermediate interventions target subgroups in worksites, schools or
com-munities.[
23
]
National salt reduction strategies were identified in 75 countries in 2015, a substantial
increase from 32 in 2010.[
24
] However, the debate regarding the most effective and acceptable
salt reduction strategy continues.
Sheffield, Bristol, Cambridge, Exeter, UCL; The London School for Hygiene and Tropical Medicine; the LiLaC collaboration between the Universities of Liverpool and Lancaster and Fuse; The Centre for Translational Research in Public Health. The work was carried out under the remit of the WHO Collaborating Centre for Nutrition of the University of Warwick. The views expressed are those of the authors and not necessarily those of the NHS, the NIHR, the Department of Health or the World Health Organization. All other authors were funded by HEFCE. The funders had no role in study design, data collection and analysis, decision to publish, or preparation of the manuscript.
Competing interests: The authors have declared
Notable policy approaches have been seen in Finland,[
25
] Japan,[
26
] and more recently,
the United Kingdom.[
27
] In the UK, a combination of awareness campaigns, agreed target
set-tings, voluntary reformulation from industry and population monitoring of salt consumption
have led to a 1.4g per day reduction in population salt intake between 2001 and 2011 (the
cam-paign started in 2003).[
27
] However, health inequalities in salt consumption have persisted.
[
28
,
29
] Furthermore, the introduction of the UK Responsibility Deal in 2010 shifted emphasis
to ‘downstream’ interventions, coupled with ineffective voluntary agreements and,
controver-sially, the direct involvement of the industry in policy decisions.[
30
,
31
]
Geoffrey Rose famously advocated population wide approaches rather than targeting
high-risk individuals.[
32
] Furthermore, there seems to be some evidence for a public health
‘effec-tiveness hierarchy’ whereby “upstream” structural interventions consistently achieve larger
improvements in population health, are more equitable and often reduce health inequalities
[
33
,
34
] compared to “downstream” agentic interventions targeting individuals, for instance in
tobacco control and alcohol policies.[
35
,
36
] Emerging evidence suggests that a comparable
effectiveness hierarchy might also exist for salt reduction strategies, whereby upstream
inter-ventions apparently achieve bigger reductions in salt intake.[
37
,
38
]. To test this hypothesis and
hence inform future preventive health strategies, we have systematically reviewed the evidence
for studies focusing on the effectiveness of salt interventions to reduce salt intake.
Methods
Study design
We conducted a systematic review of interventions intended to decrease population dietary
salt intake. To ensure proper conduct, we adhered to the PRISMA checklist (Preferred
Report-ing Items for Systematic Reviews and Meta-Analyses)(
S1 Table
).[
39
] We used a narrative
syn-thesis and formally investigated evidence to support or refute an effectiveness hierarchy. The
research protocol can be found in
S1 File
.
Search strategy
We first identified exemplar studies to define and refine search terms needed for targeted
searches. The search strategy consisted of a combination of four sets of key words:
1) salt, sodium; 2) health promotion, nutrition education, campaigns, dietary counselling,
regulation, legislation, tax, self-regulation, reformulation, social marketing, promotion,
provi-sion, labelling, marketing control, primary care advice, food industry; 3) public policy, health
policy, nutrition policy, policies, interventions, strategies, initiatives, programmes, policy
option, actions; and 4) effectiveness, effect, intake, consumption, reduction, cost-benefit
analy-sis, and cardiovascular diseases.
Study selection and inclusion criteria
Studies were included if they investigated the effectiveness of specific interventions on
popula-tion dietary salt intake and contained quantitative outcomes. Only studies in English were
included. We included a wide range of study designs including meta-analyses, trials,
observa-tional studies and natural experiments. Empirical studies and modelling studies were analysed
separately, in view of their profound differences. The retrieved studies were assessed using the
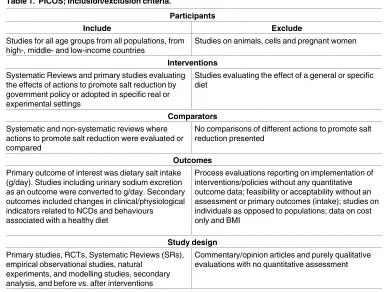
PICOS approach (Participants, Interventions, Comparators, Outcomes and Study design),
summarised in
Table 1
. The primary outcome was salt intake (g/day). Studies reporting
uri-nary sodium excretion (mmol/day) or sodium mg/day were converted to g/day. Where
neces-sary, we simultaneously considered studies reporting solely on salt intake data in a specific
population with the corresponding studies describing the interventions during that same time
period.
One reviewer (LH) conducted the searches; extracted potential papers and removed
dupli-cates. Two reviewers (LH and AEG) then independently screened titles and abstracts for
eligi-bility using the inclusion and exclusion criteria. Full text was retrieved for all papers deemed
potentially eligible and these were also screened independently by the two reviewers. Any
dis-crepancies were resolved by consensus or by involving the senior author (SC).
Data extraction and management
[image:5.612.194.578.408.700.2]Pre-designed and pre-piloted tables were used to extract data from all included studies. To
ensure that all relevant information was captured, extracted data included: first author; year
of publication; funder(s); study aim(s); sample size; study design; methods; participants;
policies analysed; geographical scope; length of follow-up; outcomes, effect and response;
Table 1. PICOS; Inclusion/exclusion criteria.
Participants
Include Exclude
Studies for all age groups from all populations, from high-, middle- and low-income countries
Studies on animals, cells and pregnant women
Interventions Systematic Reviews and primary studies evaluating the effects of actions to promote salt reduction by government policy or adopted in specific real or experimental settings
Studies evaluating the effect of a general or specific diet
Comparators
Systematic and non-systematic reviews where actions to promote salt reduction were evaluated or compared
No comparisons of different actions to promote salt reduction presented
Outcomes
Primary outcome of interest was dietary salt intake (g/day). Studies including urinary sodium excretion as an outcome were converted to g/day. Secondary outcomes included changes in clinical/physiological indicators related to NCDs and behaviours associated with a healthy diet
Process evaluations reporting on implementation of interventions/policies without any quantitative outcome data; feasibility or acceptability without an assessment or primary outcomes (intake); studies on individuals as opposed to populations; data on cost only and BMI
Study design
Primary studies, RCTs, Systematic Reviews (SRs), empirical observational studies, natural
experiments, and modelling studies, secondary analysis, and before vs. after interventions
Commentary/opinion articles and purely qualitative evaluations with no quantitative assessment
authors’ assessment of limitations and our own assessment of potential risk of bias. The
sources referenced for the effect sizes used in each modelling study were also specified in
the tables (recognising that some modelling studies are based on empirical studies,
poten-tially some included in this review). This data extraction was done independently by two
reviewers (LH and AEG).
Quality assessment of included studies
Two reviewers (LH and AEG) independently assessed the methodological quality of each
study (poor, fair or good). We used the National Heart, Lung and Blood Institute (NHLBI)
tools specific for each research design (i.e. RCTs, cross-sectional studies, before and after
stud-ies, and systematic reviews).[
42
] Several questions were asked for each study design (varying
from 8 to 14) and depending on the points scored, the studies were labelled as good, fair or
poor. However, we also took into consideration as to which questions points were allocated.
For example, if an RCT scored 10 out of 14 points, but did not conduct an intention to treat
analysis, it would be rated as fair rather than good. Modelling studies were independently
assessed by two modelling experts (MOF & CK) using a different tool adapted from Fattore
et al. (2014).[
43
] Discrepancies in quality assessment were reconciled by consensus or by
involving a third, senior member of the team (SC or HB).
Data synthesis and effectiveness hierarchy continuum
The evidence was summarised as a narrative synthesis according to intervention type, ranging
from downstream to upstream interventions, to facilitate comparisons between the
interven-tions. Summary tables of the studies included in this review can be found in Tables
2
–
10
for
empirical studies and
Table 11
for modelling studies. A more detailed data extraction of these
studies can be found in
S2 Table
. We defined UPSTREAM interventions as those targeting the
entire population (not a subset, however large) and creating structural changes (effectively
removing individual choice from the equation). This accorded with the Nuffield’s ladder
tax-onomy,[
44
] and with McLaren’s structural/agentic continuum.[
21
] Conversely, we defined
DOWNSTREAM interventions as those where the principal mechanism of action is “agentic”,
being dependent on an individual altering their behaviour.
Interventions were then categorised according to their position in the McLaren et al. (2010)
continuum from “upstream” to “downstream” (
Fig 1
).[
21
]
Multi-component interventions were considered separately.
Patient involvement
Individual patients were not involved in this research; this is a secondary analysis of published
data.
Results
Table 2. Dietary counselling (individuals).
Study Study type Geographical
scope
Aim and main outcomes Policies
analysed
Relevant results Quality
assessment
Hooper et al. (2002)45
SR and meta-analysis of RCTs
US, Australia, New Zealand, UK
Aim: to assess the long term effects of advice to restrict dietary sodium in adults with and without hypertension. Outcomes: salt intake as measured by urinary sodium excretion
Dietary advice Meta-analysis (11 studies included). They found reductions in salt intake at both intermediate, <12 months (2.8g/day) and late follow up, 13–60 months (2.0g/ day).
Good
Appel et al. (2003)46
Randomised trial
US Aim: to determine the effect on
BP of 2 multicomponent, behavioral interventions Outcomes: salt intake as measured by urinary sodium excretion
Dietary advice Only the reduction in the established group differed significantly from that of advice only group. 24-hour dietary recall data indicated both behavioral interventions significantly reduced sodium intake in comparison with advice only group (P
value = 0.01). Advice group
• Baseline = 10.0g/day • 6 months = 8.8g/day • Mean difference = -1.2g/day Intervention group
• Established: mean difference = -1.82 g/day
• Established + DASH: mean difference = -1.83 g/day
Good
Brunner et al. (1997)47
Meta-analysis of RCTs
UK, US, Netherlands and Australia
Aim: to evaluate the
effectiveness of dietary advice in primary prevention of chronic disease. Outcomes: salt intake
Dietary advice Overall mean net reduction of 1.8g/day which is a 20% reduction in salt intake. The heterogeneity test was highly significant (P< .0005) for the 3- to 6-month trials, with a net reduction of 3.4 (95% CI = 45, 72) g/day. Summary effect of the two trials with SE was somewhat larger at 9–18 months than at 3–6 months.
Fair
Francis & Taylor (2009)48
Randomised control group study
US Aim: to implement a
health-healthy diet-education programme. Outcomes: salt intake
Dietary counselling
Intervention salt consumption decreased significantly (P0.020) from record 1 to record 3. The reduction in control group participants’ sodium intake was not significant
Intervention: (Mean±SEM (g/
day); P-value)
• Record 1: 7.0±0.5; 0.020e • Record 2: 5.9±0.3; 0.067 • Record 3: 5.9±0.4; 0.937
Control (Mean±SEM (g/day),
P-value)
• Record 1: 6.2±0.5; 0.323 • Record 2: 6.1±0.4; 0.880 • Record 3: 5.7±0.4; 0.284 Mean effect size:- 0.6g/day
Fair
Parekh et al. (2012)49
RCT Australia Aim: to evaluate the
effectiveness of a minimal intervention on multiple lifestyle factors including diet using computer tailored feedback. Outcomes: salt intake (%)
Health promotion– computer tailored advice
Salt (%) Intervention +5.43 net change. Control +1.23 net change. Significant changes between groups were observed for reduced salt intake (OR 1.19, CI 1.05–1.38). The intervention group were 20% more likely to reduce salt intake
Fair
Dietary counselling–individual level (
Table 2
)
Nine empirical studies (two of good quality;[
45
–
46
] five of fair quality;[
47
–
51
] and two of
poor quality [
52
–
53
]), and three modelling studies (all of good quality [
54
–
56
]) investigated
the effect on salt intake of dietary counselling targeted at consenting individuals.
Two separate meta-analyses investigated the effect of dietary advice on salt intake. The first
included eleven randomised controlled trials (RCTs) and found a 1.8g/day salt reduction after
up to 18 months of dietary advice.[
47
] The second meta-analysis included eight RCTs and
Table 2. (Continued)
Study Study type Geographical
scope
Aim and main outcomes Policies
analysed
Relevant results Quality
assessment
Petersen et al. (2013)50
RCT Australia Aim: to investigate whether urinary sodium excretion can be reduced by educating people with T2DM to read food labels and choose low sodium products. Outcomes: salt intake
Nutrition education
Baseline reported salt intake: 6.8±3.2 g/day
Intervention
• Baseline: 10.0±0.7 • 3 months: 10.1±0.7 • Change: +0.06±0.9 Control
• Baseline: 9.6±0.9 • 3 months: 9.3±0.7 • Change: -0.3±0.8 There was no between group difference (p>0.05)
Fair
Kokanović et al. (2014)51
Before and after study
Croatia Aim: to assess eating habits of adolescent population diagnosed with one or more cardiovascular risks before and after two months of individual dietary intervention Outcomes: salt intake
Nutrition education
Difference in intake on initial and control examination statistically significant for intake of sodium p = 0.013. Salt intake g/day. Initial examination: 18.9d/day; Control examination: 15.4g/day; Difference: -3.5g/day (= -18.8%)
Fair
Heino et al. (2000)52
Prospective randomized trial
Finland Aim: to examine sodium intake of 1-5-y-old children in a CHD prevention trial, focused on dietary fat modification. Outcomes: salt intake
Dietary counselling
Intervention children (+1.5g/day) • 13 months: 4.1±1.2 • 3 years: 4.9±1.2 • 5 years: 5.6±1.3 Control children (+1.6g/day)
• 13 months: 3.9±1.4 • 3 years: 4.7±1.3 • 5 years: 5.5±1.4 No significant differences between the intervention and control group found
Poor
Wang et al. (2013)53
RCT US Aim: one year dietary intervention
study to examine patterns and amount of daily sodium intake among participants with metabolic syndrome Outcomes: salt intake
Dietary counselling
Intervention arm at one year follow-up found participants who consumed sodium greater than 5.8g/day declined from 75% at baseline to 59%. Those consumed higher than 3.8g/day declined from 96% (at baseline) to 85%. Average salt intake decreased from 7.5 g/day at baseline to 6.4 g/day at one-year (P<0.001). At one-year visit, salt intake was consistently reduced; significant difference only observed between males (7.6± 0.4 g/day) and females (6.0±0.2 g/day; p<0.001)
Poor
[image:8.612.37.576.91.575.2]Table 3. Dietary counselling (worksite/schools).
Study Study type Geographical
scope
Aim and main outcomes Policies
analysed
Relevant results Quality
assessment
He et al. (2015)40
Cluster RCT China Aim: to determine whether an education programme targeted at schoolchildren could lower salt intake in children and their families Outcomes: salt intake as measured by urinary excretion
Health education
At baseline, the mean salt intake in children was 7.3 (SE 0.3) g/day in the intervention group and 6.8 (SE 0.3) g/day in the control group. The mean effect on salt intake for intervention versus control group was−1.9 g/day (95% confidence interval−2.6 to−1.3 g/day; P<0.001). In adult family members the salt intakes were 12.6 (SE 0.4) and 11.3 (SE 0.4) g/day,
respectively. During the study there was a reduction in salt intake in the intervention group, whereas in the control group salt intake increased. The mean effect on salt intake for intervention versus control group was−2.9 g/day (−3.7 to−2.2 g/day; P<0.001)
Good
Cotter et al. (2013)57
School based RCT
Portugal Aim: to examine the influence on salt intake and blood pressure of three different educational interventions for 6 months Outcomes: salt intake as measured by urinary sodium excretion
Nutrition education
Baseline: mean salt intake of 7.8±2.5 g per day. Estimated salt intake (g/d):
CRT
• Baseline: 7.7±2.0 • Final: 7.4±3.0 • Change: 0.35±2.42 THEOR
• Baseline: 8.1±3.0 • Final: 7.5±3.0 • Change: 0.60±3.24 PRACT
• Baseline: 7.5±2.4 • Final: 6.4±2.2 • Change: 1.08±2.47*
Fair
Katz et al. (2011)58
School based RCT
US Aim: to evaluate the effects of a
nutrition education programme in distinguishing between healthful and less healthful choices in diverse food categories. Outcomes: salt intake
Nutrition education
There were no statistically significant improvements in dietary patterns from baseline between the
intervention (-0.23g/day) and control groups (-0.04g/day) for salt intake (p = .44)
Poor
Aldana et al. (2005)59
RCT US Aim: to determine behavioral and
clinical impact of a worksite chronic disease prevention program Outcomes: salt intake
Health education
Intervention group (salt g/day) • Baseline: 7.5
•Δ6 weeks: -0.5 •Δ6 months: -1.7 Control group (salt g/day)
• Baseline: 6.3 •Δ6 weeks: -0.5 •Δ6 months: -0.5
Significant differences in mean change scores were not observed at 6 weeks (P = 0.88) but they were seen at 6 months (P = 0.0097)
Fair
Chen et al. (2008)60
Intervention control trial
China Aim: to report the effects of these two programmes on blood pressure and changes in morbidity and mortality from CHD and stroke Outcomes: salt intake
Health education
Mean daily salt intake declined from 16.0 to 10.6 g d-1 in the intervention factory, compared with the control factory from 16.9 to 15.4 g d-1, with the net reduction of 3.9 g d-1, which was significantly different (P<0.05).
Fair
reported an overall reduction in salt consumption of 2.8g/day at 12 months and 2g/day up to
60 months.[
45
] The two meta-analyses overlapped in respect of only three studies.
One additional RCT found a statistically significant net reduction of 0.6g/day between the
groups,[
48
] whilst a second RCT found no effect between the control and intervention group.
[
50
]
All three modelling studies predicted that dietary advice is less effective in reducing the
dis-ease burden of high salt intake, only gaining 180–2,600 quality-adjusted life years (QALYs)
compared to other interventions (7,900–195,000 QALYs).[
54
–
56
]
Dietary counselling–school based and worksite interventions (
Table 3
)
Three school-based interventions (one of good quality;[
40
] one of fair quality;[
57
] one of poor
quality [
58
]) and three worksite-based studies (all of fair quality) were included.[
59
–
61
] No
modelling studies were identified for this section.
Schools. A nutrition programme in schools aimed at distinguishing between healthy and
less healthy choices reported a non-significant reduction.[
58
] In the second school based RCT,
the practical intervention group achieved a significant net reduction of 0.7g/day compared
with the control group.[
57
] In a cluster RCT in China, education and training significantly
reduced salt intake by a mean of
−
1.9 g/day in 279 school children (and
−
2.9 g/day in adult
family members).[
40
]
Worksites. A randomised trial of a chronic disease prevention programme achieved a net
reduction of 1.2g/day between the intervention and control group (P = 0.01).[
59
] A
factory-based intervention study in China assessed health education aimed at altering diet, together
with a high-risk strategy of hypertension control. Salt intake was reduced by 3.9g/day from a
mean of 16g/day (P
<
0.05).[
60
]
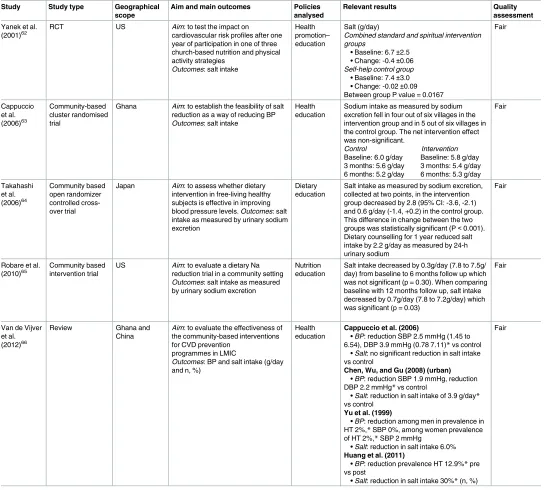
Dietary counselling–community level (
Table 4
)
Four empirical studies and one review, all of fair quality,[
62
–
66
] investigated community
based dietary counselling. One study reported a statistically significant difference of -0.4g/day
in salt intake between the intervention and control groups.[
62
] Two intervention trials of
nutrition education reported significant reductions of 0.7g/day and 2.2g/day reductions
Table 3. (Continued)
Study Study type Geographical
scope
Aim and main outcomes Policies
analysed
Relevant results Quality
assessment
Levin et al. (2009)61
Worksite based dietary intervention
US Aim: to examine whether a worksite
nutrition programme using a low-fat vegan diet could significantly improve nutritional intake Outcomes: salt intake
Dietary counselling
Intervention group participants significantly increased the reported intake and mean intake (P = 0.04) of salt compared to the control group. Salt (g/day)
Intervention group • Baseline: 4.1±0.1 • 22 weeks: 5.0±0.2 • Mean difference: 0.9±0.2 Control group
• Baseline: 4.5±0.2 • 22 weeks: 4.9±0.2 • Mean difference: 0.4±0.2 Mean effect size: +0.5 (95% CI 9.2, 394.4; P = 0.04)
Fair
[image:10.612.38.578.91.259.2]respectively in salt intake after 12 months.[
63
–
64
] One RCT reported a favourable trend;
how-ever, this was non-significant and could have been caused by contamination between the
groups.[
63
]
Mass media campaigns (
Table 5
)
[image:11.612.35.579.88.578.2]One empirical study of fair quality [
67
] and five modelling studies; four of good quality[
56
,
68
–
70
] and one of fair quality[
71
] were included.
Table 4. Dietary counselling (community).
Study Study type Geographical scope
Aim and main outcomes Policies analysed
Relevant results Quality
assessment
Yanek et al. (2001)62
RCT US Aim: to test the impact on
cardiovascular risk profiles after one year of participation in one of three church-based nutrition and physical activity strategies
Outcomes: salt intake
Health promotion– education
Salt (g/day)
Combined standard and spiritual intervention groups
• Baseline: 6.7±2.5 • Change: -0.4±0.06
Self-help control group
• Baseline: 7.4±3.0 • Change: -0.02±0.09 Between group P value = 0.0167
Fair
Cappuccio et al. (2006)63
Community-based cluster randomised trial
Ghana Aim: to establish the feasibility of salt
reduction as a way of reducing BP
Outcomes: salt intake
Health education
Sodium intake as measured by sodium excretion fell in four out of six villages in the intervention group and in 5 out of six villages in the control group. The net intervention effect was non-significant.
Control Intervention
Baseline: 6.0 g/day Baseline: 5.8 g/day 3 months: 5.6 g/day 3 months: 5.4 g/day 6 months: 5.2 g/day 6 months: 5.3 g/day
Fair
Takahashi et al. (2006)64
Community based open randomizer controlled cross-over trial
Japan Aim: to assess whether dietary
intervention in free-living healthy subjects is effective in improving blood pressure levels. Outcomes: salt intake as measured by urinary sodium excretion
Dietary education
Salt intake as measured by sodium excretion, collected at two points, in the intervention group decreased by 2.8 (95% CI: -3.6, -2.1) and 0.6 g/day (-1.4, +0.2) in the control group. This difference in change between the two groups was statistically significant (P<0.001). Dietary counselling for 1 year reduced salt intake by 2.2 g/day as measured by 24-h urinary sodium
Fair
Robare et al. (2010)65
Community based intervention trial
US Aim: to evaluate a dietary Na
reduction trial in a community setting
Outcomes: salt intake as measured
by urinary sodium excretion
Nutrition education
Salt intake decreased by 0.3g/day (7.8 to 7.5g/ day) from baseline to 6 months follow up which was not significant (p = 0.30). When comparing baseline with 12 months follow up, salt intake decreased by 0.7g/day (7.8 to 7.2g/day) which was significant (p = 0.03)
Fair
Van de Vijver et al. (2012)66
Review Ghana and China
Aim: to evaluate the effectiveness of
the community-based interventions for CVD prevention
programmes in LMIC
Outcomes: BP and salt intake (g/day
and n, %)
Health education
Cappuccio et al. (2006)
• BP: reduction SBP 2.5 mmHg (1.45 to 6.54), DBP 3.9 mmHg (0.78 7.11)*vs control
• Salt: no significant reduction in salt intake vs control
Chen, Wu, and Gu (2008) (urban)
• BP: reduction SBP 1.9 mmHg, reduction DBP 2.2 mmHg*vs control
• Salt: reduction in salt intake of 3.9 g/day*
vs control
Yu et al. (1999)
• BP: reduction among men in prevalence in HT 2%,*SBP 0%, among women prevalence of HT 2%,*SBP 2 mmHg
• Salt: reduction in salt intake 6.0%
Huang et al. (2011)
• BP: reduction prevalence HT 12.9%*pre vs post
• Salt: reduction in salt intake 30%*(n, %) Fair
The UK FSA salt reduction programme involved media campaigns to discourage table salt
use, plus sustained pressure on industry to reformulate. Although salt consumption declined
by 0.9g/day using spot urinary sodium readings from 2003–2007, the media contribution was
unclear but likely modest.[
67
]
The modelling studies likewise suggested media campaigns were generally considered less
effective than food labelling or reformulation.[
56
,
69
–
71
] The Change4Life campaign in the
UK was predicted to reduce salt intake by 0.16g/day, less than labelling or reformulation.[
68
]
Gillespie et al. (2015) similarly estimated that social marketing might modestly reduce salt
con-sumption by 0.03g/day to 0.13g/day.[
69
]
Nutrition labelling (
Table 6
)
Two empirical studies, both of poor quality, investigated the effect of nutrition labelling on salt
intake [
72
–
73
]. Reduced salt intake was not observed in participants who reported frequent vs.
non-frequent label use (7.7g/day vs. 7.6g/day).[
73
]
Ten modelling studies also examined labelling, four of good quality[
56
,
68
–
70
] and two of
fair quality.[
71
,
74
–
77
] These suggested that labelling might modestly reduce UK salt intake by
Table 5. Media campaigns.
Study Study
type
Geographical scope
Aim and main outcomes Policies analysed Relevant results Quality
assessment
Shankar et al. (2012)67
Cross-sectional
UK Aim: to examine the trend in salt
intake over a set period and deduce the effects of the policy on the intake of socio-demographic groups Outcomes: salt intake as measured by spot urinary sodium readings
Salt campaign (and potential effect on reformulation and table salt use)
The results are consistent with a previous hypothesis that the campaign reduced salt intakes by approximately 10%. The impact is shown to be stronger among women than among men. Salt as measured by spot urinary sodium readings
• 2003: 6.3 g/day • 2004: 6.4 g/day • 2005: 5.7 g/day • 2006: 5.6 g/day • 2007: 5.4 g/day
Difference in g/day between 2003– 2007 = 0.9 g/day = 13.5%
Fair
[image:12.612.36.586.541.695.2]https://doi.org/10.1371/journal.pone.0177535.t005
Table 6. Labelling.
Study Study type Geographical
scope
Aim and main outcomes Policies
analysed
Relevant results Quality
assessment
Babio et al. (2013)72
Randomised cross-over trial
Spain Aim: to compare two models of front-of-pack guideline daily amounts (GDA) and the ability to choose a diet that follows the nutritional
recommendations. Outcomes: salt intake based on choices
Labelling Participants using the multiple-traffic-light GDA system chose significantly less salt (0.4g/day; P <0.001) than those using the monochrome GDA labels
Poor
Elfassy et al. (2015)73
Cross-sectional
US Aim: to examine independent
association between hypertension and frequency use of NF label for sodium information and whether this was associated with differences in intake Outcomes: salt intake as measured by urinary sodium excretion
Labelling (use)
Daily sodium intake was not lower in those who reported frequent vs non-frequent use of the NF label for sodium information (7.7g/day vs 7.6g/day; P = 0.924)
Poor
0.03g/day to 0.16g/day [
68
,
69
]; much less than the 0.9g/day estimated by Roodenburg et al.
(2013).[
77
] Another study suggested that salt intake might be lowered by 1.2g/day if the
popu-lation were to choose products labelled as low-salt, or increased by 1.6g/day if they choose
products labelled as high salt content.[
74
]
Reformulation (
Table 7
)
Very few studies which focused on reformulation included quantified results of salt intake. In
one empirical Taiwanese study of fair quality,[
78
] salt was enriched with potassium in the
intervention group and their outcomes were an apparent reduction in cardiovascular deaths
by 41%, compared to the control group rather than salt intake. Furthermore, people in the
intervention group lived 0.3–0.9 years longer.[
78
]
[image:13.612.36.580.89.230.2]Fourteen modelling studies evaluated reformulation, eleven of good quality[
41
,
54
–
56
,
68
–
70
,
79
–
82
] and three of fair quality[
71
,
83
,
84
]. Mandatory reformulation could consistently
achieve bigger salt reductions than voluntary reformulation; 1.6g/day compared with 1.2g/day;
[
68
] and 1.4g/day versus 0.5g/day.[
69
] Mandatory reformulation might also achieve higher
reductions in disability-adjusted life years (DALYs) and QALYs compared to voluntary
refor-mulation.[
54
,
56
,
79
]
Table 7. Reformulation.
Study Study
type
Geographical scope
Aim and main outcomes Policies
analysed
Relevant results Quality
assessment
Chang et al. (2006)78
Cluster RCT
Taiwan Aim: to examine the effects of potassium-enriched salt on CVD mortality and medical expenditures in elderly veterans. Outcomes: incidence, CVD mortality, LYG
Reformulation– low sodium salt
The incidence of CVD-related deaths was 13.1 per 1000 persons (27 deaths in 2057 person-years) and 20.5 per 1000 (66 deaths in 3218 person years) for the experimental and control groups, respectively A significant reduction in CVD mortality (age-adjusted hazard ratio: 0.59; 95% CI: 0.37, 0.95) was observed in the experimental group. Persons in the experimental group lived 0.3– 0.90 y longer
Fair
https://doi.org/10.1371/journal.pone.0177535.t007
Table 8. Taxes.
Study Study type Geographical
scope
Aim and main outcomes Policies
analysed
Relevant results Quality
assessment
Thow et al. (2014)85
Systematic Review
US (with UK data)
Aim: to assess the effect of food taxes on consumption Outcomes: sodium consumption
Sodium tax A modelling study predicted that a sodium tax increasing the price of salty foods by 40% would reduce sodium consumption by 6%
Fair
Niebylski et al. (2015)86
SystematicReview France and US Aim: to evaluate the evidence base to assess the effect of unhealthy food taxation. Outcomes: energy intake
1) Tax on salty snacks 2) Tax on cheese/ butter
1) Modelling study of tax on chips/ salty snacks on energy intake in US. Predicted a 1% tax had no effect on consumption or body weight
2) Modelling study of effect of 1% VAT on cheese/butter, sugar, and fat products along with ready-made meals in France. Predicted proposed taxes reduced saturated fat, cholesterol, sodium, and energy intake but suggest 1% is insufficient to have positive health effect.
Fair
[image:13.612.39.579.515.697.2]Table 9. Multi-component interventions.
Study Study type Geographical
scope
Aim and main outcomes Policies analysed Relevant results Quality
assessment He et al.
(2014)88
Comprehensive analysis
UK Aim: to analyse the UK salt reduction
programme
Outcomes: salt intake as measured
by urinary sodium excretion
1) Reformulation 2) Labelling
3) Health promotion campaigns
15% decrease, there have been a steady fall in salt intake at a rate of ~2% per year since the introduction of the salt reduction strategy. The 0.9g/ day reduction in salt intake achieved by 2008 led to E 6000 fewer CVD deaths per year.
• 2000–2001: salt intake = 9.5g/day • 2005–2006: salt intake = 9.0g/day • 2008: salt intake = 8.6g/day • 2011: salt intake = 8.1g/day
Good
Mozaffarian et al. (2012)89
Systematic review
Finland and China
Aim: to systematically review and
grade the current scientific evidence for effective population approaches to improve dietary habits. Outcomes: salt intake as measured by urinary sodium excretion
1) Education
2) Combined effects of labelling, reformulation and campaigns
Tian et al. (1995)
1) Education: In the intervention neighborhoods,
mean sodium intake decreased by 1.3 and 0.6 mmol/day in men and women, respectively, compared with increases of 1.0 and 0.2 mmol/day, respectively, in the control neighborhoods (P0.001 for men, P0.065 for women)
Pekka et al. (2002) + Puska & Stahl (2010) 2) From the 1970s to the late 1990s, mean daily salt consumption in Finland declined from approximately 14.5 g in men (unknown in women) to approximately 11 g in men and 7 g in women; mean diastolic blood pressure declined by 5% in men and 13% in women
Good
Fattore et al. (2014)43
Systematic review
Australia, US and Vietname
Aim: to summarize and critically
assess economic evaluation studies conducted on direct (e.g., counseling) or indirect (e.g., food labeling) interventions aimed at promoting voluntary dietary improvements through reduction of fat intake
Outcomes: DALYs
1) Voluntary reformulation, mandatory reformulation and dietary advice
2) Reduction in daily caloric intake of 100 to 500 kcal below current estimated energy requirements 3) A set of personal (e.g., individual treatment of SBP>160 mmHg) and non-personal (e.g., a mass media campaign for reducing consumption of salt) prevention strategies to reduce CVD 4) Voluntary reformulation and sodium tax
1) Cobiac et al. (2010) 610,000 DALYs averted (95%CI: 480,000–740,000) if everyone reduced their salt intake to recommended limits. Dietary advice:
<0.5% disease burden (IHD & stroke cases) averted; Tick program:<1%; making Tick limits mandatory: 18%
2) Dall et al. (2009) 400 mg/d sodium intake reduction
3) Ha & Chisholm (2011) A health education program to reduce salt intake (VND 1,945,002 or USD 118 per DALY averted) & individual treatment of SBP>160 mmHg (VND 1,281,596 or USD 78 per DALY averted) are the most cost-effective measures 4) Smith-Spangler (2010) (1) vs. (2): 1.25-mm Hg vs. 0.93-mm Hg decrease in mean SBP; 513,885 vs. 327,892 strokes averted; 480,358 vs. 306,137 MIs averted; 1.3 million vs. 840,113 years LE increase. Collaboration with industry: 2.1 million QALYs gained; USD 32.1 billion medical cost savings. Tax on sodium: 1.3 million QALYs gained; USD 22.4 billion medical cost savings
Fair
He & MacGregor (2009)90
Review Japan, Finland
and UK
Aim: to provide an update on the
current experience of worldwide salt reduction programmes. Outcomes: salt intake, blood pressure, stroke & CHD mortality and life expectancy
1) Reformulation to reduce the salt content of all foods
2) Health promotion campaigns 3) Labelling to highlight salt content
Japan. The Japanese Government initiated a
campaign to reduce salt intake. Over the following decade salt intake was reduced from an average of 13.5 to 12.1 g/day. However, in the north of Japan salt intake fell from 18 to 14 g/day. Paralleling this reduction in salt intake, there was an 80% reduction in stroke mortality despite large increases in population fat intake, cigarette smoking, alcohol consumption and an increase in BMI.
Finland. Since the 1970s, Finland aimed to reduce
salt intake by reformulation and raising general awareness of the harmful effects of salt on health. This led to a significant reduction in salt intake of 3g/ day from 1979 to 2002 (12 to 9g/day) as measured by urinary sodium. This was accompanied by a fall of over 10mmHg in both systolic and diastolic BP, a pronounced decrease of 75–80% in both stroke and CHD mortality, and a remarkable increase of 5–6 years in life expectancy.
UK. Salt added to cooking or at the table:
estimated that 15% of the total 9.5g/day consumed was added (1.4g/day). Naturally present in food: approximately 5% (0.6g/day). Reformulation: 80% (7.5g/day) was added by the food industry. The UK salt reduction strategy started in 2003/2004 and the adult daily salt intake has already fallen, as measured by urinary sodium, from an average of 9.5 g/day to 8.6 g/day by May 2008
Fair
Pietinen et al. (2010)91
Before and after study
Finland Aim: to describe the main actions in
Finnish nutrition policy during the past decades. Outcomes: salt intake
1) Education
2) Voluntary reformulation 3) Labelling
1981; Eastern Finland: salt intake was about 13 g in men and 11 g in women. Salt intake has decreased continuously to a level of about 9 g in men and 7 g in women in 2007
Fair
Table 9. (Continued)
Study Study type Geographical
scope
Aim and main outcomes Policies analysed Relevant results Quality
assessment Wang et al.
(2011)92
Literature review US Aim: to summarize
cost-effectiveness evidence on selected interventions to reduce sodium intake that would be intended as population-wide approaches to control hypertension
Outcomes: stroke and MI averted
1) Reformulation 2) Sodium tax
Smith-Spangler et al. For US adults aged 40–85 years, collaboration with industry that decreased mean intake of sodium by 9.5% was estimated to avert 513 885 strokes and 480 358 myocardial infarctions over their lifetimes and to save US$ 32.1 billion in annual medical costs. Over the same period, a tax on sodium that decreased the population’s intake of sodium by 6% was projected to save US$ 22.4 billion in such costs
Fair
Webster et al. (2011)93
Review Finland, France, Japan and UK
Aim: to provide an overview of
national salt reduction initiatives around the world and describe core characteristic. Outcomes: salt intake, LYG, CHD and stroke mortality
1) Reformulation 2) Labelling
3) Health promotion campaigns
Finland: started salt reduction strategy in 1978
(reformulation, labelling and mass media campaigns) and by 2002 had demonstrated a 3 g reduction in average population salt intake (from 12 to 9 g/person per day). During the same period there was a corresponding 60% fall in CHD and stroke mortality
UK: the Food Standards Agency (FSA) started
working with the food industry in 2003 and launched its consumer education campaign in 2005. By 2008 the UK had achieved an average 0.9 g/person per day reduction in daily salt consumption, which is predicted to be saving some 6000 lives a year.
France: the Food Safety Authority recommended a
reduction in population salt consumption in 2000 and has since reported a decline in intake provided by foods from 8.1 to 7.7 g/day in the overall adult population. Focus was on bread reformulation and nutrition campaigns
Japan: 60s started a salt campaign through a
sustained public education campaign. Over the following decade average salt intake was reduced from 13.5 to 12.1 g/day with a parallel fall in blood pressure in adults and children, and an 80% reduction in stroke mortality despite large adverse changes in a range of other cardiovascular risk factors.
Fair
Wang & Bowman (2013)94
Literature review US, UK Aim: to summarize recent economic
analyses of interventions to reduce sodium intake. Outcomes: SBP, hypertension, cardiovascular events
1) reducing the sodium content of all foods
2) reducing sodium content by labelling foods and by promoting, subsidizing, and providing low sodium food options 3) Legislation
US (1&2): If the sodium-reduction strategies were
implemented, adults in the county would reduce their intake of sodium by 233 mg per day, on average, in 2010. This would correspond to an average decrease of 0.71 mmHg in SBP among adults with hypertension, 388 fewer cases of uncontrolled hypertension, and a decrease per year of $629,724 in direct health care costs
UK (3): Legislation or other measures to reduce the
intake of salt by 3 g per person per day (in a population where the current mean intake was about 8.5 g per person per day) would reduce the mean population SBP by approximately 2.5 mmHg, prevent about 30,000 cardiovascular events and approximately 4,450 deaths, and produce discounted savings overall of approximately £347 million (about $684 million) over a decade, which would be equivalent to annual savings of approximately £40 million
Fair
He et al. (2014)95
Cross-sectional England Aim: to determine the relationship
between the reduction in salt intake that occurred in England, and BP, as well as mortality from stroke and IHD
Outcomes: salt intake as measured
by urinary sodium excretion
Combined 1) Reformulation
2) Health promotion campaigns 3) Labelling
From 2003 to 2011, salt intake decreased by 1.4 g/ day (15%, p<0.05 for the downward trend). From 2003 to 2011, stroke mortality decreased from 128/1 000 000 to 82/1 000 000 (36% reduction, p<0.001) and IHD mortality decreased from 423/1 000 000 to 272/1 000 000 (36% reduction, p<0.001).
• 2003: 9.5g/day • 2005/2006: 9.0g/day • 2008: 8.6g/day • 2011: 8.1g/day
Fair
Enkhtungalag et al. (2015)96
Before and after study
Mongolia Aim: to reduce salt intake of the
employees of three of the main food producing factories. Outcomes: salt intake as measured by 24h urine excretion
Education on salt consumption and provision of reduced salt foods
Salt intake reduced from 11.5g/day in 2011 to 8.7g/ day in 2013
Fair
[image:15.612.38.580.89.671.2]Table 9. (Continued)
Study Study type Geographical
scope
Aim and main outcomes Policies analysed Relevant results Quality
assessment Trieu et al.
(2015)24
Systematic review
75 countries Aim: to quantify progress with the
initiation of salt reduction strategies around the world in the context of the global target to reduce population salt intake by 30% by 2025. Outcomes:
salt (g/day)
Labelling, mass media campaigns, education, reformulation
Denmark: from 2006 to 2010 salt intake reduced
from 10.7 to 9.9g/day in men and 7.5g to 7.0g/day in women (7%)
Japan: salt intake reduced from 13.5in 1997 to
10.4g/day in 2012 (23%)
Korea: salt intake reduced from 13.4g in 2005 to
11.6g/day in 2012 (13.6%)
Slovenia: salt intake reduced from 12.4g in 2007 to
11.3g/day in 2012 (8.9%) Du et al. (2014)
China: salt intake reduced from 16.8g in 1999 to 12g/
day in 2009 (28%)
Pietinen et al. (2010) & Laatikanen et al. (2006)
Finland: from 1979 to 2007 salt intake reduced from
13g to 8.3g/day in men and 11g to 7.0g/day in women (36%)
European commission (2008)
France: salt intake reduced from 8.1g in 1999 to
7.7g/day in 2007(4.9%) WHO (2013)
Iceland: salt intake reduced from 8.4g in 2002 to
7.9g/day in 2010 (6%) Walton (2013)
Ireland: salt intake reduced from 8.1g in 2001 to 7g/
day in 2011(13.6%)
National Food and Veterinary Risk Assessment Institute
Lithuania: salt intake reduced from 10.8g in 1997 to
8.8g/day in 2007(18.6%) WHO (2013)
Turkey: salt intake reduced from 18.0g in 2008 to
15g/day in 2012(16.7%) Sadler et al. (2011)
UK: Salt intake reduced from 9.5g in 2001 to 8.1g/
day in 2011(14.7%)
Fair
Luft et al. (1997)97
Review Finland and US Aim: to discuss the approaches used
in a community-wide salt-reduction project. Outcomes: salt intake as measured by urinary excretion
1) Nutrition education 2) Reformulation
Pietinen et al. (1984)—Health education &
reformulation. After 3 y salt intake had not changed
significantly. Hypertensive subjects
Men Women
1979: 13.8±5.3 1979: 10.4±4.7 1982: 13.7±5.5 1982: 10.0±4.1 Normotensive subjects
Men Women
1979: 12.4±4.8 1979: 9.8±3.8 1982: 12.2±4.8 1982: 9.1±3.6
Lang et al. (1985)—Dietary counselling. Women reduced their salt intake from 7.5±0.4 to 3.6±0.2 g/ day and men reduced their salt intake from 10.3±0.8 to 4.7±0.3 g/day.
Wassertheil-Smoller et a. (1992)–Education. Salt intake as measured by urinary sodium excretion was reduced from 7.9 to 1 6.4 g/day. Analysis of 3-d food records indicated that sodium intake decreased from 8.1 to 4.9 g/day.
Hypertension prevention collaborative research group (1992)—Nutrition education. Salt intake as measured by urinary sodium excretion
Intervention Control
Baseline: 8.9±3.4 Baseline: 9.0±3.5 Change: -3.2±4.4 Change: -0.6±4.4
Poor
Mohan et al. (2009)98
Review UK Aim: to review the evidence related to
dietary sodium and health in the context of the Ottawa Charter for health promotion. Outcomes: salt intake, stroke, CVD & coronary artery mortality
1) Reformulation 2) Labelling
3) Health promotion campaign
UK: Consumer-friendly labelling indicating sodium
content in processed foods by use of a colour system implemented in several UK food chains. Together with other efforts population salt intake decreased from 9.5g/day in 2004 to 8.6g/day in 2008
Poor
[image:16.612.39.579.92.630.2]In the Netherlands, reformulation of processed foods was predicted to reduce median salt
intake by 2.3g/day,[
84
] compared with a 0.9g/day from a two-year salt reformulation initiative
in Argentina.[
82
]
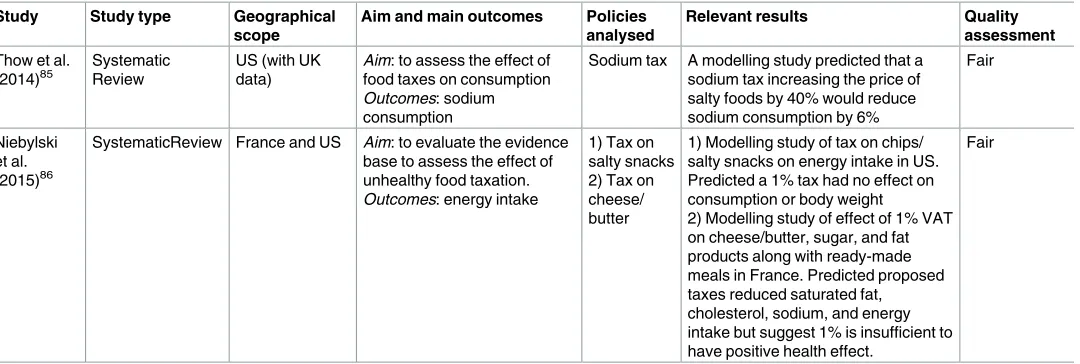
Fiscal interventions (
Table 8
)
Two systematic reviews of fair quality [
85
,
86
] included three modelling studies eligible for this
review. Furthermore, three additional tax modelling studies were included, all of good quality.
[
56
,
81
,
87
] Two studies included in Niebylski et al’s. systematic review (2015) modelled a 1%
tax on salty snacks or on cheese and butter; neither reduced salt consumption.[
86
] Another
modelling study suggested that a very high (40%) tax might achieve a 6% reduction in salt
con-sumption (0.6g/day).[
81
]
One modelling study predicted that a 20% tax on major dietary sodium sources might
pre-vent or postpone 2000 deaths annually,[
87
] whilst Nghiem et al. (2015) predicted that a
sodium tax might gain more QALYs than other interventions.[
56
]
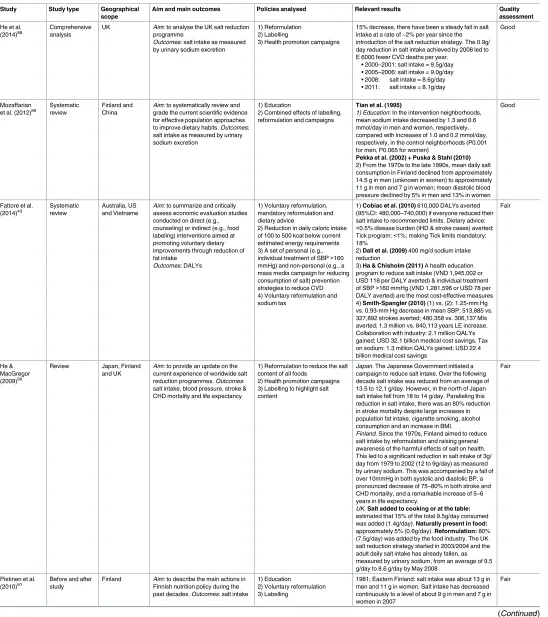
Multi-component interventions (
Table 9
and
Table 10
)
Fifteen papers were included under multi-component interventions. Most studies came from
Japan, Finland and the UK. Two were of good quality;[
88
,
89
] ten of fair quality;[
24
,
43
,
89
–
96
] and four of poor quality.[
97
–
100
]
Four studies were included which presented dietary salt intake and linked to papers
describing the interventions; (one of good quality;[
25
]; two of fair quality;[
101
,
102
] and one
of poor quality.[
103
]
Japan. The Japanese government initiated a sustained campaign in the 1960s.[
26
] Over
the following decade, mean salt intake fell from 13.5g/day to 12.1g/day overall (and from 18g/
day to 14g/day in Northern Japan). Miura et al. (2000) reported that salt intake subsequently
decreased from 14.5g/day in 1972 to 10.6g/day in 2010, a fall of almost 4g/day [
103
]. Stroke
mortality was predicted to fall by 80%.[
90
,
93
]
Finland. Starting in 1978, Finland pursued a comprehensive salt reduction strategy using
mass media campaigns, mandatory labelling and voluntary reformulation by the food
indus-try. Population salt consumption was monitored regularly by using 24h urinary assessment
and dietary survey data.[
72
] By 2007, salt intake had reduced by approximately 4g/day, from
Table 9. (Continued)
Study Study type Geographical
scope
Aim and main outcomes Policies analysed Relevant results Quality
assessment He &
MacGregor et al. (2010)99
Comprehensive review
Japan, Finland and UK
Aim: to provide an update on the
current salt reduction programmes that have been successfully carried out
Outcomes: salt intake
1) Reformulation 2) Labelling
3) Health promotion campaigns
Japan: over a decade national salt intake fell from
13.5g/day to 12.1g/day. In the North, salt intake was reduced from 18 to 14g/day. There was also an 80% reduction in stroke mortality despite large increases in fat intake, cigarette smoking, alcohol consumption, and obesity
Finland: reformulation, labelling and campaigns led
to a significant reduction in salt from 12g/day in 1979 to 9g/day in 2002
UK: salt reduction strategy started in 2003/2004 and
salt intake has already fallen from 9.5 to 8.6 g/d by May 2008
Poor
Wyness et al. (2012)100
Literature review UK Aim: to describe the UK Food
Standards Agency’s (FSA) salt reduction programme undertaken between 2003 and 2010 and to discuss its effectiveness
Outcomes: salt intake
1) Health promotion campaigns 2) Voluntary reformulation 3) Labelling
• 2000–2001: salt intake = 9.5g/day • 2005–2006: salt intake = 9.0g/day • 2008: : salt intake = 8.6g/day
Poor
[image:17.612.39.578.90.251.2]13 to 8.3g/day in men, and from 11 to 7g/day in women.[
24
,
25
] Stroke and coronary heart
dis-ease (CHD) mortality fell by over 75% during that period.[
90
]
United Kingdom. The UK salt reduction strategy included voluntary reformulation, a
[image:18.612.36.581.87.556.2]consumer awareness campaign, food labelling, target settings and population monitoring.[
95
]
By 2011, population salt intake, measured by 24h urinary sodium excretion, had decreased by
1.4g/day (9.5g/day to 8.1g/day)[
88
]. He et al. (2014b) estimated that this might reduce stroke
and coronary heart disease mortality by some 36%.[
88
]
Table 10. Salt intake outcomes with interventions detailed in other publications.
Study Study type Geographical
scope
Aim and main outcomes Policies
analysed
Relevant results Quality
assessment
Laatikainen et al. (2006)25
Cross-sectional population surveys
Finland Aim: to present trends in urinary sodium and potassium excretion from 1979 to 2002
Outcomes: salt intake as measured by urinary sodium excretion
1)
Reformulation 2) Mass media campaigns 3) Labelling
Between 1979 and 2002 salt intake as measured by sodium excretion decreased from over 12.7g/day to less than 9.8g/day among men and from nearly 10.4 to less than 7.5g/day among women. In 1979 the most educated North Karelian men had lower salt intake compared to the least educated being 11.4 g in the highest education tertile and 13.1 g in the lowest tertile.
Respectively, in 2002, the salt intake in southwestern Finland among women in the highest education tertile was 6.7g compared to 8.1g in the lowest tertile
Good
Otsuka et al. (2011)101
Longitudinal study
Japan Aim: to describe salt intake over 8 years according to age groups. Also to examine whether salt intake changes over time in middle-aged and elderly Japanese subjects Outcomes: salt intake
In stratified analyses by age, mean salt intake in men decreased 0.08 g/year among 40- to 49-year-olds, 0.09 g/year among 50- to 59-year-olds, 0.16 g/year among 60- to 69-year-olds, and 0.14 g/year among 70-to 79-year-olds. For women, mean salt intake decreased 0.08 g/year among 70- to 79-year-olds (P0.098).
Fair
Du et al. (2014)102
Ongoing open cohort study
China Aim: to analyse the patterns and trends of dietary sodium intake, potassium intake and the Na/K ratio and their relations with incident hypertension. Outcomes: salt intake as measured per 24h dietary recalls
Labelling & media campaign
Salt intake decreased from 16.5g/day in 1991 to 11.8g/day in 2009
Fair
Miura et al. (2000)103
Report Japan Aim: to present the status of salt consumption, salt-reducing measures/guidance methods in individual and population strategies to reduce salt intake Outcomes: salt intake
The National Health and Nutrition Survey in 2010 reported that the mean salt intake in adults was 10.6 g/day. There was an ~4 g decrease in comparison with that in 1972 (14.5 g), when salt intake was investigated for the first time in the National Nutrition Survey
Poor
Table 11. (Continued ) Study Study type Geographical scope Aim and main outcomes Policies analysed Relevant results Quality assessment Smith-Spangler et al. (2010) 81 Modelling study US Aim : to assess the cost-effectiveness of two population strategies to reduce sodium intake Outcomes : strokes and MIs averted, life years and QALYs gained 1) Voluntary reformulation 2) Sodium tax Collaboration with the industry : a 9.5% reduction in sodium intake resulted in • Averted strokes = 513 885 s • Averted MIs = 480 358 • LYG = 1.3 million • QALYs = 2 million Sodium tax : would lead to a 6% decrease in sodium intake. • Averted Strokes = 327 892 • Averted MIs = 306 137 • LYG = 840 113 • QALYs = 1.3 million Good Konfino et al. (2013) 82 Modelling study Argentina Aim : to use Argentina-specific data to project impact of Argentina’s sodium reduction policies under two scenarios—the 2-year intervention currently being undertaken or a more persistent 10 year sodium reduction strategy. Outcomes : salt intake as measured by urinary sodium excretion, systolic blood pressure, deaths and cases averted, mortality Reformulation Scenario 1: current initiative (2 year intervention) • Projected to reduce mean salt consumption by 0.96 g/day in men and 0.79 g/day in
women •SBP
would reduce by 0.93 mmHg to 1.81 mmHg depending on population subgroup • 19.000 deaths, 6.000 CHD deaths and 2.000 stroke deaths, 13.000 MIs and 10.000 stroke cases averted • Overall mortality reduction of 0.6% in adults > 35 years, 1.5% in total MIs, 1% in total stroke cases in the next decade Scenario 2: current initiative maintained for 10 years • Projected to reduce mean salt consumption by 4.83 g/day in men and 3.98 g/day in
women •SBP
Other countries have implemented several strategies including labelling, media campaigns
and voluntary reformulation and effect sizes ranged from -0.4g/day in France [
24
,
93
] to -4.8g/
day in China [
24
,
102
].
Modelling studies of combined interventions. Six modelling studies investigated the
effect of multi-component interventions, three were of good quality;[
70
,
104
,
105
] whilst three
others were of fair quality.[
70
,
106
,
107
]
Several modelling studies consistently suggested that multi-component salt reduction
strat-egies (e.g. labelling, health promotion and reformulation) would be more effective than any
single intervention.[
70
,
71
] For instance, Gase et al. (2011) suggested that using labelling,
pro-motion, subsidies and provision of low sodium options could lead to a 0.7–1.8g/day reduction.
[
106
]
Discussion
Main results
[image:23.612.164.574.75.365.2]This systematic review of salt reduction interventions suggests that comprehensive strategies
could generally achieve the biggest reductions in salt consumption across an entire population,
approximately 4g/day in Finland and Japan, 3g/day in Turkey and 1.3g/day recently in the
UK. Mandatory reformulation alone could achieve a reduction of approximately 1.4g/day,
fol-lowed by voluntary reformulation (median 0.7g/day) school interventions (0.7g/day) and
worksite interventions (+0.5g/day). Smaller population benefits were generally achieved by
short-term dietary advice (0.6g/day), community-based counselling (0.3g/day), nutrition
label-ling (0.4g/day), and health education media campaigns (-0.1g/day). Although dietary advice to
Fig 1. Interventions classified on the upstream / downstream continuum.
individuals achieved a -2g/day reduction, this required optimal research trial conditions
(smaller reductions might be anticipated in unselected individuals).
Comparison with other research
[image:24.612.74.573.70.578.2]Geoffrey Rose famously argued that a greater net benefit came from the population-wide
approach, (achieving a small effect in a large number of people) when compared with targeting
high risk individuals (a large effect but only achieved in a small number of people).[
32
]
Fig 2. PRISMA flowchart.