AND A MPERO METRIC
A
N A L Y S I S
Thesis by
Richard Pierson Buck
In Partial F;ulf illment of the Requirements for the Degree of
Master of Science
California Institute of Technology Pasadena, California
ACKNOWLEDGMENTS
A coulometric titration is described in which uni posi-tive thallium is oxidized to the triposiposi-tive state by electro-lytically generated bromine or chlorine. The end-point is determined amperometrically by measuring the current between two platinum electrodes with an impressed potential differ-ence of 200 millivolts. Confirmatory analyses have shovm an accuracy of 0.2% for
93
to 200 microgram samples, and of 0.1% for samples of from 200 to 1900 micrograms.The application of dual intermediates to secondary coulo-metric titrations with an amperocoulo-metric end point has been
studied. Cupric copper and bromide have been used for the
alternate electrolytic generation of bromine and cuprous copper for the purpose of titrating a substance exhibiting a slow rate of reaction with bromine. A procedure is described by which aniline has been titrated in quantities of from 13 to 280 micrograms with an average error without regard to sign of less than 0.4 micrograms.
A study has been
.
made of the bromine-bromide diffusion current, the effects of the concentrations of bromine, bromide and hydrogen ion; the minimum bromide ion concentration neces-sary to maintain generation of bromine with 100% current effi-ciency was determined.TABLE OF CONTENTS TITLE
I COULOMETHIC TITRATION OF THALLIUM WITH EITHER
BROMINE OR CHLORINE .AND AN AMPEROMETRIC END-POINT • 1 Exp er imen tal • •
. . .
. .
• • 1 Reagents. . .
. . .
.
• • • • • 2 ApparatusProcedure • •
• •
• •
. .
.
• •. . .
. . .
. . .
• 3.
. .
.
• • • • • 4 Discussion of the Method. . . .
.
• • • 6 Indicator Current Behavior •. .
• • 6 Titration of Tl (I) with Bromine andwith Chlorine • • • • • • • • • • • • • •
8
Comparison of the Coulometric Titration with other Methods • • • • • • • • • • • 9 References • • • • • • • • • • • • • • • • •15
II THE COULOMETRIC 'rITRATION OF ANILINE BY MEANS OFELECTROLYTICALLY GENERATED BROMINE • • • • • • •
16
Experimental • •Chemicals • • •
. . .
. .
. . .
• • • • • • • • • • • • Apparatus • • • •. . . •
• •18
18
20Preliminary Adjustments • • •
. . .
• • ' .20 Procedure • • • • • • • • • • •. .
• • Discussion of the Method • • • •. . . .
The Bromine-aniline Reaction • • • • • The Required Excess of Bromine • • • • Titration in Acetic Acid-acetate
Solutions • • • • • • •
. . . •
•. . .
Confirmatory Titrations •. . .
Acknowledgment.
. . .
. .
References • • • • • •. . .
. . .
PART TITLE PAGE III STUDIES O:f THE BROhTINE~CONTROLLED DIFFUSION
CUR..1=\ENT • • • • • • • • • • • • • • • • • -• • • • •
3 3
Experimental • • •. .
.
. .
.
.
• • • 34 Chemicals.
. . .
• 34 Apparatus •. . .
.
. . .
• • 34 Preliminary Adjustments • •Discussion • • • • • •
. . .
. .
• • • 35
. • 38. .
.
Effect of Bromide Concentration on Coulo-metric Titrations with Bromine • • • • •
38
Effect of pH on the Indicator Current •• 40 The Bromine-bromide Diffusion Current • • 41 References • • • • • • •
. . .
.
. . .
. 45
IV STUDIES OF HYDROGEN ION-CONTROLLED DIFFUSIONCURRENTS BE'rWEEN PLATINIZED-PLATH.fUI\11 ELECTRODES • • 46 Experimental •
. .
. . .
• 48 Chemicals. .
.
. . .
.
. . .
• • • 48 Apparatus • •. .
.
. .
• • • 48 The Electrode Systems •. . .
.
Indicator Current Phenomena • •
. . .
. • 51
• •
5
2
Effect of Applied Indicator Potential • •
58
Effect of Oxygen • • • • •. . .
• • 62 Effect of Bright Platinum Electrodes ••6
3
Titration Procedure •
. .
. . .
•• 64 Coulometric Titration of Hydrochloric·Acid . . . .. . .
. . . .
.
• 66PART I
COULO:METRIC TITRATION OF THALLIUM WITH EITHER
BROMINE OR CHLORINE AND AN AMPEROMETRIC END POINT
Coulometric titrations by means of electrolytically
gen-erated bromine have been described by Ernest H. Swift and
co-workers< 2 , 5,6,ll). This method involves passing a known
constant current for a measured time between two platinum
electrodes immersed in a solution containing a soluble
bro-mide and the substance to be determined. The reducing
sub-stances studied, thiodiglycol, tripositive arsenic,
tri-positive antimony and iodide are oxidized by the bromine and
the end point is determined by observing the current flow
between a second pair of platinum electrodes (the indicator
electrodes), which have a small potential difference impressed
across them.
Neither thiodiglycol nor tripositive arsenic or
anti-mony and their oxidized forms set up reversible half cells
at the generator or the indicator electrodes under the
condi-tions of the titration. No indicator current flows between
the indicator electrodes until the titration end point has
been reached and bromine is generated in excess. However,
the iodide-iodine and thallous-thallic half-cells are
revers-ible at the platinum electrodes. An indicator current flows
throughout the titration reaching a maximum near to the time
when iodide and iodine or Tl(I) and Tl(III) are in equal
concentrations. By shielding the generator cathode, it was
possible to apply the secondary coulometric method to
-2-f or the determination o-2-f small quantities o-2-f thallium has been developed.
Reagents
Sodium bromide solutions, 1.0 VF (volume formal), were prepared from the reagent grade salt.
Sixty percent reagent grade perchloric acid was used. Eight formal hydrochloric acid solutions were prepared from the reagent grade concentrated acid.
Freshly boiled distilled water was ·used in all solutions. Electrolytic oxidation of blank solutions described
below indicated reducing impurities in the hydrochloric acid solution. The effect was removed by boiling the acid with the calculated amount of
3
%
hydrogen peroxide.Five grams of pure thallium metal were dissolved in hot concentrated nitric acid and evaporated nearly to dryness.
iodate using an iodine monochloride end point according to the method of Swift and Garner(lO).
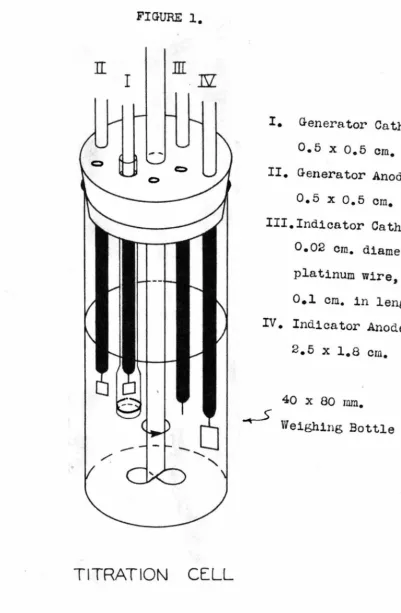
Apparatus
The apparatus used was that described by r-Jfeier, Myers and Swift(5) with the substitution of a simple voltage-regu-lated rectifier connected to the alternating current line through a voltage-regulating Sola transformer in place of the direct current supply. The generator cathode was con-tained within a glass shield open at the top and terminating at the bottom in a "fine" porosity sintered glass disc and filled above the level of the surrounding solution with 2 VF perchloric acid. Shielding the cathode from the body of the solution eliminated the danger of reduction of the thallium salts, and indicator currents caused by the presence of hydrogen gas in the titrated solution were avoided.
The linear dimensions of the indicator electrodes were approximately· 1. 5 by 1. 5 cm. and 2.7 by 2.3 cm., the larger being the cathode. A potential difference of 200 millivolts was impressed across the indicator electrodes when titrating with bromine and 300 millivolts when titrating with chlorine. Experiments have indicated that these values lay in the range
in which the diffusion current was nearly independent of fluctuations in the applied potential.
-4-The titration instrument provided three rates of gener-ation although only two were used in this work. The high rate corresponded to about 10 x lo-8 equivalents per second and the low rate about 1 x 10⁻⁸ equivalents per second. The generator circuit was calibrated by measuring with a student potentiometer the potential drop across a standard 199.8 ohm coil from a resistance box. The standard cell was occasion-ally checked against a Weston cell calibrated by the U.S. Bureau of Standards.
Procedure
The oxidizing or reducing impurities in the reagents were determined by titrating blank solutions. For each bro-mide blank, five milliliters of 1 VF sodium bromide, five milliliters of 60% (9VF) perchloric acid and thirty milli-liters of water were placed in a titration cell. In the
of the generator time intercept was designated as the blank time. Several blanks were run and the average value used for the impurity correction.
Titration of thallium was made as follows: Twenty five milliliters of a standardized thallous perchlorate solution were pipetted into a titration cell. To this were added five milliliters of 1 VF sodium bromide, five milliliters of 9 VF perchloric acid and five milliliters of water. In the case of titration with chlorine, five milliliters of
8
VF hydrochloric acid and ten milliliters of water wereadded. The generator current was adjusted and the titration was begun. When the approximate time for the titration was known, the generation was continued to within a few seconds of the end point. The generation was then continued in short intervals and the indicator current noted at each pause. A plot of the indicator current vs. generation time was constructed from the data and the linear portion of
this plot was extrapolated to zero indicator current. The intercept was designated as the titration time. The blank time was subtracted from the titration time to give the cor-rected titration time. The corresponding weight of thallium was calculated from the values of the corrected titration time and the rate of generation.
-6-and the electrodes were rinsed with water. The electrodes were stored in 1 VF hydrochloric acid when they were not in use.
Discussion of the Method
Indicator Current Behavior - A plot of the indicator current against time of generation when titrating thallium(I) in either perchloric acid-sodium bromide or hydrochloric acid
solutions shows a small residual indicator current before gen-eration is begun, a current increase to a flat maximllil'L,. a minimum at the equivalence point for the oxidation of Tl (I) to Tl (III) and finally a current increase. When the cator potential is applied there is an initial surge of
indi-cator current (to nearly 40 microamperes). The current then drops off to a small residual value of one to three micro-amperes. When titrating in the perchloric acid-sodium bromide solution, there may be an initial indicator current of as
much as five r: icroamperes if the sample was acidified several minutes before titrating. It is believed that this current is due to bromine formed by air oxidation of the bromide in
acid solution. The samples were ordinarily not acidified until immediately before they were to be titrated.
The initial rise, the flat maximum and the decrease of the indicator current observed prior to the time calculated
for the complete oxidation of the thallium ar.eattributed to the reversibility of the thallous-thallic half-cell at the
indicator electrodes. Presumably the current is controlled
0
o-o-o
0,.,...-0 /
0<.O
0/
V>/
00
z
0
"'1"
0
I
u
0 UJ
I
0 V>0 (\J
-
HI
-
r-f 0 E-4\..t
I
0 0
~ 0 0
0
I
...
+:»
d 0
h
I
... E-4 0 0•
I
co
r-f
w
~
0 ~g
I
I-H 0
f"z4 0
\
<.OQ
z
0
\
~
0 0
..q-
w
a::
\
z
w
0
lJ
"'-o
0~o
(\J0
0
0U)
-8-to the indica-8-tor cathode, and by diffusion of Tl (I) -8-to the indicator anode during the linear current decrease before the equivalence point. The broad maximum occurs near to the calculated time for equal concentrations of Tl (I) and Tl (III). However, the point of maximum indicator current would not be expected to occur precisely at the time cor-responding to equal concentrations unless the diffusion co-efficients for both the thallous and the thallic species were the same and the indicator electrodes were the-~ame
size.
In the vicinity of the equivalence point, the concentra-tions of Tl (I) and bromine are very small, after the equi-valence point, the bromine concentration increases and its diffusion to the indicator cathode determines the magnitude of the indicator current.
Titration of Tl (I) with Bromine and with Chlorine
The standard potential of the thallous-thallic couple( 4 ),
E0 : -1.25 volts
of the halides is possible. The formal potential calculated in bromide solutions from the data of Benoit(l) on the
dis-sociation constants of the thallic bromide complexes is slight-ly more positive than that given above for chloride solutions. In the procedure described here, there is apparently no ad-vantage in titrating with chlorine rather than bromine.
Table I.shows the data obtained from confirmatory titra-tions which.were carried out as described above. In solutions two formal in acid containing bromide or chloride, Tl (I) can be titrated in quantities ranging from
93
micrograms to 200 micrograms with a maximum deviation from the mean of about!
o.8
micrograms. Samples as small as93
micrograms can be determined with an accuracy of 0.2%. For quantities from 200 micrograms to 1900 micrograms, the determination is accurate to 0.1%.It is thought that the factors limiting the accuracy of these titrations are the preparation and dilution of the standard solutions, the determination of the end point and the preparation of pure intermediate reagents. The accuracy with which the generator current could be determined was about 0.03%.
Comparison of the Coulometric Titration with other Methods
-10-treated initially with bromine to insure complete oxidation
of the thallium to Tl (III) and the excess brDmine removed
with phenol.
Samples as small as 40 micrograms were determined with
an accuracy of 2.5%. Sampaes of from 1000 to 5000 micrograms
were determined with an accuracy of 0.2 to 0.3% if the
solu-tions were treated in the dark; in daylight the errors were
larger.
In a similar method, proposed by P.A. Shaw<8), the
iodine formed by the reaction of Tl (III) and iodide was
ex-tracted with carbon disulfide and determined colorimetrically.
The smallest samples studied were 500 micrograms and these
TABLE I
Confirmatory Titrations Titration With Bromine
Thallium, micrograms
Taken Found Error Percent Error
1873.7a 1875.9 • 2.2 • 0.12
1875.3 • 1.6 • 0.09
1871.6 - 2.1 - 0.11
1873.2 - 0.5 - 0.03
1873.7 o.o o.oo.
1874.9 • 1.2 • 0.06
Average 1874.l + 0.4 • 0.02
1555.la 1555.0 - 0.1 - 0.05
1555.7 • o.6 • 0.03
1555.0 - 0.1 - 0.05
Average 1555.2 • 0.1 o.oo
935 • 9a 935.2 - 0.7 - 0.07
936.1 • 0.2 • 0.02
93
8:
7
• 2.8 • 0.30935.~ - 0.7 - 0.07
936.9 • 1.0 + 0.11
935.6 - 0.3 - 0.03
935.2 - 0.7 - 0.07
-12-TABLE I (continued)
Confirmatory Titrations
Titration With Bromine
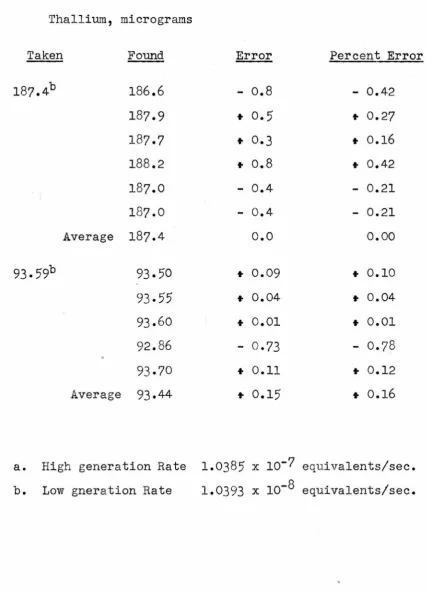
Thallium, micrograms
Taken Found Error Percent Error
187.4b
186.6
- o.8
- 0.42
187.9
+0.5
+0.27
187.7
+0.3
+0.16
188.2
+o.8
+0.42
187.0
- 0.4
- 0.21
1
8
7.0
-
0.4
- 0.21
Average
187.4
o.o
o.oo
93. 59b
93. 50
+0.09
+0.10
93.55
+0.04
+0.04
93.60
+0.01
+0.01
92.86
-
0
.73
- 0.78
93.70
+0.11
• 0.12
Average
93.44
• 0.15
+0.16
a. High generation Rate
1.0385
xlo-7
equivalents/sec. [image:18.540.36.464.127.719.2]TAB
LE II
Confir
m
atory
T
itrations
T
itrations
W
it
h
Chlorine
Th
alli
um
,
m
icro
g
ra
m
s
T
aken
Found
Error
Percent Error
1
8
73.7a
1
8
70.3
- 3.4
- 0.18
1870.5
- 3.2
- 0.17
1
8
76.4
+2.7
+0.14
1
8
72.6
- 1.1
- 0.06
187
8
.5
• 4.8
• 0.25
Avera
g
e 1
8
73.6
+0.1
o.oo
1
5
55.la
1559~7.
+1.6
+0.09
1
55
5.2
+0.1
o.oo
1
5
56 .2
+1.1
+0.06
1553. 0
- 2.1
- 0.11
A
vera
g
e 1555.3
+0.2
• 0.01
9
3
5
. 9a
930.8
- 5.1
- 0.55
9
3
6.1
• 0.2
+0.02
9
44.0
+8
.1
+o.
8
6
9
36
.3
+0.4
•
0
.04
93
5.9
o.o
o.oo
9
36.6
• 0.7
+o.or
-14-TABLE II (continued)
Confirmatory Titrations
Titrations With Chlorine
Thallium, micrograms
Taken Found Error Percent Error
1
8
7.4b
1
8
7.3
- 0.1
- 0.05
187.8
• 0.4
• 0.21
1
8
7.
5
.. 0.1
..
0.05
1
8
7.3
- 0.1
-
0.05
186.8
- o.6
- 0.32
187.1
- 0.3
- 0.16
Average
187.3
- 0.1
- 0.05
93. 59b
93.
92
• 0.33
.. 0.35
93
.
61
.. 0.
02
• 0.02
93.71
• 0.12
•
0
.13
93.
61
• 0.02
• 0.02
92.
8
7
-
0
.28
- 0.30
92.
87
- 0.28
- 0.30
Average
93.43
- 0.16
- 0.17
a. Hi gh Generation Rate
1.038
5
xlo-7
equivalents/sec.-8
I
1.
2.
4.
-6.
8.
9.
REFERENCES
Benoit, R., Bull. Soc. Chim., 518-524 (1949).
Brovm, R. A., and Swift, E. H., J. Am. Chem. Soc.,
21,
2717 (1949).Hughes, R.H., and Garner, C.
s.,
J. Am. Chem. Soc., 64, 1644 (1942).Latimer, W. M. , ''Oxidationatates of the Elements", p. 153, Prentice-Hall, New York, 1938.
Meier, D.
J.,
Tv1yers, R.J.,
and Swift, E. H., J. Am. Chem.Soc.,
.21,
2340 (1949).Myers1 R. J., and Swift, E. H., J. Am. Chem. Soc., 2Q,
1047 ll948).
Seasei J.
W.,
Niemann,c.,
and Swift, E. H., Anal. Chem.,1.2,
1':17 ( 1947).Shaw,
P.A.,
Ind. Eng. Chem., Anal. Ed.,2,
93 (1933).Sill,
c.
w.,
and Peterson, H.E.,
Anal. Chem., 21, 1268 (1949).10. Swift, E.
H.,
and Garner, C.s.,
J. Am. Chem. Soc., ,.2§, 113 (1936).11. Wooster,
W.
s.,
Farrington~ P. S., and Swift, E.H.,
PART II
THE COULOMETRIC TITRATION OF ANILINE BY MEANS OF ELECTROLYTIC.ALLY GENERATED BROMINE AND CUPROUS COPPER
THE COULOMETRIC TITRATION OF ANILINE BY NIEANS OF ELECTROLYTICALLY GENERATED BROMINE AND CUPROUS COPPER
AND AN AJVIPEROMETRIC END-POINT
Electrolytically generated hromine has been used as an intermediate oxidizing agent in secondary coulometric
pro-cesses by Sease, Niemann and Swift(l), Myers and Swift( 2 ), Brown and Swift(3) and Wooster, Farrington and Swift( 4 ). This process, combined with an amperometric end-point, has been used for the determination of reducing agents such as thiodiglycol, tripositive arsenic, tripositive antimony and iodide. Also, in an extension of these processes to the determination of oxidizing agents, electrolytically
gener-ated cuprous copper has been used as a reducing intermediate in a secondary coulometric titration of ·chromate and vana-date<5).
In these procedures, the substance to be determined
reacts with the electrolytically generated intermediate, ~
which is produced in the solution by the passage of a kno¥m
constant current for a measured time. The end-point is obtained by observing the current flow between two
plat-inum indicator electrodes which have a small potential
dif-ference impressed upon them.
The qualifications which the intermediate half~cell
must possess are discussed by Meier, Myers and Swift(5). Briefly, there must exist conditions such that the reactive
-17-and this active constituent must react rapidly and
stoichio-metrically with the substance to be determined. If the
amperometric end-point is to be used any excess of the active
species must cause a current between the two indicator
elec-trodes which is directly proportional to the concentration
of the excess agent.
In general, the substances which have been titrated have
reacted rapidly and stoichiometrically with the
electrolyti-cally generated intermediate -- at least , the reaction rate
has been more rapid under these conditions than the g
enera-tion rate. If the reacenera-tion between the electrolytically
generated constituent and the substance being titrated is
not as rapid as the generation rate, the indicator current
· will increase prematurely during the titration, making the
determination of the end-point difficult.
In the course of an investigation of the bromination of
organic compounds in aqueous solution, it was found that the
rate of substitution of bromine in certain aromatic compounds
was slow, and the end-point determination therefore difficult.
Inasmuch as the secondary coulometric process with an am
pero-metric end-point possesses certain advantages, further
invest-igation of its applicability to such titrations seemed
desir-able.
In conventional volumetric procedures, such titrations
are usually carried out by the addition of an 0,xcess of
In order to adapt such a bromometric titration to the
coulo-metric method, a means for the determination of the excess bromine must be found. Direct cathodic reduction of the
bromine is not possible; the concentration of excess bromine is too small for reduction with 100% current efficiency,
Since the cuprous-cupric copper couple has been found to
possess the qualifications for a coulometric intermediate, the use of cupric-copper and bromide as dual intermediates was investigated. The titration was carried out by gener~
ating an excess of bromine, permitting it to react for the
necessary time, then back titrating the excess with electro-lytically generated cuprous-copper.
This paper describes the use of these intermediates for the determination of aniline.
Experimental
Chemicals - All chemicals were reagent grade.
The stock aniline solution was prepared by dissolving
freshly distilled aniline in 0.02
VF
(volume formal) hydro-chloric acid. Air was removed by bubbling nitrogen through the solution to prevent oxidation and decomposition of the
aniline. This stock solution was standardized by a m odi-fication of the bromometric method as follows: Ten m illi-liter samples of the stock aniline solution were weighed
into five hundred milliliter conical flasks containing one hundred milliliters of boiled, distilled water, two grams
-19-hydrochloric acid. About twenty five milliliters of standard 0.02790 VF potassium bromate solution were weighed into the solution and allowed to react for about three ·minutes in the closed vessel; two grams of potassium iodide were added and the iodine titrated with standard sodium thiosulfate to a starch end-point. The standardization gave 1.416 x io- 4 equiv. of aniline per gram of solution with a mean deviation of 0.2 percent.
The potassium bromate solution was standardized iodo-metrically by weight titration against standard thiosulfate. The thiosulfate solution was standardized by weight titration against a standard potassium iodate solution.
Separate cupric copper and bromide solutions were pre-pared. 0.2 VF solution of copper sulfate in 12 VF hydro-chloric acid was prepared from twice recrystallized copper sulfate. Previously, the 12 VF hydrochloric acid had been found by electrolytic oxidation with bromine to contain approximately 1 x lo-6 equivalents of reducing material
.
ina ten milliliter sample; this effect was eliminated by the addition of the required amount of a saturated solution of chlorine in hydrochloric acid. One volume formal sodium bromide solutions were used. No extraneous oxidizing or reducing materials were found in these solutions.
Apparatus - The apparatus used was essentially the same as that described by Meier, Myers and Swift(5) with the modi-fications described by Ramsey, Farrington and Ewift(6).
Preliminary Adjustments - The current in the generator circuit was determined as described in Reference (5) and corresponded to 1.0375 x lo-7 equivalents per second. A potential of 200 mv. was impresse.d upon the indicator elec-trodes.
When the coulometric apparatus was not in use, the electrodes were shorted to the generator anode and stored in a solution approximately 2 VF in hydrochloric acid. Imme-diately before each set of titrations, the electrodes were placed in a solution 0.1 VF in sodium bromide and 1 VF hydrochloric acid contained in a titration cell (a 40 x 80 mm weighing bottle), and bromine was generated in the solution for thirty seconds at high rate. This -procedure aided in maintaining the stability of the electrode sensi-tivity; treatment with cleaning solution was only occasion-ally necessar'y-.
Procedure - In carrying out a titration, twenty-five
-21-When analyzing an unknown aniline solution, trial
titra-tions were made by generating bromine for a period of time,
stopping the generation and observing the change of the
indi-cator current with time. For titrations of greater than
100 seconds generation time, it was most convenient to
gener-ate bromine in the solution at the high rgener-ate (lo-7 eq./sec.)
until the indicator current was "off scale" with the
indi-cator current microam.meter shunted down to one-third of its
normal sensitivity. After stopping the generation, a pause
of about thirty seconds was often necessary before the
indi-cator current was again "on scale". In the determination of
smaller samples, generation of bromine in ten second
inter-vals, followed by a pause to observe the change of the
indi-cator current was found to be successful.
If the equivalence point for the formation of
tribromo-aniline had not been reached, the indicator current decreased
with time during this pause showing that the bromine was
still reacting with the aniline. However, as the equivalence
point ~as approached, the rate of decrease became slower. If
the equivalence point were passed, the indicator current did
not decrease noticeably during the thirty second wait.
When the approximate equivalence point was mown, the
indicator circuit was opened during the titration a~d g
ener-ation of bromine was continued until a twenty five second
excess was produced at the high generation rate. This
completion in one minute. Then the polarity of the
inter-nal generator electrode was reversed and cuprous copper was
generated until most of the excess bromine had been reduced
as demonstrated 'by the return of the indicator current to
the scale. The generation was continued in half second
intervals until the indicator current decreased to fifteen
microamperes. Between each period of generation a ten second
pause was taken while the indicator current reached a steady
value.
A plot of indicator current ~gainst time of generation
showed a rise in the current initially; followed by an "off
scal-e" period, then with generation of cuprous copper a
re-turn to "on scale", followed by a linear decrease in the
in-dicator current during the range of 40 to 10 microamperes.
A
correction for the impurities in the reagents.used and anypossible loss of bromine, was made by titrating ' six blank
solutions containing five milliliters of 0.2 VF copper
sul-fate in 12 VF hydrochloric acid, five milliliters of 1 VF
sodium bromide and thirty-five milliliters of water. The
generator current was set at the desired value and bromine
was generated for twenty-five seconds, the time of generation
of excess bromine in an aniline titration. The solution was
permitted to stand for one minute without stirring. The
polarity of the internal generator electrode was re~ersed
and cuprous copper was generated until an indicator current
of fifteen microamperes was obtained.
-23-between two times: the larger time was the period of bromine
generation and the shorter time was that time of coppet
gen-eration back to the arbitrary value fifteen microamperes.
The average "correction time" was determined from the last
four blanks which were usually the most consistent.
The time of cuprous copper generation back to an
indi-cator current of fifteen microamperes for the aniline
titra-tion and the "correctitra-tion time" were subtracted from the total
time of bromine generation to obtain the corrected titration
time. The corresponding weights of aniline were calculated
from the titration time and the rate of generation.
If the generation of cuprous copper was continued beyond
the time corresponding to an indicator current of fifteen
microamperes, the indicator current passes through a broad
minimum, and again increased as cuprous copper was generated
in excess. The arbitrary value of fifteen microamperes on the
linear portion of the curve was chosen as the end-point for
both the titration and the blank rather than the time
corres-ponding to the minimum.
'rhis end-point was found to be stable and reproducable.
By controlling the polarity of the internal generator
elec-trode, one could generate bromine or cuprous copper as
de-sired and so pass through this arbitrary point, as well as
the minimum, several times without marked error. A series
of experiments showed that one could pass through the
mini-mum five times before the time corresponding to fifteen
microamperes of indicator current varied over one-tenth of
Discussion of the Method
The Bronine-aniline Reaction - Pamfilov(7) states in
his review of methods for the quantitative determination of aniline that the bromometric method is the most conven -ient and accurate one for concentrations in the range 0.1 VF to lo-5 VF. Thi s method is based upon the fact that the
reaction of bromine and aniline to yield 2,4,6 tribromoani -line can be made quantitative and rapid. Later, Pamfilov and Kisselva(8) showed in a study of the bromometric method (with use being made of a potentiometric end-point) that the reaction is rapid only when the bromination is done in "weakly" acid solutions. In O.l·VF hydrochloric acid, the reaction is so slow that a direct titration with bromine is very difficult.
There would be an advantage in adapting the bromometric method to solutions of higher acid concentrations because aniline is conveniently collected in acid solutions. T here-fore experiments were made to study the application of a coulometric process with an amperometric end-point to the
determination of aniline in acid solutions. It was observed that in solutions approximately lo-5 VF in aniline and 1 VF
in hydrochloric acid, the bromination reaction was so slow
-25-end-point was reached there was no chaTacteristic increase
in the indicator current.
A satisfactory procedure required the generation of an
excess of bromine sufficient to complete the reaction in a
short time and experiments showed that at least twenty five
seconds of excess bromine was necessary for completion of
the reaction in one minute. This excess represents only
25
x lo-7 equivalent~~ which is a quantity too small fordetermination by a direct cathodic reduction since the
dif-fusion of bromine to the cathode surface would be so slow
that 100 percent current efficiency could not be achieved.
Therefore use was made of the generation of cuprous copper.
The Required Excess of Bromine - The concentration of
excess bromine had to be sufficient to cause completion of
the reaction in a reasonable time, yet the excess could not
be such as to cause significant loss of bromine through
voffiatilization during the time allowed for the completion
.
of the reaction. Experiments showed bromine equivalent to
twenty five seconds of generation (with a current of app
roxi-mately 10 milliamperes) were required for completion of the
reaction in one minute. Less generation of excess bromine
caused incomplete reaction and low results; a five second
excess led to an error of several percent. Although the
apparatus provided for low rate generation at about one-tenth
the rate used above, a
250
second excess of bromine was then"" (/') w
50
ex:
w a.
~ <( 0ex:
40
l) ~ '-'
30
~
z
w
a:
a:
:J l)20
a:
0t:
l) 010
z
-I
a·
I.
)20
I
FIGURE 1. Titrationof
Aniline TheoreticalI
T1trrat1on TimeI
~
0 0o
I
0I
0l/)
w
a:
w
I
FIGURE:
2.
Magnification of the End-point Vicinitya..
~50
<(
0
a:
u
~40
l
I
t I\) -..J
•
-30
,_
~
.
0/
z
w
[
20
.
""'
.
0/
.
:::>
u
a:
'\
0/
0
10
~
'-_Q/
~
a
Titration in Acetic Acid-a~etate Solutions - Pamfilov
and Kisselva(8) state that the rate of reaction is dependent
upon the pH of the solution. The reaction is -slower in acid
solution and the rate increases with pH. At pH 0 - 1, the
rate is retarded enough that the dual intermediate must be
used. Experiments have shown that in an acetate buffer, pH
4.5,
the rate of the reaction is sufficiently rapid that asecondary coulometric titration with an amperometric end-point
using only bromine can be performed. For pH values greater
than five, the amperometric end-point cannot be used,
be-cause the hydrolysis of the bromine be-causes late end-points
and correspondingly high results. Data showing the effect
I
of pH on the detection of bromine in bromide solutions by
means of an amperometric end-point are given in Part III.
Confirmatory Titrations - Table I contains data
obtain-ed from confirmatory titrations carriobtain-ed out as describobtain-ed in
the procedure above. _The titrations contained in the table
show errors pf less than 0.4 percent for samples between
100 and 300 micrograms, and consistently less than 1.5
per-cent for samples between 10 and 100 micrograms.
The factors limiting the accuracy of the above
measure-ments are thought to be: the preparation and standardization
of solutions, the instability of the aniline solutions and
the dilution of the stock aniline solution. In the larger
samples, there was considerably better agreement among
titra-tions within one group than between the average titer of the
-29-The average "correction time" was 0.3 second of g ener-ation time.
TABLE I
CONFIRl'/lATORY ANALYSES Aniline (micrograms)
Number Taken Found Error
%
ErrorI
274.l
275.1
1.0
0.36
275.4
1.3
0.47
275.7
1.6
o. 58
275.1
1.0
0
.36
275.0
0.9
0.33
274.9
o
.8
0.29
Average
275.2
1.1
0.40
I I
19
9
-5
199.6
0.1
0.05
1
9
9.4
-0.1
-0.05
200.1
o.
6
0.30
1
99
.5
o.o
o
.
o
o
1
99
.5
o.o
o.oo
200.1
o.6
0.30
Average
199.7
0.2
0.10
I I I
99
.7
100.l
0~.40.40
99
.1
-0.6
-0.60
9
9
.8
0.1
0.10
99.8
0.1
0.10
9
9.6
-0.l
'
...;0.10
99
.0
-0.7
-0.70
99
.4
-0.3
-0.30
99.5
-0.2
-0.20
-31-TABLE
I
(Continued)CONFIRMATORY ANALYSES
.Aniline (micrograms)
.,
Number 'raken Found .i.::.rror
$
ErrorIV
52.2
52.8
o.6
1.15
52.2
o.o
o.
o
o
52.2
o.o
o.oo
51.7
-0.5
-0.96
51.8
-0.4
-0.77
51.9
-
0
.3
-0.
57
Average
52
.1
-0.l
-0.19
v
26.1
2
6
.1
o.o
o.oo
26.0
-0.1
-0.38
26.1
o.o
o.oo
26.1
o.o
o.oo
25.
7
-0.4
-1.5
Average
2
6
.0
-0.1
-0.38
VI
13.0
12.5
-0.5
-3.8
13.0
o.o
o.o
13.0
o.o
o.o
12.9
-0.1
.
-0.8
12.8
-0.2
-1.5
1.
2.
4.
5.
6
.
8
.
REFERENCES
Sease, J. W., Niemann,
c.,
and.12,
197 (1947).Iviyer s , R • J • , and Swift,
E.
H. '1047 (1948).
Brown~ R. A., and Swift, E. H. '
2717 1949).
Swift, E. H., Anal. Chern.
J. Am. Chem. Soc.,
ZQ,
J. Am. Chem. Soc.,
21,
Wooster, W.
s.,
Farrington, P.s.'
and Swift,E.
H. 'Chem., 21, 1457 (1949).
Anal.
Meier, D.
J.,
Myers, R. J .? and Swift, E. H., J. Am.Chem. Soc.,
21,
2340 (1949J.Ramsey, W.
J.,
Farrington, P.s.,
and Swift, E. H.,Anal. Chem., 22, 332 (1950).
Pamfilov, A. V., Zeit. fur Anal. Chem.,
Q.2,
282-292(1926).
Pamfilov, A.
v.,
and Kisselva, V. E., Zeit. fur Anal.PART III
STUDIES OF THE BROMINE-CONTROLLED DIFFUSION
STUDIES OF THE BROMINE-CONTROLLED DIFFUSION
CURRENT*
The secondary type of coulometric process involves an
intermediate half-cell reaction which is caused to take place
with 100% current efficiency at the generating electrodes.
Meier, Myers and Swift(2 )have discussed the advantages of
this type of process and the characteristics of suitable
intermediate half-cell reactions.
Bromine is one such intermediate which has been sucess
-( 1
3
45)
fully employed for the titration of reducing agents ' ' ' •
The bromine is generated electrolytically in 0.1 VF (volume
formal) solutions of sodium bromide and acid and reacts with
the reducing agent. When the titration is completed, bromine
is generated in excess and an indicator current flows between
two umooth platinum indicator electrodes (2.1 x 2.4 cm) which
have a small ~otential impressed on them. When the bromide
concentration is much greater than the bromine concentration,
the current is limited by the diffusion of bromine and is
proportional to the concentration of the bromine. This
condi-tion is satisfied after the end point of a titration; the
bromide ion concentration is 0.1 VF and the bromine concen
-tration is about 10-5 VF. The phenomenon provides a·sensi
-tive end-point device for coulometric titrations with bromine.
-
- - - -
-
-
-
-
- - - - -
-
-
-
- -
-
-
-
-
- -
-
- - - -
-*
Part of this work was done as Senior Research,-34-It was the purpose of these experiments to study the
bromine-bromide diffusion current, the effects of the
concen-tration of bromine, bromide and hydrogen ion; the minimum
bromide ion concentration necessary to maintain generation
of bromine with 100% current efficiency was determined.
Experimental
Chemicals
All chemicals were "reagent" grade.
One volume formal sodium bromide solutions were prepared
from the salt.
60% Perchloric acid (9 VF) was tested for reducing agents.
Only very small amounts were detected and were determined by
titration of blank solutions.
Standard solutions of tripositive arsenic were prepared
from Bureau of Standards arsenious oxide and were diluted to
appropriate volu..mes to provide standard solutions for analysis.
A 0.002 VF ·solution of potassium permanganate was prepared.
Buffer solutions corresponding to pH values of 4,
5, 6
and7
~em prepared. Those at pH 4 and pH5 were
prepared fromacetic acid and sodiu..m acetate and those at pH 6 and pH 7
from sodium di>hydrogen phosphate and sodium monohydrogen
phosphate. The total concentration of solute in each was
0.1 VF.
Boiled distilled water was used for all solutions.
Apparatus
Myers and Swift( 2 ) with the following changes: In place of
the laboratory direct current supply, a simple voltag
e-regu-lated rectifier was used, which was connected to -the
alter-nating current line through a voltage-regulating Sola
trans-former. The generator cathode was enclosed in a shield rather
than the generator anode.
Preliminary AdjustI ments
The generator current was determined by measuring the
voltage drop across a standardized 1~$.87 ohm resistance
through which the cuxrent was passing. Generation rates of
1.0386 x 10⁻⁸ and 1.0385 x lo-7 equivalents per second were
used. When not in use, the indicator electrodes were shorted
together and stored in a solution about 0.1 VF in perchloric
acid. A similar solution of perchloric acid was placed in
the generator cathode shield.
Before each set of titrations, the indicator electrodes
were shorted together and connected to the generator anode;
bromine was generated at the high rate for about thirty
sec-onds. This procedure was repeated after each blank or
titra-tion to maintain the indicator electrode sensitivity.
Procedure
The minimum bromide concentration necessary to permit
the generation of bromine with 100% current efficiency.was
-36-decreasing bromide concentrations. All titrated solutions
had a total volume of 40 milliliters and contained
2.5
milli-liters of 9 VF perchloric acid and 25 milliliters of dilute
standard arsenious acid. Dilute solutions of sodium bromide
were added to give bromide concentrations of 0.2, 0.1,
o.o,,
0.025, 0.01, 0.0075 and 0.005 VF.
As soon as the titration cell ( a 40 x 80 mm weighing
bottle) was attached to the stirring apparatus, generation
of bromine was started. The indicator potential was set at
200 millivolts. By means of the built in potentiometer, the
generator current was checked during the course of the
titra-tion and the current was held constant by making small
adjust-ments. When the end-point was reached as indicated by the
rapid rise of the indicator current, generation was continued
in half second intervals; readings of the current were taken
at each interval. A plot of the indicator current against
the generation time (described by Myers and Swift(3)) was
constructed and the linear portion was extrapolated to zero
indicator current; the intercept on the time axis was
desig-nated as the generation time of the sample.
A correction for reducing impurities in the reagents was
made by generating in a blank solution of the composition of
the sample with the substitution of 25 milliliters of water
for the arsenite solution. The generation was done in
half-second intervals and a plot of the indicator current vs. time
was made. The blank solution generation time was subtracted
from the generation time of the sample to give the corrected
When the bromide concentration was small enough that
100% current effeciency was not achieved at the generator
anode, high values were obtained for the corrected titration
time.
In studying the effect of pH on the end-point indicator
current, samples containing 10 milliliters of standard
arsen-ite solutions,
5
milliliters of 1 VJ? sodium bromide solutionand
25
milliliters of buffer solution were titrated asdes-cribed above. Blank solutions containing 10 milliliters of
water in place of the arsenite were also titrated.
Preliminary observations of the maximum pH permissible
were rapidly obtained from these blank solutions. In the absence of enough acid, the indicator current failed to rise
when excess bromine was generated because of the rapid
hydro-lysis of the bromine. When it was believed that a maximu.~
pH was found, a confirmatory test was made by the addition
of
5
milliliters of 9 VJ? perchloric acid to the blank. Thehydrolyzed bromine rapidly reverted to bromine and a sudden
rise of the indicator current "off scale" was observed.
It was of interest for the understanding of the
bromine-bromide-controlled diffusion current to observe the indicator
currents in solutions containing concentrations of bromine
and bromide ranging from pure bromide to essentially p~re
bromine. A curve showing such an indicator current was
ob-tained by placing a titration cell containing a solution of
-38-adding dilute permanganate from a burette and observing the
current flow between the indicator electrodes as the bromide
was oxidized to bromine. The permanganate and its reduced
form, Mn(II), did not give an indicator current.
Discussion
Effec~ of Bromide Concentration on Coulometric Titrations
With Bromine
The minimum bromide concentration permissible in a
coulo-metric titration with an amperometric end-point could be fixed
by either of two factors; there is a critical concentration
of bromide below which the oxidation of bromide at the g
ener-a tor anode does not take place with 100% current efficiency,
and a minimu.~ concentration below which the indicator current
will not be limited by the diffusion of bromine and will not
be linearly proportional to the bromine concentration.
Experi-ments have indicated that the limitation on the bromide
con-centration imposed by the re
.
quirement that the oxidation ofthe bromide take place with 100% current efficiency is the
dominant one. At bromide concentrations too small to achieve
100% current efficiency, the indicator current is still
sensi-tive to and proportional to the bromine concentration. With
these small bromide concentrations, the sensitivity of the
indicator system toward bromine is decreased; that is, the
increase of indicator current per unit increase of bromine
concentration is smaller in more dilute bromide concentrations.
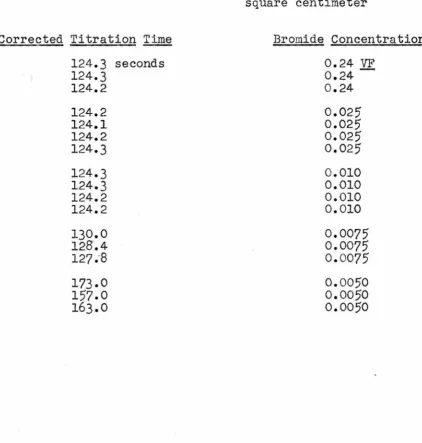
Corrected
TABLE
I
Sample: Arsenious acid Sodium Bromide
Perchloric acid 0.56 VF
Solution Volume: 40 milliliters
Generation rate: 1.0385 x lo-7
equivalents per second
Theoretical Titration time: 124.2 seconds
Current Density: 40 milliamperes per square centimeter
Titration Time Bromide Concentration
124.3 seconds 0.24 VF
124.3 0.24
124.2 0.24
124.2 0.025
124.1 0.025
124.2 0.025
124.3 0.025
124.3 0.010
124.3 0.010
124.2 0.010
124.2 0.010
130.0 0.0075
128'.4 0.0075
127
.
·
s
0.0075173.0 0.0050
157.0 0.0050
[image:47.526.41.463.249.691.2]
-40-arsenious acid sample titrated with bromine at a series of bromide concentrations. It has been concluded that 0.010
VF
bromide is the minimum concentration permissible under the
conditions of the experiment (a maximum current density of
40 milliamperes per square centimeter).
Effect of ;pH on the Indicator Current
Since bromine is known to hydrolyze appreciably in even
slightly acid solutions, it was desirable to determine the
maximum pH at which a stable indicator current could be
ob-tained, when the bromide concentration was 0.1
VF.
In a blank solution containing
25
milliliters of pH6
buffer, ~ milliliters of 1
VF
sodium bromide and 10milli-liters of water, less than one microampere indicator current
was observed when bromine was generated at low rate until
65
seconds of generation were completed. The indicator cur-rent increased slowly to 4 microamperes at 100 seconds.When
5
milliliters of 9VF
perchloric acid were added to the blank after 100 seconds of generation, the current rose "off.
scale". The reducing impurities in the buffer solution were
determined by titrating
25
milliliters of the buffer,5
milli-liters of 1VF
sodium bromide,5
milliliters of 9 VF perchloric acid and5
milliliters of water. The time of generation wasonly 9 seconds.
In a blank solution containing
25
milliliters o~ pH5
generated at low rate. The current showed adequate stability for quantitative measurements. When generation was stopped, the current dropped on the average one microampere in thirty seconds.
The corrected titration time for a solution containing 10 milliliters of arsenite solution,
25
milliliters of pH5
buffer and5
milliliters of sodium bromide agreed with the corrected time for the same size sample of arsenite titrated in 0.56 VF perchloric acid solution within 0.2 percent.The indicator currents observed in the titrations of blanks and samples of arsenic at pH 4 showed no instability due to hydrolysis of the bromine. It was concluded that pH
5
was the maximum pH at which coulometric titrations with an amperometric end-point involving bromine could be used.The Bromine-Bromide Diffusion Current
A 40 milliliter sample of sodium bromide (5.0 x 10⁻⁴ VF) containing 10 milliliters of 9 VF perchloric acid was attached to the stirring apparatus. A 0.002 VF solution of potassium permanganate was added dropwise to the stirred solution from a burette and the indicator current was observed following each addition. Initially, the pink color of the permanganate
was discharged immediately, but as the titration proceeded, /
the tim~ required f~discharge of the color increased.
-42-The indicator current plotted against the volume of perman-ganate added is shown in Figure 1. The indicator current phen-omena are best explained by means of diffusion _processes occur-ring in the diffusion layers. In a rapidly stirred solution, thin stationary liquid layers next to the indicator electrode surfaces are postulated in which diffusion is the primary trans-fer process. Thus, with applied indicator potentials greater than that required to overcome the ohmic resistance of the solution, the rate of discharge of species at the indicator electrodes is dependent upon the rate of diffusion of the reacting solute from the bulk of the solution through the dif-fusion layer to the electrode surface. In rapidly stirred solutions, the diffusion layer is very thin and the rate of diffusion is proportional to the ~oncentration gradient through the layer.
In solutions of bromine and bromide, the indicator elec-trade reactions are,
Anode
i.13A -
~e-..,.
Br2' Ca tnode :BA.~+
z~-
-> 2. 8A.-No net reaction occurs at the indicator electrode surfaces.
When the bromide concentration is large (0.1 VF) the current will be limited by the rate of diffusion of the bromine,
which is observed to be linearly proportional to the bromine concentration. This fact is employed as a ~ensitive end-point method for coulometric titrations with bromine.
Initially, in the absence of bromine, the indicator current
is zero, but the current increases rapidly as bromine is
pro-duced in the solution. When about one-third of-the bromide is oxidized to bromine (the concentration of bromide is then
four times that of the bromine) the indicator current becomes
limited by the diffusion of the bromide and a maximum value
of the indicator current is observed. Further oxidation of the
bromide produces a decrease in the current.
The linear initial and final slopes of the curve and the
location of the maximum depend upon the relative sizes of the
electrodes and the diffusion coefficients of the reacting
species. The smooth platinum indicator electrodes used in
this study were the same size (2.1 x 2.4 cm.) so that it can
be inferred that the diffusion coefficient of the bromine is
greater than the coefficient of bromide.
The indicator current obtained in the titration of
bro-mide with permanganate suggest this technique as a method
for the determ
.
ination of ~icrogram quantities of bromide •The use of dilute permanganate solutions added from a
micro-burette to a rapidly stirred perchloric acid solution of the
bromide, with application of the bromine-bromide-controlled
diffusion current for the detection of the end-point, need
to be investigated and the accuracy determined. However,
there is not sufficient time to study this proposed titration •
f-1
Z
liJer
0::: :J
l.)0:::
0
f-50
'-401-
30-<(
201-l.) 0
z
FIGURE 1. Titration of Sodium Bromide W ith Potassium Permanganate Note: The indicator current {microamperes) is re d uced by one sixth.
.o-0-0-0-0-0·0-....
O...o
O-o/
'O
.... o
'o,
/0
o,
0
o,
I
O
o
'o
d
'o
I
'
0
o,
j
o~
I
~
0
o,
0
I
"o
I
01-;°
'o,
0
j
I0
.50
VOLUME
OF
0
.
002
VF I1.
00
KMn0
4
I1.50
(MILLIL
I
TERS)
1.
2.
3.
4.
REFERENCES
Brown, R. A., and Swift, E. H., J. Am. Chem. Soc.,
11
2717 (1949).
Meier, D.
J.,
Myers, R.J.,
and Swift, E. H., Ibid.,n,
2340 <1949).Myers, R.
J.,
and Swift, E. H., Ibid., 1Q, 1047 (1948).Sease, J. W., Niemann,
c.,
and Swift, E. H., Anal. Chem.,12,
197 (1947~:.Wooster, W. S. ~ Farrington, P. S., and Swift, E. R., Ibid.
PART IV
STUDIES OF HYDROGE
N
ION-CO
N
T
R
OLLED DI
F
FUSION
CURRE
N
TS BETWEEN PL
A
TINIZED-PLATINUM ELECTRODES
The determination of small quantities of strong acids
in unbuffered solutions based upon the measurement of a
hydrogen ion-controlled diffusion current was investigated
by Ludwig Fresenius<3) as an application of the Nernst
Dif-fusion Layer Theory<2,6,7). He observed a current which
was linearly proportional to the hydrogen ion concentration
when a potential difference of the order of 150 millivolts
was impressed upon two platinized-platinum electrodes in~~ersed
in a rapidly stirred solution which was saturated with
hydro-gen gas and was O.l VF (volume formal) in potassium chloride
and 0.001 VF in hydrochloric acid.
Fresenius studied the effects of stirring, temperature,
applied potential and electrode size and his results indicated
that the phenomenon could be used as a method for the
deter-mination of small quantities of both strong and weak acids
.
in aqueous solutions containing an inert supporting electrolyte.
An electrode mechanism was proposed in terms of diffusion of
hydrogen ions through the Nernst diffusion layer to a small
platinized-platinum wire cathode and the diffusion of h
ydro-gen gas to a larger platinized-platinum foil anode. The
processes did not produce a net change in the hydrogen.ion
concentration of the solution and the applied potential was
necessary only to overcome overvoltages and the resistance