Performance Engineering, PSEs and the GRID
Tony Hey+ and Juri Papay*
+ Director UK e-Science Programme EPSRC, Polaris House, North Star Avenue
Swindon SN2 1ET, UK, [email protected]
* Department of Electronics and Computer Science, University of Southampton,
Southampton SO17 1BJ,UK, [email protected]
Abstract
1. Introduction
Performance has been a central issue in computing since the earliest days [3]: ‘As soon as the Analytical Engine exists, it will necessarily guide the future course of science. Whenever any result is sought by its aid, the
question will then arise – by what course of calculation can these
results be arrived at by machine in the shortest time?’
Performance engineering may be defined as a systematic approach in which components of both the application and computer system are modelled and validated. Although performance is probably one of the most frequently used words in the vocabulary of computing, paradoxically it is evident that there is a substantial “knowledge gap” between the software development process and actual performance estimation and optimisation. It is still often the case that programmers and software system designers have insufficient knowledge of the performance implications of their design choices. Indeed, it is clear that systematic performance engineering is not yet an integral part of the software development process and that performance issues often arise very late in the process. As a result it is not surprising that performance problems are a frequent cause of failure of large software development projects.
will slow down and begin to deviate from Moore’s Law. Software developers will then be forced to pay more attention to the efficient use of the available silicon real-estate. Furthermore, if the Grid becomes a reality and computer resource ‘marketplaces’ begin to emerge, software performance on different hardware platforms will be directly related to real costs. In such a ‘computational economy’, it is clear that performance engineering and reliable performance estimation will play a pivotal role in the establishment of realistic ‘performance contracts’. A performance contract is the product of the negotiating process between the suppliers and customers of computing resources. It contains information about the resource demand of applications and available computing capacity. At present this feature is not available, this is mainly due to the lack of reliable performance estimation techniques. The Grid is assumed to be ‘an infrastructure that enables flexible, secure, coordinated resource sharing among dynamic collections of individuals, institutions and resources’ [13]. The resources accessible via the Grid include computational systems, data storage and specialized facilities and are thus a richer set of ‘informational utilities’ than the Web. In this context it is helpful to consider the Grid as providing the global middleware infrastructure that will enable the establishment of transient “virtual organizations” on a transparent and routine basis.
and collaboration. It may also implement some form of automated workflow management. Performance engineering – including estimation, monitoring and measurement - will be an integral component of any Grid PSE since reliable models of performance prediction will be required for any realistic Grid scheduling and accounting packages.
The paper is organized as follows. Section 2 reviews several different approaches that have been attempted for performance engineering and gives a short account of some performance benchmarking, monitoring and simulation techniques. Section 3 takes a brief look at Problem Solving Environments in the context of performance and presents a short account of two recent UK-based PSE projects. The next section outlines some of the challenges represented by the Grid for the performance evaluation community and reviews some EU experiments on Europe-wide meta-computing. Finally we offer some conclusions and challenges for the performance engineering community.
2. Performance Engineering Approaches
2.1. Benchmarks
to conduct the measurements and how to interpret the results. Examples of benchmarking efforts include the Livermore Loops [38], the NAS Kernels[4] and the Parkbench initiative [16]. It is worthwhile for us to summarize the objectives and achievements of Parkbench.
The main objectives of the ParkBench initiative were:
1) To establish a comprehensive set of parallel benchmarks that is generally accepted by both users and vendors of parallel systems.
2) To provide a focus for parallel benchmark activities and avoid unnecessary duplication of effort and proliferation of benchmarks.
3) To set standards for benchmarking methodology and result-reporting with establish a database/repository for both benchmarks and the results.
4) To make parallel and sequential versions of the benchmarks and results freely available in the public domain.
As a result of this effort a benchmark suite was developed which contains sequential and message passing versions of the following codes:
• 5 Low Level Communication codes • 5 Low Level Sequential codes • 5 Parallel Linear Algebra Kernels • 2 NAS Parallel Benchmark Kernels • 3 NAS Compact Application codes
• ORNL Shallow Water Model Application code
hoped that the performance of real applications could be understood. The low-level codes provide basic machine parameters, the kernels provide information about compute intensive algorithms and the compact applications add the complexities of start-up, I/O and so on. In the event, Parkbench was only partially successful: lack of dedicated funding for such a benchmark evaluation programme prevented its full exploration and realization. Nonetheless, there were significant achievements – a serious programming methodology was defined, parallel versions of the NAS Parallel Benchmarks were made available in the public domain and a repository for results with a graphical interface established. In addition, an electronic journal for the rapid publication of performance results was established [19] and this is now established as a special section of the journal Concurrency and Computation: Practice and Experience.
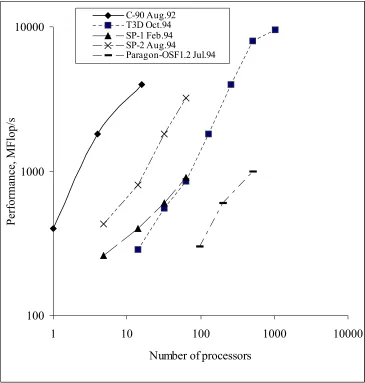
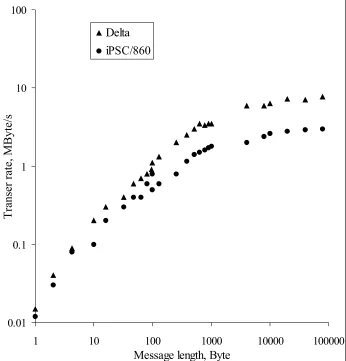
Two examples will illustrate the type of data that was made available by these benchmarks. Figure 1 shows the performance of the parallel LU kernel benchmark on distributed memory (DM) machines. The data is from 1994 and shows for perhaps the first time the performance of a parallel DM system outperforming the largest vector supercomputer of the time. Figure 2 shows results of the low-level communication benchmark COMMS1 for the Intel Delta and the Intel iPSC/860 systems.
this number provides little information about the key parameters governing the resource requirements of real applications.
2.2. Performance measurements
Performance measurements are based on event profiling and tracing. These techniques assume an event model of program execution. During program execution, profiling tools accumulate summary data for significant events such as function calls, cache misses, communications etc. Typically, this approach has a low overhead since such profiling is usually implemented by simple event counters. Using this method users can obtain statistical information on the percentage of time spent by their application program in performing various functions and can use this information to identify potential problem areas.
significant overhead for trace generation. Furthermore, the large volumes of trace data generated can be overwhelming.
There are numerous commercial and academic tracing and profiling tools available. Examples include Apprentice[8], gprof, Vampir[41] and Paradyne[5]. Apprentice is a product of Cray Research which uses source code instrumentation through compiler switches to provide statistics on the level of functions and basic blocks. The advantage of source code instrumentation is that the results of monitoring can be easily interpreted in terms of programming language statements and give very direct feedback to the programmer. A problem with this approach is that the libraries cannot generally be monitored at the same level of detail since they are usually only available in binary format. Unlike the Cray product, Vampir is a commercial graphical event trace browser from Pallas that is available on many different platforms. Vampir also provides visualization and statistical analysis of trace files.
that is collected during the measurement is related to the level of intrusion, therefore it is vital to find the right balance between the volume of data and the acceptable level of intrusion.
2.3. Analytical Models
Historically, Hockney’s n and ‘pipeline’ model provided a useful abstraction of Vector Supercomputer architecture [15]. This pipeline model has been extended to characterize communication performance in parallel DM message-passing systems. In this case the pipeline parameters captured the communication latency and asymptotic communication bandwidth. Typically, the nodes of such systems are scalar processors but it is also possible to use Hockney-style pipeline parameters to provide a simple characterization of the memory hierarchy of the node. These are basic hardware parameters. It is also possible to characterize the ‘computational intensity’ of an application in terms of the ratioof the number of arithmetic operations performed per off-chip memory access. The parallel program is represented as an alternation of non-overlapping computation and communication stages. The application program is described in terms of the number of scalar floating point operations, the amount of data transferred and the number of messages. The output of the model is assumed to be the sum of processing and communication times. The model assumes perfect load balance and the timing formula derived for a single processor is used for the performance characterisation of the whole parallel program. A weakness of this model is that it is only
valid for the performance analysis of parallel algorithms with regular structures and good load balancing.
In recent years, several other cost models have been developed. These include the BSP (Bulk Synchronous Parallel) model [46,36,37] and the LogP model [9]. Both these approaches attempt to get beyond the usual (unrealistic) assumptions made in ‘classical’ PRAM complexity analysis. In particular an attempt is made to take into account the limitations of real systems such as the network bandwidth, and communication and synchronisation overheads. These models aim to provide a machine independent framework for parallel algorithm design and performance prediction. The LogP model characterises the parallel system by the following parameters:
- the upper bound on communication latency from source to target (L), - the overhead of send and receive (o),
- the minimum time interval between consecutive transmissions or receptions (g), - the number of processor/memory modules (P).
The model assumes asynchronous execution mechanism, finite network capacity and specifies the work (W) between communications.
processors with a sufficiently random class of hash functions to avoid memory ‘hot spots’. All that is left of Valiant’s BSP analysis in the Oxford BSP model is the programming methodology of the bulk synchronous programming style! Both the BSP and LogP models are similar in a sense that they attempt to provide an abstraction of the performance of the communication network and processing nodes using a minimal number of ‘average’ performance parameters. Details of the network topology and memory hierarchy are ignored. Such models represent, at best, a “back-of-the envelope” approach to performance prediction. Nevertheless, it must be said that in some cases, as the experiments on CM-5 showed, the LogP model was able to provide a close match to actual performance measurements [11]. As we will see below, a similar ‘average’ speed analysis of the Livermore loops ignoring any effects of the memory hierarchy gives performance results that can be over 100% under- or over-estimated. Other interesting approaches to performance modelling include Carter’s Parallel Memory Hierarchy Model [2] and the Manchester group’s Overhead Analysis approach [44,40].
2.4. Simulation
Simulation can provide very detailed information about both the computer system and application program. This information can be at various levels, in terms of hardware architecture ranging from simulation of only the main components of the architecture right down to simulations at the gate level, and on the application side, from programming language statements down to machine code. The simulation model characterizes the system by a number of state variables that are updated as the simulation progresses. Simulation techniques can be classified according to four basic types: instruction driven, trace driven, execution driven and event driven. Instruction driven simulation is based on interpreting instructions of the target machine. This technique gives high accuracy, achieved by step-by-step simulation of each instruction, but requires long simulation times. Full instruction level simulation is too time consuming for practical use on real applications and complex machine architectures.
each block of code and the parameters of communication events according to the target machine parameters.
Event driven simulation maintains a global queue of events. The operation cycle consists of event fetching, the simulation step and update of the data structure representing the simulated system [42]. The inputs of event driven simulation models are probability distributions of response times, request arrivals and delays. The main disadvantages of probabilistic workload models are that they do not directly represent the parameters of specific application programs and the results of the simulation require in-depth statistical processing in order to determine the accuracy of the model.
Finally, execution-driven simulation models interleave the execution of an application with the simulation of the target system. The main advantages of execution driven simulation are the speed and the use of actual programs for the simulation of parallel architectures rather than using distribution or trace driven workloads. That such an execution driven approach is a feasible solution for the simulation of parallel systems has been demonstrated by systems such as the Rice Parallel Processing Testbed (RPPT) [7] and the Wisconsin Wind Tunnel [43]. The disadvantage of this technique is that it is more difficult to implement than the trace driven approach due to the complex interactions between the application program and the simulator.
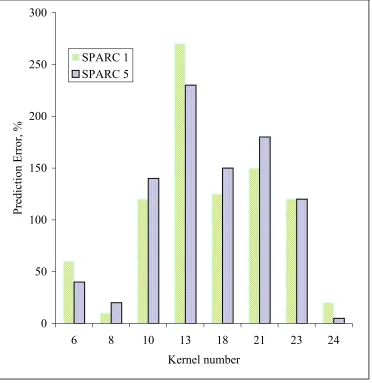
statement analysis of the source code is well known to be unpredictably unreliable as it is presented by Figure 3, which shows the difference between predicted and actual execution times of Livermore Fortran kernels on SPARC 1 and SPARC 5 workstations.
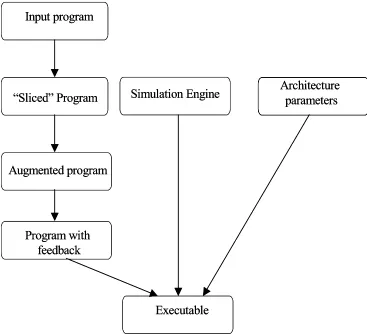
The PERFORM system developed by Dunlop at Southampton is an execution-driven simulation tool that uses a novel ‘Fast Simulation Method’ that attempted to improve the accuracy of prediction and overcome some of the problems with a full simulation of the memory hierarchy [10, 14]. The model uses the “program slicing” technique to isolate the control variables and array indices of the source code, retaining sufficient information to simulate data movement within the memory hierarchy. The sliced program is then augmented with calls to the PERFORM simulator which models the effects of memory hierarchy cache memory, computation and message passing. Fast simulation is achieved by providing feedback between the simulator and source and curtailing loop execution when the cache behaviour of iterations are reliably estimated. The main stages of the Fast Simulation Method used in PERFORM tool are illustrated in Figure 4.
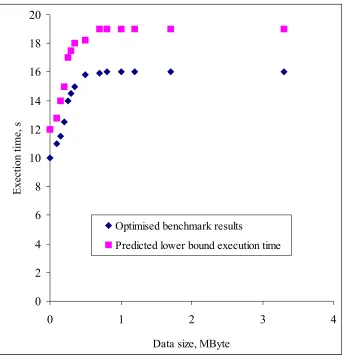
An example of the accuracy of predictions that can be achieved by the PERFORM tool is shown in Figure 5 that compares actual and predicted performance on a SPARC system. As can be seen, the predicted lower bound provided by PERFORM captures the detailed cache effects very accurately.
usually large size programs, their development is expensive and in the case of simulations of the architecture at the instruction level for example, require a long run-time in order to provide meaningful results.
3. Problem Solving Environments
In recent years there has been a significant progress in the development of middleware technologies that provide support for system integration based on objects. Examples of these technologies include CORBA, DCOM and, in the context of Web Services, the recently proposed SOAP protocol. Although these technologies share many common features there is no universally accepted definition of objects and consequently their claims to provide full interoperability within the same system are somewhat questionable. At present, CORBA is the dominant middleware technology in the PSE world. Key advantages of CORBA are the existence of a single specification document and the participation of more than 800 companies in the consortium. Nevertheless, despite the existence of the IIOP inter-ORB protocol, there is still a problem for applications that attempt to mix two or more of the large number of vendor specific implementations of CORBA. An unwelcome result of this diversity is the problem of interoperability between competing middleware products. It should also be emphasised that programming using any of the CORBA implementations is not trivial and the C++ syntax is rather complex. By contrast, DCOM is Microsoft’s answer to CORBA and this has the definite advantage that there is one specification, implementation and one vendor. A limitation is that DCOM runs only on Windows.
Nevertheless, these products have a wide user base and demonstrate what is possible in principle though neither have seen the development of a version for parallel systems as a high commercial priority. Apart from these examples, there are many ‘research’ PSEs either in existence or under development in many universities and research institutes around the world. Examples include GasTurbnLab from Purdue [22], BIOPSE from Utah [23] and Autobench from Stuttgart [24]. Unfortunately, it is not clear whether any of these PSE systems are much used by real users.
As two examples of PSE projects, we shall briefly describe two ongoing UK projects: one a project with considerable direct industrial involvement and the other a purely ‘academic’ project. These are the Swansea/BAE Systems Project [49] and the Cardiff/Southampton PSE project [47]. The Swansea/BAE Systems project represents a complete industrial environment for multi-disciplinary computational fluid dynamics, electro-magnetics and structural mechanics simulations. This PSE includes geometry builder, mesh repair, unstructured grid generation, grid quality analysis, post-processing and data analysis, execution on remote/parallel platforms, help facilities and application integration. The system is based on CORBA and uses a parallel architecture (VIPar) for image processing. This PSE has been further developed in the CAESAR and JULIUS EU projects. A key problem for implementation of their ‘Computational Science Pipeline’ is the data transfer between the different components.
be used for the rapid prototyping of application specific PSE environments [47]. The main components developed in this project are: a Visual Component Composition Environment, an Intelligent Resource Manager, based on the Southampton Intrepid Scheduler [1] and a Software Component Repository. The two applications targeted by this project are Molecular Dynamics and Photonic Crystal Structures simulations. A PSE architecture incorporating the developed components is presented in Figure 6.
The system is based on the object-web concept where the services are represented as network objects. The problem is formulated as an XML request by the user and the response, also in XML, is produced by the Web server. The user interface is embedded in the browser environment and enables visual programming by allowing “drag-and-drop” of objects in a task-graph design area. The interaction with the user is implemented as a sequence of Web pages. As a commercial middleware ORB, the ORBACUS implementation of CORBA was selected which is a mature product and provides numerous services for naming, trading and interface repository.
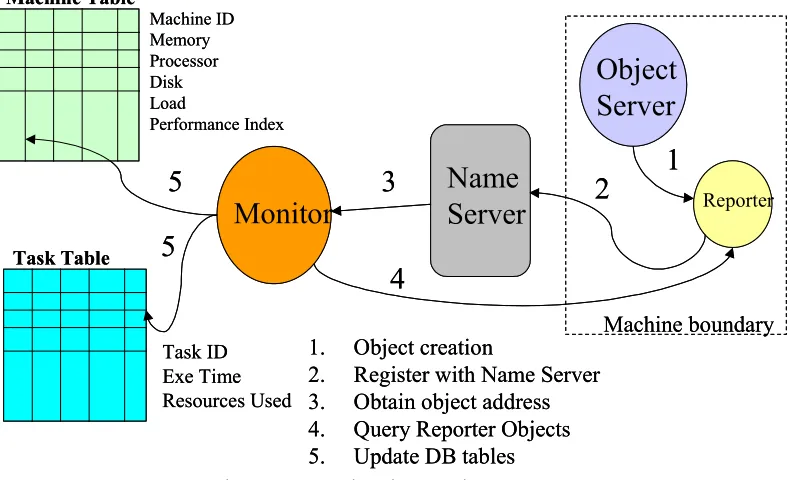
represented in Figure 7. On each computer there is an Object Server deployed which instantiates the Reporter object. The Reporter registers with the Name Server, which maintains a list of remote object addresses. The Monitor at regular intervals queries the Reporter objects and updates the Machine and Task tables in the database.
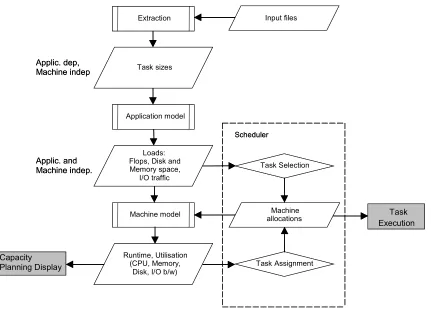
The Scheduler provides task allocation to resources, run-time forecast and dynamic load-balancing. The scheduling is based on machine independent application load models for CPU, memory size, I/O traffic and disk volume. These algebraic expressions are included in the description of each task and represent the task resource requirements. The scheduling algorithm performs the following steps for each task in the task-graph:
• check the availability of licenses, memory, disk • generate list of candidate machines
• compute time components • select minimum execution time
• include task-machine binding in the schedule
The three year project is nearing completion and a full evaluation with performance measurements will be available soon. Preliminary indications are that such a component based approach can bring real advantages in terms of software development and deployment. In the final analysis, however, it will be the reaction of users to such an environment that will provide the real measures of success or failure!
CAE tools. Furthermore, there is little incentive for vendors of legacy codes to make their product interoperable with tools from other vendors. In addition, present PSEs focus almost entirely on the design and simulation part of the engineering process. There is a real need to incorporate the experimental validation and testing part of the process. Thus a complete PSE would offer support for the recording and analysis of experimental as well as simulation data. Incorporation of databases of experimental measurements and simulation results will allow the development of data mining and knowledge discovery components of the PSE. PSEs have a long way to go to prove their worth in real engineering environments!
PSEs often represent large scale meta-applications which require massive computing resources. In this case the role of performance engineering is to predict the resource requirements of the application, to ensure that there is sufficient computing capacity available and the individual tasks are assigned to the most appropriate computer.
4. Grids
4.1. The Grid as a new paradigm
it is not unreasonable to expect that the Grid will eventually become the key middleware not only for science and engineering but also for industry and commerce.
In the US several agencies are funding major Grid initiatives. Examples include: - NASA Information Power Grid [25]
- NSF Science Grid [26] - NSF GriPhyN Project [27] - DOE PPGrid [28]
- NSF NVO [29] - NSF NEESGrid [30]
Most of these Grid Infrastructure and Application Projects make use of the Globus Toolkit [12] as the basic platform on which to provide Grid services. In addition, the NSF funded GrADS project [6] identifies many important research issues for Grid computing. Europe has been also active in Grid R&D. In addition to two initial EU Grid projects, DataGrid [17] and EuroGrid [31], several new EU Grid-centred projects are currently under negotiation. National governments in the EU have also recognised the potential strategic importance of the Grid. For example, under its new ‘e-Science Programme’, the Office of Science and Technology (OST) in the UK have allocated £120M for the deployment of e-Science Grids spanning a wide range of application areas and the development, with industry, of the associated Grid middleware.
facilities in a routine way as the Web now allows us to share information. In cartoon form, this Grid vision is depicted in Figure 8.
There are many genuine Computer Science research challenges to be overcome before we can realize this vision. In the context of this paper, an obvious issue is the need for realistic performance estimation. Together with mechanisms for monitoring and accounting, reliable performance estimation will allow the creation of global marketplaces for Grid resources. As a starting point for a discussion of Grid performance estimation, it is worthwhile to review results from some recent meta-computing projects.
4.2. Meta-computing experiments
Optimisation by simulation is computationally expensive and the user needs these simulations to execute in the shortest possible time or within a set period or resource cost. There is a clear economic incentive to achieve efficient utilisation of the available resources with as little intervention as possible. Several of these meta-computing experiments utilized Europe-wide computing resources. An illustration of the results of the PROMENVIR project performed by connecting up the resources of project partners across Europe is given in Table 1. Table 1 contains statistics of the resource usage obtained by running a large scale Monte Carlo simulation of satellite deployment. The program and associated data were small enough that each simulation could run on a single workstation or node: non-trivial parallelism of the application code was not required. In this simulation a thousand ‘shot’ (parameter set) computational experiment has been performed. Initially all machines listed above were specified as comprising the Parallel Virtual Computer (PVC). During the actual run, however, some of them were either not available or not used due to the pre-existing high load on them. As can be seen, the experiment was very successful and utilized nearly 100 processors and resulted in a very significant improvement in exploration of the design space.
benchmarking large industrial size codes such as NASTRAN and Sysnoise. The process of obtaining load models and using them by the scheduler is presented in Figure 8.
The accuracy of performance predictions obtained by this technique is illustrated on the case study of a static analysis with NASTRAN [39]. It is important to stress that, as is commonly the case for commercial codes, the source code was not available for instrumentation. A series of 2D and 3D test problems were used for benchmarking on two different architectures - a Distributed Memory IBM SP2 and a Shared Memory SGI Power Challenge. During benchmarking, the run-time, memory, disk traffic, disk space parameters were measured. These measurements were then used for the development of analytical performance models. At the first stage a machine independent model of the application is derived. Figure 9 illustrates that the derived CPU-load model (number of floating point operations) for SP2 and Power Challenge show a close match so that, as might be expected, the number of FPU operations in both cases is approximately the same. The derived load models are used for the development of an analytic expression that incorporates the key application parameters such as degrees of freedom, front size, number of extracted eigenvalues, etc. The accuracy of the analytical model of CPU-load for the NASTRAN static analysis code is illustrated in Figure 10.
substantial benchmarking effort and also some knowledge of the algorithm and application. Nevertheless, these experiments demonstrate the level of accuracy that can be obtained in the industrially relevant environment in which the source code of the application package is unavailable.
4.3. Performance and the Grid
5. Concluding Remarks
In this paper, various techniques used for performance engineering on parallel and distributed systems have been reviewed. We conclude with two remarks:
(1)
(2)
The national and international levels of investment in Grid computing make it clear that performance estimation, modelling and measurement on the Grid will assume an increasingly important role in any future computational Grid economy. Over the last decade, we have seen a shift in the software industrie towards an object-oriented, component-based software methodology. At present, although the programming interfaces and functionality of these components are exposed, there is no methodology for expressing performance trade-offs in the software development process. We therefore suggest that, in addition to specifying interfaces and functions, software methodologies need to incorporate some form of “performance metadata”. Such metadata would contain information about the performance and resource requirements of software constructs and components. Only with the availability of such performance metadata will the construction of truly intelligent schedulers become possible. An internationally coordinated effort to define a common format for performance metadata seems long overdue.
understanding the interaction between the application and the computer architecture. It is also important to note that in a typical industrial application users will not have access to the source code of a software package or library routine. These requirements highlight the need for performance model abstractions that are relatively simple and easy to use yet are sufficiently accurate in their predictions to be useful as input to a scheduler or intelligent agent. Reliable performance estimation becomes even more relevant when we consider payment for services in a computational Grid economy. Users will require answers to questions such as best value for money as well as guarantees for specified turn-around times.
References
[1] N.K. Allsopp, T.P. Cooper, P. Ftakas. Porting Legacy Engineering Applications onto Distributed NT Systems. Proceedings of the 3rd USENIX Windows NT Symposium, July 12-15, 1999, Seattle, Washington, USA.
[2] B.Alpern, L.Carter,E. Feig and T. Selker. The Uniform Memory Hierarchy Model of Computation. Algorithmica",vol.12,no.2/3",pp.72--109,1994.
[3] Babbage, Charles, Passages of the Life of a Philosopher. Longman, et alia, London, 1864.
[4] D. Bailey, J. Barton, T. Lasinski, and H. Simon (editors). The NAS parallelbenchmarks. Technical Report RNR-91-02, NASA Ames Research Center, Moffett Field, CA 94035, January 1991.
[5] Barton P. Miller, Mark D. Callaghan, Jonathan M. Cargille, Jeffrey K. Hollingsworth, R. Bruce Irvin, Karen L. Karavanic, Krishna Kunchithapadam and Tia Newhall. The Paradyn Parallel Performance Measurement Tools. IEEE Computer 28, 11, pp.37-46 (November 1995).
[6] Francine Berman,Andrew Chien,Keith Cooper,Jack Dongarra,Ian Foster, Dennis Gannon,Lennart Johnsson,Ken Kennedy,Carl Kesselman, Dan Reed,Linda Torczon,and Rich Wolski, The GrADS Project:Software Support for High-Level Grid Application Development,
[7] R.G.Covington, S.Dwarkadas, J.R.Jump, J.B.Sinclair, S.Madala. Efficient Simulation of Parallel Computer Systems, International Journal in Computer Simulation, no. 1, 1991, pp.31-58.
[8] CRAY Research, Introducing the MPP Apprentice Tool, CRAY Manual IN-2511, 1994.
[9] D.Culler, R.Karp and D.Patterson. LogP: Towards a realistic Model for Parallel Computation, ACM SIGPLAN Notices, vol. 28, no. 7, 1993, pp.1-12.
[10] A. Dunlop, Southampton Ph.D. thesis (1997)
[11] A. C. Dusseau, D. E. Culler, K. E. Schauser, and R. Martin. Fast Parallel Sorting under LogP: Experience with the CM-5. IEEE Transactions on Parallel and Distributed Systems, August 1996.
[12] Foster I. and Kesselman C., Globus: A Metacomputing Infrastructure Toolkit, International Journal of Supercomputer Applications, 11(2): 115-128, 1997. [13] Foster, I. and Kesselman, C. (eds.). The Grid: Blueprint for a New Computing
Infrastructure. Morgan Kaufmann, 1999.
[14] T. Hey, A. Dunlop and E. Hernândez Realistic Parallel Performance Estimation
Parallel Computing 23 (1997) 5-21
[15] R.W.Hockney. Performance parameters and benchmarking of supercomputers, in Computer Benchmarks, editors J.J.Dongarra and W.Gentzsch, Elsevier Science Publishers, Holland, 1993, pp.41-63.
[17] Hoschek, W., Jaen-Martinez, J., Samar, A., Stockinger, H. and Stockinger, K., Data Management in an International Data Grid Project. In Proc. 1st IEEE/ACM International Workshop on Grid Computing, 2000, Springer Verlag Press.
[18] http://www.netlib.org/parkbench/
[19] http://hpc-journals.ecs.soton.ac.uk/PEMCS/ [20] http://www-106.ibm.com/developerworks/xml/ [21] http://www.xml.com/
[22] http://www.cs.purdue.edu/research/cse/gasturbn/ [23] http://ampano.cs.utah.edu/software/
[24] http://wwwvis.informatik.uni-stuttgart.de/eng/research/proj/autobench/ [25] http://www.ipg.nasa.gov/
[26] http://www.ncsa.uiuc.edu/About/PACI/ [27] http://www.griphyn.org/
[28] http://www.ppdg.net/
[29] http://www.hoise.com/primeur/01/articles/monthly/AE-PR-04-01-15.html [30] http://www.neesgrid.org/
[31] http://www.eurogrid.org/
[32] http://www.cse.clrc.ac.uk/ActivityResources/16 [33] http://www.beasy.com/projects/hipsid/pac.html
[34] J.Labarta, S.Girona, T.Cortes. Analyzing scheduling policies using Dimemas, Parallel Computing",vol.23,no.1-2,pp.23-34, 1997.
[36] W.F.McColl. BPS Programming, in.Proc. DIMACS Workshop on Specification of Parallel Algorithms, Princeton, 9.-11. May, 1994.
[37] W.F.McColl. Truly, madly, deeply parallel, New Scientist, February 1996, pp.36-40.
[38] F.H.McMahon. The Livermore Fortran kernels test of the numerical performance range, Performance Evaluation of Supercomputers, 1988, pp.143-186.
[39] MSC/NASTRAN Quick Reference Guide, Version 70, The MacNeal-Schwendler Corporation, 1997.
[40] N.Mukherjee,G.Riley and J.Gurd. FINESSE: A Prototype Feedback-guided Performance Enhancement System",Proceedings of 8th Euromicro Workshop on Parallel and Distributed Processing, Rhodes, Greece, January 19-21, 2000",IEEE Computer Society Press, pp.101--109,2000.
[41] W.E. Nagel, A. Arnold, M. Weber, H-C. Hoppe, K. Solchenbach, VAMPIR: Visualization and Analysis of MPI Resources, Supercomputer 63, Vol. 12, No. 1, pp. 69-80, 1996
[42] D.Pease et al. PAWS: A Performance Evaluation Tool for Parallel Computing Systems., IEEE Computer, January 1991, pp.18-29.
[44] G. Riley, M. Bull, J. Gurd. Performance Improvement through Overhead Analysis:A Case Study in Molecular Dynamics, Proceedings of the 1997 International Conference on Supercomputing, ACM Press,1997.
[45] Neil Spring and Rich Wolski. Application Level Scheduling of Gene Sequence Comparison on Metacomputers, Proceedings of the 12th ACM International Conference on Supercomputing, Melbourne, Australia, July, 1998.
[46] L.G.Valiant. A bridging model for parallel computation, Communications of the ACM, vol. 33, no. 8, 1990, pp.103-111.
[47] David.W.Walker, M. Li, O.F.Rana, M. S. Shields, and Y. Huang, The Software Architecture of a Distributed Problem-Solving Environment Concurrency: Practice and Experience. Volume 12, Issue 15, 2001, pp1455-1480.
[48] Wolski, R. Forecasting Network Performance to Support Dynamic Scheduling Using the Network Weather Service. In Proc. 6th IEEE Symp. on High Performance Distributed Computing, Portland, Oregon, 1997.
Figure 1 - Performance of Vector vs. Distributed Memory machines on LU kernel
100 1000 10000
1 10 100 1000 10000
Number of processors
P
erform
ance, MF
lop/
s
C-90 Aug.92 T3D Oct.94 SP-1 Feb.94 SP-2 Aug.94
0.01 0.1 1 10 100
1 10 100 1000 10000 100000
Message length, Byte
Transer rate, MByte/s
[image:34.612.141.487.187.548.2]Delta iPSC/860
0 50 100 150 200 250 300
6 8 10 13 18 21 23 24
Kernel number
P
redi
ct
ion Error, %
SPARC 1
[image:35.612.140.512.139.522.2]SPARC 5
Input program
“Sliced” Program Simulation Engine
Program with feedback
Architecture parameters
Executable Augmented program
Input program
“Sliced” Program Simulation Engine
Program with feedback
Architecture parameters
[image:36.612.143.510.174.508.2]Executable Augmented program
Figure 5 - Predictive power of PERFORM tool
0 2 4 6 8 10 12 14 16 18 20
0 1 2 3
Data size, MByte
Exection time, s
Optimised benchmark results
Predicted lower bound execution time
Monitor
Scheduler
Objects
ORBACUS Despatcher
Services
Reporter Task launcher
Machine boundary
DB
WEB
server
Web-pages
Browser
Monitor Monitor
Scheduler Scheduler
Objects
ORBACUS Despatcher
Despatcher
Services Services
Reporter Task launcher
Machine boundary
DB
WEB
server
Web-pages
[image:38.612.100.467.184.483.2]Browser
Monitor
Name
Server
Object
Server
Reporter Machine Table Task Table Machine ID Memory Processor Disk Load Performance Index Task ID Exe Time Resources Used1
2
3
4
5
5
1. Object creation
2. Register with Name Server 3. Obtain object address 4. Query Reporter Objects 5. Update DB tables
Machine boundary
Monitor
Name
Server
Object
Server
Reporter Machine Table Task Table Machine ID Memory Processor Disk Load Performance Index Task ID Exe Time Resources Used1
2
3
4
5
5
1. Object creation
2. Register with Name Server 3. Obtain object address 4. Query Reporter Objects 5. Update DB tables
[image:39.612.128.522.186.426.2]Machine boundary
Computing resources
Data
Knowledge
Instruments
People
Solution
Complex problem
GRID
Computing resources
Data
Knowledge
Instruments
People
Solution
Complex problem
[image:40.612.136.507.129.413.2]GRID
GRID
CPUs Availability Shot Statistics Partner Nproc In PVC Access Used Failed Successful Total
Southampton (PAC) 15 15 15 14 1 150 151
Southampton University 10 10 9 6 0 40 40
Barcelona (UPC) 16 16 16 16 1 275 276
Stuttgart (RUS) 12 12 11 9 0 104 104
Madrid (CASA) 15 15 15 14 15 184 199
Bilbao (CEIT) 12 12 12 8 0 98 98
Torino (ItalDesign) 11 11 6 5 2 63 65
Torino (Blue Enginnering) 11 11 11 7 6 61 67
Grand Totals 102 102 95 79 25 975 1000
Total cpus installed 102 Elapsed Execution Time: 4:39:16 Total cpus defined in PVC 102
[image:41.612.110.497.146.321.2]Total cpus available 95 Approx Single CPU Time: 250 hrs Total cpus used in WAN 79
Task sizes
Loads: Flops, Disk and Memory space,
I/O traffic
Runtime, Utilisation (CPU, Memory,
Disk, I/O b/w) Extraction Application model Machine model Task Selection Machine allocations Task Assignment Capacity Planning Display Applic. and Machine indep. Applic. dep, Machine indep Task Execution Input files Scheduler Task sizes Loads: Flops, Disk and Memory space,
I/O traffic
Runtime, Utilisation (CPU, Memory,
[image:42.612.114.545.191.501.2]Disk, I/O b/w) Extraction Application model Machine model Task Selection Machine allocations Task Assignment Capacity Planning Display Applic. and Machine indep. Applic. dep, Machine indep Task Execution Input files Scheduler
1.0 10.0 100.0 1000.0 10000.0 100000.0
100 1000 10000 100000 N CP U L oa d, M fl op 3D Chall 3D SP2 1.0 10.0 100.0 1000.0 10000.0
[image:43.612.105.528.274.509.2]100 1000 10000 100000 N CP U Lo ad ,M fl op 2D Chall 2D SP2
10.0 100.0 1000.0 10000.0 100000.0
100 1000 N 10000 100000
CPU
Loa
d,Mf
lop
[image:44.612.157.461.204.528.2]2D Chall 2D Model 3D Chall 3D Model