Abstract—Aim of this research is review of methods for measuring supply chain performance in the palm oil downstream industry. To establish a method, it will require process mapping on overall business process in the palm oil supply chain. Case study is conducted on Malaysian palm oil industry. This paper shows mapping of business processes in the palm oil downstream industry involving industry of crushings, refineries and oleochemicals. Then, finding is SCOR model more suitable to measure supply chain performance in this case. Further research is required to test into case study in the palm oil downstream industry in order to validate indicators that will be made. It is necessary to note that this article provides the gap of knowledge to show a method for measuring supply chain performance in the palm oil downstream industry based on case study in the Malaysian palm oil industry.
Index Terms—supply chain, process mapping, palm oil, downstream industry, SCOR model
I. INTRODUCTION
ALM oil industry has the high complexity of the business chain. These business processes are initiated from plantation, and then processed by the processing industries, distributed to industry of product developers that produce diverse products until the end user as customer. Therefore, this business has networked in different processes and activities in order to bring products and services to the market with the purpose of customer satisfaction and shareholder value [1]. These industries consist of many businesses along the supply chain involving plantations, millings, refineries, and oleochemicals [2].
Data export palm oil in Malaysia shows there is an increasing number of export to several countries to 33% from 2011-2012. Nevertheless, in this year there are also
Manuscript submitted March 12, 2014; revised 3 April, 2014. This work was supported by Research Student Grant (RSG) VOT R.J130000.7309.4B121 at Universiti Teknologi Malaysia.
F. Lestari is a PhD candidate at Universiti Teknologi Malaysia, Faculty Management and Sultan Syarif Kasim State Islamic University (corresponding author e-mail: [email protected]).
K. Ismail is Assoc. Professor at the Universiti Teknologi Malaysia and her expertise is in entrepreneurship and commercialization (e-mail: [email protected]).
A. B. Abdul Hamid is Professor and Head Marketing Research Group at Universiti Teknologi Malaysia (e-mail: [email protected]).
E. Supriyanto is Professor at Universiti Teknologi Malaysia who
researched about oil palm in Malaysia (e-mail:
Hisbunnazar is a Staff in National Land Agency (BPN) at Riau Province (e-mail:[email protected]).
W. Sutopo is a researcher at the Sebelas Maret University, Department Industrial Engineering in Indonesia (e-mail: [email protected]).
increasing four local industries that produce oil palm derivative products [3]. This shows that the inability of the local industry that is represented by a network of supply chain to increase the value added of the oil derived products. It is necessary to techniques for measuring supply chain performance in the local industry.
Supply chain performance measurement can be done by mapping the business activities between suppliers, manufacture and customers. Mapping of the business flow in palm oil industry is necessary; therefore, it requires of linkage among of stakeholders that operate within it [4]. Currently, most research on supply chains in palm oil sector is developing models for designing supply chain networks for local and international markets [5], [6]. Nevertheless, stakeholders are difficult to map the palm oil industry because the sequencing of relationship among entities in supply chain process becomes one of the critical barriers in achieving the supply chain integration [7]. Thus, it caused the difference in perception of the business process in palm oil industry.
Furthermore, there are several methods for measuring supply chain performance. Nevertheless, the research found that the supply chain strategy was used for different constructs for different country because the manager has different perceptions and cultures on how to arrange a strategy for its organization [8]. Previous studies have shown that different industry may also have a different effect on supply chain management practices [9], [10]. To solve these problems, the decision maker should find fitting on these approaches and models based on respective business processes. In addition, the relationship between the members of a supply chain becomes one of the important barriers in achieving the supply chain integration. It is important to see the integration aspects between the members of the supply chain [11]. This paper aims to review several methods in order to find the suitable approach to measuring supply chain in the palm oil downstream industry.
II. PROCESS MAPPING IN PALM OIL SUPPLY CHAIN
Process mapping will be developed focusing on case study approach on the Malaysian Palm Oil industry. Data of process mapping are collected based on Malaysian Palm Oil Board (MPOB) annual report for the year 2012.
A. Stage One: Understanding Business Process
Process mapping will be developed focusing on case study approach on the Malaysian Palm Oil industry. Understanding the first stage is used as guidelines in developing business process in palm oil industry from
Measuring Supply Chain Using SCOR Model in
Palm Oil Downstream Industry: A Review
Fitra Lestari, Kamariah Ismail, Abubakar Abdul Hamid,Eko Supriyanto,Hisbunnazar,Wahyudi Sutupo
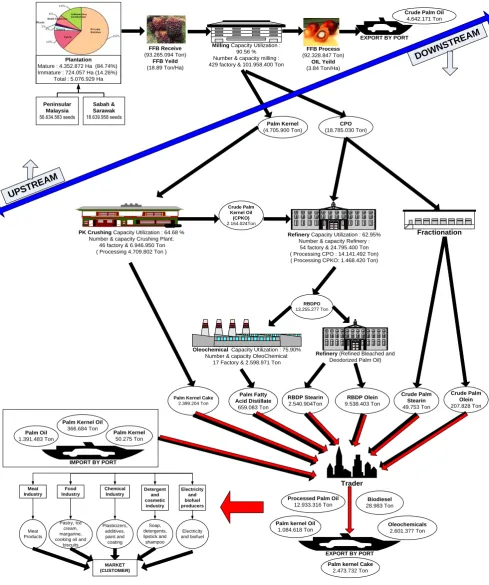
upstream to downstream. In the upstream sector, Malaysia has a plantation area of palm oil covering 5.076.929 hectares comprising of 50.39 % hectares Peninsular Malaysia and Sarawak-Sabah of 49.61% hectares. In addition, the area has produced 85.74% and approximately 14.26% of the rest are waiting for the harvest. The actors in the Malaysian palm oil industry involve public, private sector and independent smallholders [12]. Fresh fruit bunch (FFB) is the main product in palm oil plantation which it will be brought to the milling process. This process produces some derivative products that can be developed to give added value to the customer. Furthermore, milling process can be elaborated to become several products such as Crude Palm Oil (CPO), Kernel, Empty Bunch, Shell and Fiber [13], [14].
In the downstream sector, the yield of oil palm from the milling process is later taken for processing industries. According to Belai et al. [15], Palm Kernel is processed by crushing industry to produce Crude Palm Kernel Oil (CPKO) and other byproducts such as Palm Kernel Cake can be directly sold as animal feed. Then, the yield of oil such as CPO and CPKO are processed in the refining industry to produce Refined Bleached and Deodorized Palm Oil (RBDPO). Refinery industry also produces RBDP Stearin and RBDP Olein. On the other hand, RBDPO is processed by Oleochemical industry to produce Palm Fatty Acid Distillate (PFAD). Not all CPO products were produced by refineries, but part of them through the fractionation processes that produce Crude Palm Olein and Crude Palm Stearin.
Export and import of palm oil derivatives products use shipping services [16]. Thus, there are a number of companies that used the port distribution center for the export of palm oil derivative products to the market internationally. In addition, Malaysia is not only targeting the international market, but also palm oil derivative products are traded in the local market to stimulate local industry. These products will be processed by the developed countries to retail businesses such as food products, chemical industry, personal care products, animal feed, cleaning products and several sources of energy [17].
B. Stage Two: Developing Supply Chain Structure
Supply chain structure is built based on the sequence process that occurs in the palm oil industry. The structures are arranged into the block diagram and assisted by arrows that show the direction of the relationship of activity in the system. In addition, the arrows indicate the flow of products that describe the movement from one operation to another operation. Furthermore, block diagrams that have been linked to the business processes will be compiled with the attributes of the data.
On the other hand, Malaysian palm oil industry more uses motor transportation than other facilities in domestic market. Infrastructure like the road is used to ship goods into several areas. However, motor shipment across multinational boundaries involves a number of different import regulations. Another facility of shipping on logistic infrastructure is ocean transportation that is used to activity of export and import. Malaysia has some bigger ports that will support on shipping activity to other countries. In this
case, an arrow which notes in red line is transportation using ocean. While, motor transport will be shown using black line. Shipping uses other transportations such as air and rail on the palm oil industry in Malaysia just a few cases. Consequently, these transportations are ignored within the process mapping.
C. Stage Three: Data Collection of Supply Chain
These data depend on forecasting of palm oil demand in the local market and international. Entities on business process in palm oil industry involving plantations, millings, crushings, refineries, oleochemicals, and distribution to the market. It also describes that Malaysia has six categories of player in palm oil industry. Private estates have the highest land area in Malaysia around 62 %. Then, several numbers of industries in Malaysia are 429 millings, 46 crushings, 54 refineries, and 17 oleochemicals. Processing industry in the export sector is supported by the port as shipping service. In Malaysia, there are the big five ports such as Butterworth, Port Klang, Pasir Gudang, Lahat Datu and Sandakan. Most destinations exporting of oil palm products are delivered to developed country such as China, India and Netherlands.
D. Stage Four: Developing Whole Chain into a Map
The data of the entire operation drafted into a map after the mapping structure of the business processes is done. This map shows the overall business activity from upstream to downstream. Then, each entity is given data attributes involving data of industry capacity, area plantation, and type of product in the processing industry. The overall operation of the supply chain will be described in the form of a rich picture diagram. The results of process mapping produce a set of activities that are interlinked in a business chain. The finding of this process mapping in the Malaysian palm oil industry for the year 2012 can be shown in figure 1.
E. Stage Six: Identify Issue and Competitiveness
Final map can be used as tools to identify problems that are happening in the business chain. Several issues are obtained from this method. The results of the process mapping showed that Malaysia still focuses on upstream industries. The two main islands in Malaysia involving Peninsular Malaysia and Sarawak Sabah are used as area for palm oil plantation. Almost all states planted palm oil trees while the number of palm oil downstream industries in Malaysia is still limited. In addition, Malaysia exported more palm oil to several countries that could transform oil into finished goods to retail businesses. Then, it also shows that some industries in Malaysia are still imported from various countries. It means there is a shortage of palm oil feedstock.
Milling Capacity Utilization : 90.56 % Number & capacity milling : 429 factory & 101.958.400 Ton
Fractionation Plantation
Mature : 4.352.872 Ha (84.74%) Immature : 724.057 Ha (14.26%)
Total : 5.076.929 Ha
Peninsular Malaysia 56.634.583 seeds
CPO (18.785.030 Ton) Palm Kernel
(4.705.900 Ton)
RBDP Stearin 2.540.904Ton
Crude Palm Olein 207.828 Ton RBDPO
13.255.277 Ton
RBDP Olein 9.538.403 Ton
Crude Palm Stearin 49.753 Ton Crude Palm
Kernel Oil (CPKO)
2.164.024Ton
Palm Kernel Cake
2.399.204 Ton
Oleochemical Capacity Utilization : 75.90% Number & capacity OleoChemical:
17 Factory & 2.598.971 Ton
Trader
EXPORT BY PORT Refinery (Refined Bleached and
Deodorized Palm Oil) Sabah &
Sarawak 18.639.958 seeds
Refinery Capacity Utilization : 62.95% Number & capacity Refinery :
54 factory & 24.795.400 Ton ( Processing CPO : 14.141.492 Ton) ( Processing CPKO: 1.468.420 Ton) PK Crushing Capacity Utilization : 64.68 %
Number & capacity Crushing Plant: 46 factory & 6.946.950 Ton ( Processing 4.709.802 Ton )
Palm Fatty Acid Distillate
659.083 Ton
Processed Palm Oil 12.933.316 Ton
Biodiesel 28.983 Ton
Oleochemicals 2.601.377 Ton
Palm kernel Cake 2.473.732 Ton Palm kernel Oil
1.084.618 Ton IMPORT BY PORT
Palm Oil 1.391.483 Ton
Palm Kernel Oil 366.684 Ton
Palm Kernel 50.275 Ton
FFB Receive (93.265.094 Ton)
FFB Yeild (18.89 Ton/Ha)
FFB Process (92.328.847 Ton)
OIL Yeild (3.84 Ton/Ha)
Food Industry Meat
Industry
Chemical Industry
Detergent and cosmetic
industry
Electricity and biofuel producers
Meat Products
Pastry, Ice cream, margarine, cooking oil and
biscuits
Plasticizers, additives, paint and coating
Soap, detergents, lipstick and shampoo
Electricity and biofuel
MARKET (CUSTOMER)
UPST REAM
DOWN STRE
AM
EXPORT BY PORT
[image:3.595.63.553.49.635.2]Crude Palm Oil 4.642.171 Ton
Fig. 1. Rich picture diagram of process mapping Malaysian palm oil industry
III. MEASURING SUPPLY CHAIN PERFORMANCE
Nowadays, there are several approaches that have been used by researchers in measuring supply chain performance. This paper will try to review supply chain performance measurements on several case studies that have investigated such as Balanced Scorecard (BSC), Total Quality Management (TQM), Economic Value Analysis (EVA), Activity-Based Costing (ABC) and Supply Chain Operations Reference (SCOR).
studies concluded that the indicators were not suitable to be generalized in other case studies, although some extrapolations can be made [20]. In addition, the method of measuring performance using the BSC does not have a standard in business process reengineering. Therefore, this method is much more being applied to measure the performance of the overall system which includes not only strategic in the supply chain.
Total quality management was adopted by the Japan Company, which focuses on performance measurement based on quality of product and customer satisfaction. All entities within the organization will be pushed to implement continues improvement into a supply chain quality that began from design to manufacturing, then factory to retailers and to deliver to end customers [21]. Moreover, Measurement of the supply chain using TQM aims to measure, analyze and improve the goal of the business process in form products, services, and processes by creating value for customers [22]. TQM in supply chain considers its application in real life. Applying TQM and SCM seem to be clear, but the results are somehow unclear and difficult to figure out. Based on a case study in Indian cement manufacturing, it shows very weak correlation between SCM and TQM. This indicates that it has not leveraged these tools effectively and efficiently [23]. Therefore, TQM focuses on quality of product and customer satisfaction thus the difficulty in implementing this method.
There is other approaches focus on financial data, such as Economic Value Added (EVA) and Activity Based Costing (ABC). Based on a case study in packaging industry using EVA, accounting data were required in order to achieve more accurate results and contribute to measure performance within the value-based management approach. This method measure the overall financial value of supply chain performance in a company. Nevertheless, EVA should account the capital markets, which shareholders as well as investors because it is important to justify investments in supply chain management with the company value. Thus, senior executives’ base their decisions not only on financial data [24]. In other hand, ABC considers the cost driver which the method is not suitable for non-financial measurement. This technique more time consuming in collecting cost data and disruption of management decision making [25]. The strength of ABC method can determine the costs of operations and pursue the objective of providing desired customer service at the least total cost [26].
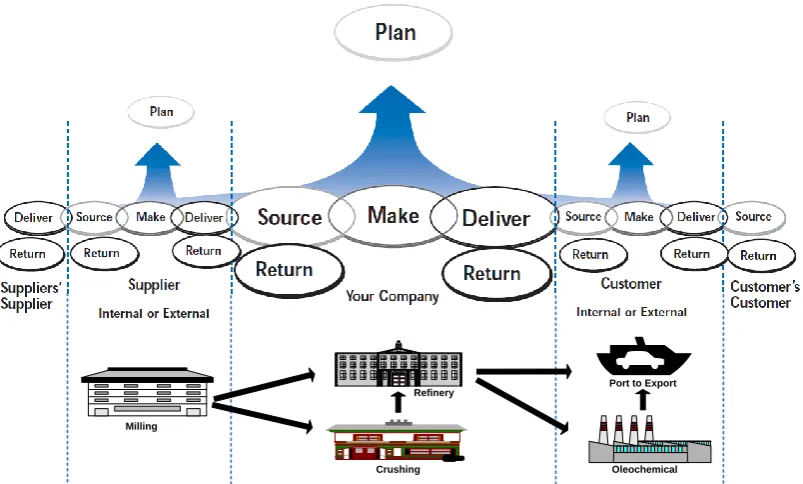
Supply Chain Operations Reference (SCOR) was built by the Supply Chain Council (SCC) as a tool to diagnose the business activities in supply chain management. This method is used to investigate the relationship between suppliers, manufacture and customers. So, this method is not suitable for use in simple business process [27]. Based on research in oil producing company in Iran, SCOR models can reengineering and improve the effectiveness of supply chain that includes business process, metrics, best practices and technology [28]. However, improving the system in measuring performance needed some suitable metrics or indicators in representing the real system. In addition, the reengineering process is based on of the stages that have standardized on Plan, Make, Source, Deliver and Return
[29]. Comparison of methods for measuring the supply chain performance is necessary to determine the appropriate method in solving the problem in the palm oil downstream industry.
IV. DISCUSSION
According to process mapping in palm oil supply chain, it shows that downstream industries involve crushings, refineries and oleochemicals. This industry has feedstock dependence of the milling process and use of port facilities to deliver the final products. Profit from the final products in downstream industries affected by the industry's ability to transform the oil into products that has high value of the goods. Currently, palm oil downstream industry export processed oil palm in developed countries. It is an open question whether the local industry in Malaysia capable of producing final products that is acceptable in the international market. It makes the business of palm oil downstream industry has become more complex. Thus, it required to propose a method to measure downstream industry based on supply chain performance. Performance measurement will be based on the relationship of business process in the downstream industry that is classified into the categories of suppliers, manufacturing and customers. Then, this relationship will be elaborate become indicators that will be measured.
All of the above methods have outlined some approaches in measuring supply chain performance based on strength and limitations in implementing into a case study. When this method is compiled in the case study in the palm oil downstream industry, there are some considerations that will be taken to measure the supply chain performance. The suitable approach to measure supply chain performance in the palm oil downstream industry is using the SCOR method. Therefore, this method can be measured when they are represented by several indicators based on activity between suppliers, manufacturer and the customer. Then, selection of indicators can be clustered into basic performance measurement. In addition, these entities have the similar process within crushing, refineries and oleochemical that include business process reengineering into the Plan, Source, Make, Deliver and Return.
Milling
Refinery
Crushing
Port to Export
[image:5.595.98.500.52.294.2]Oleochemical
Fig. 2. Application of SCOR model in palm oil downstream industry
V. CONCLUSION
This paper described supply chain in the palm oil business through process mapping from upstream to downstream. In addition, it summarizes the result of literature review on measuring supply chain performance using five existing methods. The main contribution of this paper proposes a technique for measuring supply chain performance in the palm oil downstream industry involving industry of crushings, refineries and oleochemicals. This research justifies that SCOR model more suitable to implement in this case. Therefore, SCOR model can be reengineering of business processes based on relationships among entities such as suppliers, manufacturing and customers. In addition, supply chain performance will be measured using the step as Plan, Source, Make, Deliver and Return to develop key performance indicator.
Further research will test into a case study with collecting the data that related to business process reengineering in the palm oil downstream industry. Furthermore, it would be built several indicators to measure supply chain performance into a model. Finally, the models will be validated in order to determine whether indicators represent the real case.
ACKNOWLEDGMENT
The authors thank to the Amanah Pelalawan Foundation for giving PhD Degree Scholarship Program.
REFERENCES
[1] A. Ellinger, H. Shin, W. M. Northington, F. G. Adams, D. Hofman, and K. O’Marah, “The influence of supply chain management competency on customer satisfaction and shareholder value,” Supply
Chain Manag. An Int. J., vol. 17, no. 3, pp. 249–262, 2012.
[2] S. Z. Omain, A. B. Abdul Hamid, A. R. Abdul Rahim, and N. Md Salleh, “Supply chain management practices in Malaysia palm oil industry,” in The 11th Asia Pacific Industrial Engineering and
Management Systems Conference, 2010.
[3] Malaysian Palm Oil Board, Overview of the Malaysian Oil Palm
Industry 2012. Selangor: Economics & Industry Development
Division, 2012, pp. 1–5.
[4] P. Jayaratne, “Sustainable supply and supply chain mapping - Sri Lankan tea supply chain,” in SBS HDR Student Conference, 2011, pp. 1–15.
[5] E. Alfonso, D. Ferrucho, A. Roldán, M. Vargas, and F. González, “Scenario analysis for reverse logistics implementation case study of the palm oil supply chain,” in Proceedings of the 2009 Winter
Simulation Conference, 2009, pp. 2310–2319.
[6] Z. Ismail and A. Khamis, “Neural network in modeling Malaysian oil palm yield,” Am. J. Appl. Sci., vol. 8, no. 8, pp. 796–803, 2011. [7] A. Deveshwar and R. Rathee, “Challenges for supply chain
management in today’s global competitive environment,” Int. Rev.
Bus. Res. Pap., vol. 6, no. 2, pp. 194–203, 2010.
[8] W. S. Chow, C. N. Madu, C.-H. Kuei, M. H. Lu, C. Lin, and H. Tseng, “Supply chain management in the US and Taiwan: An empirical study,” Omega, vol. 36, no. 5, pp. 665–679, Oct. 2008. [9] D. Mollenkopf and G. P. Dapiran, “World-class logistics: Australia
and New Zealand,” Int. J. Phys.Distribution Logistic Management., vol. 35, no. 1, pp. 63–74, 2005.
[10] S. Jharkharia and R. Shankar, “Supply chain management: some sectoral dissimilarities in the Indian manufacturing industry,” Supply
Chain Manag. An Int. J., vol. 11, no. 4, pp. 345–352, 2006.
[11] S. E. Fawcett, G. M. Magnan, and M. W. McCarter, “Benefits, barriers, and bridges to effective supply chain management,” Supply
Chain Manag. An Int. J., vol. 13, no. 1, pp. 35–48, 2008.
[12] A. K. A. Rahman, R. Abdullah, F. Mohd Shariff, and M. A. Simeh, “The Malaysian palm oil supply chain : the role of the independent smallholders,” Oil Plam Ind. Econ., vol. 8, no. 2, pp. 17–27, 2008. [13] O. Chavalparit, W. H. Rulkens, a. P. J. Mol, and S. Khaodhair,
“Options for environmental sustainability of the crude palm oil industry in Thailand through enhancement of industrial ecosystems,”
Environ. Dev. Sustain., vol. 8, no. 2, pp. 271–287, Mar. 2006.
[14] E. Lau, Y. Man, and A. Baharum, “A Qualitative approach of identifying major cost influencing factors in palm oil mills and the relations towards production cost of crude palm oil,” Am. J. Appl. Sci., vol. 8, no. 5, pp. 441–446, 2011.
[15] A. Belai, D. Boakye, J. Vrakas, and H. Wasswa, The Malaysian Palm
Oil Cluster. Institute for Strategy and Competitiveness, Harvard
Business School, 2011, pp. 22 – 26.
[16] G. van Duijn, “Traceability of the palm oil supply chain,” Lipid
Technol., vol. 25, no. 1, pp. 15–18, 2013.
[17] Proforest, Mapping and Understanding the UK Palm Oil Supply
Chain, April. London: Department for Environment, Food and Rural
[18] B. Bigliardi and E. Bottani, “Performance measurement in the food supply chain: a balanced scorecard approach,” J. Facility. - Emerald, vol. 28, no. 5/6, pp. 249–260, 2010.
[19] F. Jie and K. A. Parton, “Balanced scorecard for Australian cattle producers : an application,” Australas. Farm Bus. Manag. J., vol. 6, pp. 27–39, 2009.
[20] G. Prakash and R. R. Pant, “Performance measurement of a dairy supply chain : a balance scorecard perspective,” in Proceeding IEEE
IEEM conference, 2013.
[21] A. K. Sahoo, “Total Quality Management in an automobile supply chain in Indian market – A Case Study on Maruti Suzuki,” Int. J.
Supply Chain Manag., vol. 2, no. 2, pp. 99–106, 2013.
[22] J. C. Ramos, Ş. S. Asan, and J. Majetic, “Benefits of applying quality management techniques to support supply chain management,” in
International Logistics and Supply Chain Congress, 2007.
[23] R. Dubey and A. Chakrabarty, “Role of innovative supply chain practices and total quality management ( TQM ) on performance of indian cement manufacturing firms an empirical study,” Polish J.
Manag. Stud., vol. 4, 2011.
[24] E. Hofmann and a. Locker, “Value-based performance measurement in supply chains: a case study from the packaging industry,” Prod. Plan. Control, vol. 20, no. 1, pp. 68–81, Jan. 2009.
[25] B. Lin, J. Collins, and R. K. Su, “Supply chain costing: an activity-based perspective,” Int. J. Phys. Distrib. Logist. Manag., vol. 31, no. 10, pp. 702–713, 2001.
[26] T. J. Goldsby and D. J. Closs, “Using activity-based costing to reengineer the reverse logistics channel,” Int. J. Phys. Distrib. Logist.
Manag., vol. 30, no. 6, pp. 500–514, 2000.
[27] H. Taghizadeh and E. Hafezi, “The investigation of supply chain’s reliability measure: a case study,” J. Ind. Eng. Int., vol. 8, no. 1, p. 22, 2012.
[28] M. Golparvar and M. Seifbarghy, “Application of SCOR model in an oil- producing company,” J. Ind. Eng., vol. 4, pp. 59–69, 2009. [29] T. E. Erkan and U. Bac, “Supply chain performance measurement : a