Abstract— In hospitals there are several technological plants that are influencing the risk level associated to operations: one failure to this plants is able to introduce source of risks and subsequently need to be controlled. In this paper the authors analyze the role of early warning in maintenance of blood refrigerators as a way to control the risk of blood shortage using an hybrid simulation driven by FMEA/FMECA analysis. A complete case study is here presented and discussed.
Index Terms—Risk Analysis; hybrid simulation; FMEA /FMECA analysis
I. INTRODUCTION
IMULATION techniques [1-6] and Failure Mode and
Effect Analysis (FMEA/FMECA) are effective instruments to study complex systems and carry out optimization of several kinds of situations that may occur in real life. The ability to cope with complex and very articulate systems is extremely important in healthcare applications [7], such as the management of hospital facilities and their resources.
In this paper, the focus is addressed to the failure analysis of blood conservation refrigerated cells in a real Italian hospital. As known, blood bags need to be kept at low temperatures in order to keep blood properties constant in time, and for this purpose hospitals are equipped with a large number of refrigerated cells in which blood bags are stored. The failure of one or more cells represents a risky situation, since, if cell temperature rises above a certain value for a too long time, the stored blood can loose its original properties and become useless for medical purpose.
To face this problematic situation, the Authors applied the FMEA/FMECA analysis technique to the refrigeration systems, individuating the failure rate of refrigeration cells on the basis of experimental data from the field. Therefore, the study was able to individuate the failure probability of the whole refrigeration system composed by a large number of cells in parallel.
The study was then completed by the implementation of a
Manuscript received June 25, 2016; revised July 20, 2016.
L. D. Author is with the University of Genoa, Department of Mechanical Engineering, Via Opera Pia 15 16132 Genoa Italy (e-mail: [email protected]).
K. M. Author is with the University of Genoa, Department of Mechanical Engineering, Via Opera Pia 15 16132 Genoa Italy (e-mail: [email protected]).
P. G. Author is with the University of Genoa, Department of Mechanical Engineering, Via Opera Pia 15 16132 Genoa Italy (e-mail: [email protected]).
R. R. Author is with the University of Genoa, Department of Mechanical Engineering, Via Opera Pia 15 16132 Genoa Italy (Phone Number: +393339874234; e-mail: [email protected]).
simulation model, in Powersim environment, able to determine the influence that cells failures have on the amount of blood to be discarded owing to temperature threshold overcoming.
In particular, the simulation model includes the energetic balance of refrigeration cells, keeping into account the transient thermodynamic behavior of a cell subjected to reverse cycle malfunction, door incorrect closure and heat losses due to the opening and closing operations.
Particular attention must be paid to the intervention operations to be fulfilled alter a failure occurrence: of course, the first intervention to be done when a cell goes out of order shall be the displacement of blood bags into another functioning cell. In this situation, the time interval between the failure and the displacement operation is a crucial variable of the problem: the operators intervention time needs to be studied parametrically to understand how it influences the amount of blood which needs to be discarded in case of a cell failure.
Through the employ of the Powersim Studio 10™ simulation model, several simulations were worked out imposing different operator intervention time intervals; to make the study more statistically significant, for each intervention interval six simulations were carried out.
In a first phase of the study, simulations highlighted an irrelevance of the time interval influence on the blood amount lost; this result was not considered acceptable, and was imputed to the large amount of the random error resulting from simulations. To obtain acceptable results, several techniques of data variance reduction were applied, in particular the authors considered the common random number technique, which gave significant results. In this way, the best scenario was individuated, and the relationship between failure – blood displacement time interval and the amount of blood discarded was found out.
In particular, simulations highlighted a significant reduction of the blood amount discarded when reducing the intervention time from 25 minutes to 10 minutes only.
II. A MODEL FOR THE RISK EVALUATION
Blood is playing a crucial role in surgical theater and its supply must be ensured for the entire medical procedure since unexpected adverse events could drive the necessity of a massive transfusion especially for post-trauma (car accidents, gun shots, etc.) treatment and other emergency related situations. In general blood is acquired from donors, controlled and treated in order to ensure the quality and the absence of pathogens. Blood is still associated with an higher iatrogenic risk since it can be a source of extremely serious infections such as hepatitis B and C, HIV, West Nile virus, syphilis, and HTLV-I/II viruses and for that reason
A Hybrid Simulation Model for Evaluating
Risk Related to Complex Plants in Hospitals
Lorenzo Damiani, Pietro Giribone, Kais Mzoughi and Roberto Revetriahas to undergo a severe protocol in order to ensure a proper risk control and reduction. In applying such protocol an hospital must ensure proper segregation over the blood stocks since very often the same hospital is collecting the blood from donors at the same time that is using previously acquired and treated blood for the everyday surgical procedure. Considering the process of blood donation and the handling of donated blood in the United States the U.S. Food and Drug Administration (FDA) is in charge to ensure the respect of the appropriate procedures and protocols. The FDA enforces five layers of overlapping safeguards to protect the blood supply against disease.
1. Donor screening. Perspective donor must answer a series of questions about its current health, health history, any travel to countries where certain diseases are common, and behavior that increases the risk for getting certain diseases, such as drug use or unprotected sex. Donor is not allowed to donate blood if any of these screening steps suggests a problem, such as potential exposure to an infectious disease or anemia.
2. Deferred-donor lists. Organizations that collect blood must keep lists of people who are permanently prevented from giving blood. Potential donors must be checked against this list so that blood is not collected from them. The deferred-donor list includes people who have had certain types of cancer, had hepatitis after age 11, or are at high risk for HIV infection.
3. Blood testing. After donation, every unit of blood is tested for known blood transmissible diseases: if any disease is detected at this stage, the collected blood from this donor is thrown away.
4. Quarantine. Donated blood is kept isolated from other blood and cannot be used for any purpose until it passes all required tests.
5. Quality assurance. Blood centers must keep careful records of every unit of donated blood. If a problem arises involving a donated unit of blood, the blood center must notify the FDA and work with them to correct the problem.
Blood is drawn from healthy donors ages 18-65 from FDA licensed facilities and is collected into a sterile blood collection bag containing the anticoagulant of choice, in this way blood is immediately mixed with the anticoagulant during the collection process preventing separation of its components. Immediately after the drawn whole blood undergoes viral testing and is stored segregated at 4 degrees C. As is possible to see FDA rules enforce the segregation of blood stocks as a part of the entire blood safety protocol however blood has an extremely perishable nature and must be kept within a very narrow temperature limit (2.5-5.5 degrees C.).
Since many blood groups exist (AB0 with Rh+/-) and potential fatal consequences arise from transfusing the wrong blood to a patient the blood inventory is kept in several blood refrigerator units that featuring the correct temperature control and monitoring devices with high and low temperature alarms plus temperature logging features in order to ensure that blood can be stored and monitored safely. Generally these refrigerators have a small storage capacity each that is not greater than 150-200 dm3. This
decision is generally related to the primary target of
ensuring segregation rather that provide an optimal way to ensure the overall reliability to the blood inventory system. These refrigerators, in fact, are generally independent and stand-alone units, some time they share the same condensation station but in general the made up a very heterogeneous and hard to manage collection of different models, brand and, even, technologies (i.e. different refrigerating gases, different spare parts, etc.). Maintenance of a blood inventory system could be extremely difficult since it has very strict requirements associated with a very complicated set of different refrigerating devices.
In order to build a credible reliable model for the above described system the Authors collected the overall failure and malfunction records over three years (2012-2015) of a real hospital in Greater Milan (Italy) that has 231 refrigerated storages divided in 13 different departments over a total area of more that 300,000 m2. The overall
failures, malfunctions record were evaluated in order to identify possible common failure modes by applying FMEA/FMECA methodology. In the proposed approach the event records were classified according the refrigerator type (brand/model), location, and failure mode. Events were classified in either these 4 main categories:
• major events: that made the refrigerator unusable for a certain period (i.e. blackouts, blood bag leakage, etc.)
• component breakdowns: components failures (i.e. thermometer, laminating valve, compressor, etc.) that prevent the refrigerator to work correctly
• routine maintenance: cleaning, refrigerating gas refill, etc.
• refrigerator changeover: condition that is met when an old refrigeration has to be substituted by a new one. III. EVALUATION OF THE CELL HEAT EXCHANGE BEHAVIOR
To evaluate the risk of blood properties deterioration owing to temperature threshold overcoming when a refrigerator cell goes out of order, the transient thermal behavior of the cell system needs to be studied by means of an appropriate mathematical model. In fact, in case of reverse cycle failure the cell internal temperature is expected to increase up to the external environment temperature in a time which depends on the thermal power exchanged between the environment and the internal of the cell itself.
What the authors want to evaluate with this study is the time interval during which the cell temperature keeps below a safety threshold value, which ensures the correct conservation of the blood bags.
To evaluate the thermal behavior of the cell during transient conditions the losses due to thermal exchange with the environment are calculated for the medical cold room containing blood. Thermal exchange with the environment is due to:
• Dispersion through the walls;
• Doors openings;
• Imperfect door closure.
The dispersion through the walls is calculated by the classical formula of thermal flow propagation:
𝑞̇
=
𝐾𝑆
(
𝑇
𝑒𝑥𝑡− 𝑇
𝑖𝑛𝑡)
(1)Text and Tint are respectively the external and the internal temperature values.
The transmittance can be calculated by means of the following formula:
𝐾
=
1
1
ℎ
𝑒+
𝑠
𝑘
+ 1
ℎ
𝑖(2)
Where he is the external liminar coefficient of thermal exchange, hi is the internal liminar coefficient of thermal exchange, s is the walls thickness and k is the walls thermal conductivity.
The dispersion thermal flow due to doors opening can be calculated as a function of the temperature difference between external and internal environment:
𝑞
̇
=
𝑘
1𝑆
(
𝑇
𝑒𝑥𝑡− 𝑇
𝑖𝑛𝑡)
(3)Where k1 is a coefficient which, after several empirical tests, has been set to 1.882, while S is the door surface.
The dispersion for mis-opening, which provides a continuous flow of cold air from the cell to the environment, can be calculated by means of another formula similar to the previous one; in this case, however, the exchange surface is no more that of the fully open door, but the surface of the chink that forms for mis-closure.
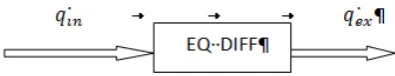
The system under examination is a thermal environment subjected to a transient behavior. The authors are interested in the internal temperature variation of the cell in function of time, therefore a differential equation shall be employed:
𝑞𝚤𝑛̇ − 𝑞𝑒𝑥̇ = Mcp dT/dt (1)
[image:3.595.315.522.48.209.2]Where the first member represents the sum of the thermal flows entering and exiting from the cell, M is the mass of air inside the cell and T is the internal cell temperature. The differential equation regarding the transient behavior of the cell can be conventionally represented by the scheme in Figure 1.
Fig. 1. Scheme of the differential equation for transient thermal behavior of the cell.
These equations have been implemented in the Powersim software; an image of the Powersim model blocks is provided in the following, in which all the thermal exchange equations have been introduced. The scheme of the complete Powersim model is visible in Figure 2.
Fig. 2. Scheme of the Powersim model implemented for the refrigerator cells under exam.
IV. HYBRID SIMULATION MODEL
Building a credible simulation model for the proposed case study requires the ability to balance both continuous process such as the thermal exchange and discrete events process as for the breakdown and subsequent repair model. Many of the simulation package today available are mostly designed for supporting manufacturing [5] process or highly automated plants and building hybrid simulation is sometime difficult requiring often some workaround and hard coding of differential equations solver inside of the simulation environment. The authors [7] successfully designed and tested an innovative approach to hybrid simulation [3] that rely on System Dynamics formalism in order to build a robust hybrid simulator. System Dynamics is naturally based on differential equations but its formalism is very easy to read and understand allowing the possibility to create sophisticate models while retaining a great level of code maintainability. Equations are than build graphically using the stock/flow diagram making verification and validation phase very straightforward. In order to build the discrete events part of the model System Dynamics could be used to build an event-chain model where the status of the plant is represented by a set of status modelled by levels and the state-to-state transitions modeled using flows. Several application of such methodology have been successfully tested [4][10] including in healthcare [12][13][14][15].
The overall simulation model was divided in three major sections: thermal balance module, reliability model, maintenance model. The first section, presented in figure 2, was designed to implement the thermal balance of the refrigerated storage including the insulation capability, the refrigerator plant and the door opening pattern. Since the vast majority of the heat exchange took place when the nurse takes a blood bag from the refrigerated storage the opening cause a major intake of hot air from the environment resulting in an increase of the temperature that must be reduced by the refrigeration plant. This effect is mainly due to the fact that the size of the refrigerated storage is usually very small and thus the quantity of hot air that is enter through the door is comparable with the overall volume of the refrigerated storage.
[image:3.595.54.252.569.607.2]campaign using the FMEA/FMECA methodology [11].
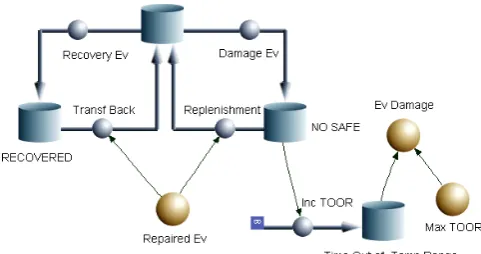
Fig 3. Events Chain: part of the model devoted to implement breakdown/repair events, slider is used for choosing scenario variable values.
In this model two major states have been modeled: working condition and failure condition, the state transition from the first to the second is derived using Monte Carlo simulation assuming the failure rate previously identified and a frequency histogram for the MTTR involved in the simulated failure event. Third section of the model, presented in figure 4, is modeling the maintenance process, the rising of the temperature triggers the intervention of a maintenance task force that after a certain time is able to reach the refrigerated storage and transfer the blood bag into another refrigerated storage allowing the respect of the cold chain if still in time. The status of the system is here modeled among three major states: safe, unsafe and recovered.
Fig.4. Section that is responsible for hybrid modeling of the recovery operations of blood bags when a refrigerated storage is in breakdown.
Safe is the normal condition, unsafe is the refrigerator when its cooling plant is stopped and recovered is when all the content of the refrigerated storage has been transferred into a working and cooling storage. In this section the transition is merely driven by procedure and based on elapsed time. The simulation model is recording the total number of time in which the blood bags have to be thrown away since the safe storage condition could no longer be guarantee in correspondence of an event of failure. During the experimental campaign various scenarios were considered for the minimum time passing between the refrigerated storage failure and the alert given to the
maintenance task force based on the level of integration among procedures.
V. EXPERIMENTAL CAMPAIGN
The simulation model has been carefully implemented and validated in comparison with the real data coming from a three years data collection campaign. The first experimental campaign was conducted varying the time expected for the intervention of the recovery team whose responsibility is to transfer the blood bags from the failed refrigerated store to a working one. This time is, in fact, influenced in many ways since it is the result of several sub-process:
• Warning time:
•
time incurred from the moment the breakdown is happening and the moment when this event is notified to maintenance team. This is generally function of self diagnosis capability of the refrigerated storage.
Logistic time:
•
time incurred from the moment in which the alarm is recorded and the arriving of the emergence/repair team to the refrigerated storage. This is generally influenced by the maintenance organization (i.e. global service, in-house maintenance, vendor support, etc.). Intervention time:
On the implemented model the logistic repair time were modeled using uniform distributions and Monte Carlo methodology while the warning time was considered as a scenario parameter and set to the following 4 values:
time occurring from the moment in which the emergency/repair team is arrived and the end of the repair process. This time also included the recovery process if still possible. This time is influenced buy the severity of the failure and by the availability of a spare refrigerated storage able to receive the blood bags while still retain intact the segregation procedures.
• Scenario A:
•
10 min (self diagnosis and machine-to-machine alarm workflow)
Scenario B:
•
25 min (self diagnosis and e-mail based alarm workflow)
Scenario C:
•
35 min (self diagnosis and human activated alarm workflow)
Scenario D:
The simulation was replicated 6 times over an time horizon of one simulated year with a base time unit for integration of 1 min, differential equations were integrated using standard first order Runge-Kutta method.
50 min (human surveillance and alarm workflow).
[image:4.595.48.289.478.605.2]campaign, just confirmed this assumption.
TABLE I. PRELIMINARY SIMULATIONS RESULTS SHOWING HIGH RANDOMNESS THAT ARE BLURRYING THE VARIOUS POLICIES EFFECTS.
Scenario Run
#1 Run #2 Run #3 Run #4 Run #5 Run #6
10 min (A) 15 10 11 8 13 14
25 min (B) 19 22 11 9 13 12
35 min (C) 8 11 17 13 24 15
50 min (D) 17 28 11 22 10 23
Applying ANOVA, as in table II, over the simulation runs it was possible not to reject the hypothesis H0 concluding
that there is no evidence of statistical difference among the various scenarios since the F0 was below the tabbed F0.05,20,3
= 3,10. This results have to be investigated more deeply since the possibility to control deeply the simulation experiment offers more advantages over controlling the randomness compared to real life data. A variance reduction technique was then used to enhance the understanding of this system.
TABLE II. ANOVA TABLE OF THE PRELIMINARY SIMULATION RUNS OVER THE SELECTED SCENARIOS.
Source of
variation Variation DoF SS Fo
Scenarios 136.33 (a-1) = 3 45.44
1.84
Error 569.00 (N-a) = 20
Total 705.33 (N-1) = 23 24.74
VI. VARIANCE REDUCTION TECHNIQUE
Associated with an estimate of a performance measure (i.e., mean time in the emergency room for a patient) the variance is a measure of the amount of uncertainty in an estimate since the smaller the variance, the less the uncertainty and thus the easier it is to distinguish between/among (i.e., rank, or select the best) alternative policies. In the present application the measured variance is quite big and makes the evaluation of the effectiveness of the various policies very difficult. Several variance reduction technique (VRT) exist and could be adopted, in particular:
• Common Random Numbers (CRN).
• Antithetic Variates (AV).
• Control Variates (CV).
• Others: Indirect Estimation, MSpE [2][8][9]. For the purpose of tis application the CRN technique was chosen. Let Xij be the observation for the j-th replication of
the i-th alternative (i=1, 2; j=1, 2, ..., n).
If the two sets of replications are done independently, then Cov(X1j, X2j)=0, but if positive correlation is induced
TABLE III. SIMULATION RESULTS WITH CRN.
Run 10 min (A) 25 min (B) 35 min (C) 50 min (D)
Seed # 1 12 12 14 16
Seed # 2 10 14 22 18
Seed # 3 12 12 15 19
Seed # 4 12 13 24 15
Seed # 5 7 12 5 14
Seed # 6 10 15 11 22
with CRN, then Cov(X1j, X2j) >0.
This positive correlation is introduced by synchronizing the random number generation seeds over the various scenarios in this case the various policies will experiment the same random events so it will be possible to extract the role of the policy in the result building process.
Adopting CRN is modifying the way in which results will be evaluated since instead of comparing the single scenarios it will be necessary to compare scenario in pairs by building confidence interval for the difference of the results. For the purpose of this analysis a modified table of results was built, for each pair of scenario the H0 is rejected
if the corresponding confidence interval is excluding the 0 and consequently H1 is accepted.
By looking at this table is possible to identify three pairs
TABLE IV. COMPARISON OF THE RESULTS IN PAIR ADOPTING THE CRN.
B C D
A-B -4.43
A+B -0.57
A-C -9.36
A+C 0.03
A-D -9.36
A+D -4.30
B-C -7.60
B+C 3.27
B-D -6.12
B+D -2.55
C-D -8.22
C+D 3.88
that reject H0 and thus are showing a statistical impact
VII. CONCLUSION
The proposed methodology demonstrates that simulation is very effective in evaluating risk scenario since in highly randomness affected systems the effect of the various policies are hard to be separated by the random noise while simulation is able to better control the source of such randomness. This methodology proved to be robust enough to be used in a randomness severely affected example with good results. The adopted simulation technique demonstrated to be very effective in modeling complex system where different phenomena requires continuous and discrete simulation at the same time. Proposed methodology could be extended easily to other domain as proven in the cited references.
ACKNOWLEDGMENT
Authors are thankful to Unplugged/MainSim company people that graciously provided real data that are the base of the example presented in this paper.
REFERENCES
[1] L. Damiani, A. Pini Prato, Simulation of a Power Regulation System for Steam Power Plants, Energy Procedia, 45 (2014) pp. 1185-1194. [2] L. Cassettari, R. Mosca, R. Revetria, Monte Carlo Simulation Models
Evolving in Replicated Runs: A Methodology to Choose the Optimal Experimental Sample Size, Mathematical Problems in Engineering (2012)1024123X.
[3] J. Dellachà, L. Damiani, M. Repetto, A. Pini Prato, Dynamic Model for the Energetic Optimization of Turbocompound Hybrid Powertrains, Energy Procedia 45 ( 2014 ) 1047 – 1056.
[4] E. Briano.; C. Caballini; P. Giribone; R. Revetria, Design of experiment and montecarlo simulation as support for gas turbine power plant availabilty estimation, 12th WSEAS International Conference on Automatic Control; Modelling and Simulation; ACMOS '10 (2010).
[5] E. Briano; C. Caballini; R. Mosca; R. Revetria, Using WITNESS simulation software as a validation tool for an industrial plant layout, International conference on System Science and Simulation in Engineering – Proceedings, 1792507X.
[6] L.Damiani, A.Pini Prato, Simulation model of a passive decay heat removal system for lead-cooled fast reactors, J. Eng. Gas Turbines Power 137(3), 2014.
[7] Cassettari, L., Mosca, R.,Revetria, R., Experimental error measurement in monte carlo simulation, Handbook of Research on Discrete Event Simulation Environments: Technologies and Applications, pp. 92-142.
[8] Bendato, I., Cassettari, L., Giribone, P.G., Mosca, R. Monte carlo method for pricing complex financial derivatives: An innovative approach to the control of convergence(2015) Applied Mathematical Sciences, 9 (124), pp. 6167-6188.
[9] I. Bendato, L. Cassettari, F. Rolando, M. Mosca, R. Mosca, Stochastic techno-economic assessment based on a Monte Carlo simulation and the response surface methodology: The case of an innovative linear Fresnel CSP system, Energy, (2016) Energy, 101, pp. 309–324. [10] Damiani L., Giribone P., Guizzi G., Revetria R., Romano E.,
Different approaches for studying interruptible industrial processes: Application of two different simulation techniques, Handbook of Research on Computational Simulation and Modeling in Engineering, 2015.
[11] Damiani L., Giribone P., Revetria R., Testa A., An innovative model for supporting FMEA/FMECA analysis on complex coal fired power plants, Proceedings of the IASTED International Conference on Modelling, Identification and Control, 2014.
[12] Cassettari L., Mosca R., Orfeo A., Revetria R., Rolando F., Morrison J.B., A system dynamics study of an emergency department impact on the management of hospital's surgery activities, SIMULTECH 2013 - Proceedings of the 3rd International Conference on Simulation and Modeling Methodologies, Technologies and Applications, 2013. [13] Improta G., Triassi M., Guizzi G., Santillo L.C., Revetria R., Catania
A., Cassettari L., An innovative contribution to health technology assessment, Studies in Computational Intelligence 431, 2012.
[14] Chiocca D., Guizzi G., Murino T., Revetria R., Romano E., A methodology for supporting lean healthcare, Studies in Computational Intelligence 431, 2012.