Original Article
FAT2 is a novel independent prognostic factor for the
poor prognosis of gastric carcinoma
Li Li1,3, Luo-Qin Fu1,3, Hui-Ju Wang1,3, Zhi-Long Yan4, Xiu-Chong Yu4, Yuan-Yu Wang2,3
1Clinical Research Institute, 2Department of Gastrointestinal and Pancreatic Surgery, Zhejiang Provincial People’s Hospital, People’s Hospital of Hangzhou Medical College, Hangzhou, Zhejiang, China; 3Key Laboratory of Gas-troenterology of Zhejiang Province, Hangzhou, Zhejiang, China; 4Department of Gastrointestinal Surgery, Ningbo First Hospital, Ningbo, Zhejiang, China
Received July 26, 2017; Accepted October 17, 2017; Epub December 1, 2017; Published December 15, 2017
Abstract: Background: This study investigated the clinical implication of FAT2 in the progression, metastasis, and prognosis of gastric cancer. Methods: The expression of FAT2 in 436 clinicopathologically characterized gastric cancer cases and 92 control human non-tumor mucosa were analyzed by immunohistochemistry. Consequently, survival analysis was conducted to investigate the association of FAT2 expression and the development of gastric cancers. Results: FAT2 protein was found highly expressed in 90 of 92 (97.83%) control human non-tumor mucosa, while was highly expressed in 126 of 436 (28.90%) tumors samples and low in 310 of 436 (72.10%). The
expres-sion of FAT2 was associated with age, tumor size, depth of invaexpres-sion, Lauren’s classification, lymph node and dis -tant metastases, regional lymph node stage, TNM stage, and prognosis. In particular, for stage I, II, and III tumors patients the 5-year survival rate was lower in those with high expression of FAT2 than those with low expression. In
stage IV tumors, the expression of FAT2 was not associated with the 5-year survival rate. Lauren’s classification and
distant metastases, TNM stage, and expression of FAT2 were independent prognostic factors in the patients with gastric cancer, as revealed by Cox regression analysis. Conclusion: The expression of FAT2 in gastric cancer was
significantly associated with lymph node and distant metastases, and poor prognosis. FAT2 was also associated with the collective invasion and influenced the prognosis of those patients.
Keywords: gastric cancer, FAT2, metastases, prognosis
Introduction
Cancer is one of the leading causes of death in the world, and represents a tremendous bur-den on patients, families, and societies. As the second and third leading cancer in men and in women, respectively, stomach cancer mortality is over all the second leading in both sexes in China [1]. Though the development of surgery and adjuvant chemotherapies has improved, the prognosis for gastric cancer remains poor. A majority of patients with advanced cancer die of, not by the primary tumor, but complications caused by metastases. The transition from epi-thelial to migratory polarity may be a hallmark of cancer progression to an invasive and meta-static disease. Altered functions of polarity determinants lead to disrupted cell-cell adhe-sions, cytoskeleton rearrangements, and over-all loss of epithelial homeostasis. Polarity
pro-teins are engaged in diverse interactions and help cancer cells to adopt different invasion modes. Invading cancer cells can employ either the collective, mesenchymal, or amoeboid inva-sion modes, or actively switch between them, and gain intermediate phenotypes. Elucidation of the role of polarity proteins during these inva-sion modes and the associated transitions is a necessary step towards the understanding of metastasis [2].
FAT atypical cadherin 2 (FAT2) belongs to the human FAT gene family that consists of FAT1,
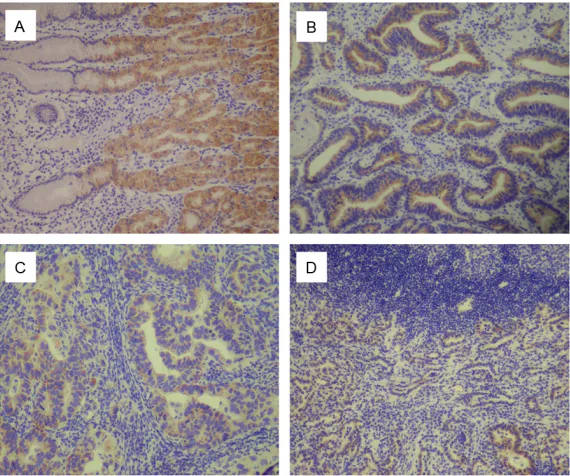
Figure 1. Immunohistochemical staining for FAT2 in gastric cancer lesions and noncancerous tissues. A: FAT2 was highly expressed in noncancerous
tissues, magnification ×100. B: FAT2 was highly expressed in moderately differentiated adenocarcinoma, magnification ×100. C: FAT2 was highly ex
-pressed in moderately differentiated adenocarcinoma, magnification ×100.
D: FAT2 was highly expressed in poorly differentiated adenocarcinoma,
mag-nification ×100.
People’s Hospital, Hangzhou, China, from January 1998 to January 2004. Tissues had been formalin-fixed, paraffin-embedded, and diagnosed clinically and histopathologi-cally at the Departments of gastrointestinal Surgery and Pathology. All these patients had follow-up records for > 5 years, with the follow-up deadline of December 2008. The survival time was calcu-lated from the date of surgery to the follow-up deadline or the date of death, which was caused mainly by carcinoma recurrence or metastasis. As negative controls, ninety-two non-cancerous human gastric tissues were obtained from gastrectomy of adjacent gas-tric cancer margins, which were > 5 cm in size. Routine chemotherapy was given to the patients with advanced-stage disease after operation, but no radiation treatment infant brain, cerebellum, gastric cancer,
colorectal cancer [11], pancreatic cancer, ovarian cancer, esophageal cancer, skin squamous cell carcinoma, head, and neck cancer [12]. Depletion of FAT2 with shRNA promoted esophageal squamous cell car- cinoma growth in vivo [13]. ΔNp63α promotes basal-like breast cancer (BLBC) and lung squamous cell carcinoma motility by inducing the expression of the atypical cadherin FAT2. FAT2 is highly expressed in breast cancer and lung squamous cell carcinoma and the elevated expression of FAT2 is correlated with poor patient outcome [14]. given the limited number of cases reported, in this study we explored the role of FAT2 in gastric cancer invasion, metastasis, and prognosis.
Materials and methods
Archived gastric cancer samples and non-tumor mucosa
gastric cancer tissues were collected from gas-trectomy specimens from 436 patients from the Department of Surgery, Zhejiang Provincial
was administered to any of the patients includ-ed in our study. The Review Board of Hospital Ethics Committee approved the study, and the informed consent from each participant was obtained before data collection.
Immunohistochemistry and evaluation of results
propor-Table 1. Relationship of FAT2 expression with pathological param-eters of gC
Clinical parameters FAT2
Low High t/χ2 P
Age (yrs) 58.24±12.08 61.04±12.04 -2.194 0.029
gender 1.298 0.255
Male 226 (72.7%) 85 (27.3%) Female 84 (67.2%) 41 (32.8%)
Location 4.703 0.095
Proximal 38 (69.1%) 17 (30.9%) Middle 107 (65.6%) 56 (34.4%) Distal 165 (75.7%) 53 (24.3%)
Size 14.889 < 0.01
< 5 cm 200 (78.1%) 56 (21.9%)
≥ 5 cm 110 (61.1%) 70 (38.9%)
Lauren classification 92.260 < 0.01
Intestinal 204 (91.5%) 19 (8.5%) Diffuse 106 (49.8%) 107 (50.2%)
Histology classification 1.115 0.773
Papillary adenocarcinoma 11 (68.8%) 5 (31.2%) Tubular adenocarcinoma 236 (72.4%) 90 (27.6%) Mucinous adenocarcinoma 19 (65.5%) 10 (34.5%) Signet-ring cell carcinoma 44 (67.7%) 21 (32.3%)
Histologic differentiation 5.155 0.161 Well 12 (92.3%) 1 (7.7%)
Moderately 95 (74.2%) 33 (25.8%) Poorly 201 (68.6%) 92 (31.4%) Others 2 (100.0%) 0 (0.0%)
Invasion depth 40.029 < 0.01
T1 52 (91.2%) 5 (8.8%)
T2 93 (85.3%) 16 (14.7%) T3 154 (63.1%) 90 (36.9%) T4 11 (42.3%) 15 (57.7%)
Lymphatic metastasis 61.263 < 0.01 No 154 (92.8%) 12 (7.2%)
Yes 156 (57.8%) 114 (42.2%)
Regional lymph nodes 87.333 < 0.01 PN0 154 (92.8%) 12 (7.2%)
PN1 95 (69.9%) 41 (30.1%) PN2 51 (51.5%) 48 (48.5%) PN3 10 (28.6%) 25 (71.4%)
Distant metastasis 21.918 < 0.01
No 282 (75.2%) 93 (24.8%) Yes 28 (45.9%) 33 (54.1%)
TNM Stages 95.703 < 0.01
I 86 (95.6%) 4 (4.4%)
II 95 (91.3%) 9 (8.7%)
III 103 (59.5%) 70 (40.5%) IV 26 (37.7%) 43 (62.3%)
tion of positive tumour cells and the staining inten-sity score. Using this as- sessment, FAT2 expression in benign gastric epithelia and malignant lesions was evaluated by the staining index with the scores of 0, 1, 2, 3, 4, 6, or 9. A staining index score of ≥ 4 was defined as high FAT2 ex- pression, and otherwise low expression.
Statistical analysis
All statistical analyses we- re performed using SPSS 19.0 software (Chicago, IL, USA). Upon the type of the data, Student’s t test, for continuous, or χ2 or Fisher exact test, for categorical data, was employed for the statistical analyses. Surviv- al curves were estimated using the Kaplan-Meier method, and the log-rank test was used to calculate differences between the curves. Multivariate analy-sis using the Cox propor-tional hazards regression model was performed to assess the prognostic val-ues of the protein expres-sion. Statistical signifi-cance was set at P < 0.05.
Results
Expression of FAT2 in gas-tric cancer and non-tumor mucosa
[image:3.612.93.404.95.719.2]was localized mainly in the cytoplasm or nucle-us of cancer cells (Figure 1).
Relation between the expression of FAT2 and clinical features of gastric cancer
The expression of FAT2 was significantly corre-lated with age, tumor size, depth of invasion, Lauren’s classification, lymph node and distant metastases, regional lymph node stage and TNM stage (P < 0.05) (Table 1). The expression of FAT2 did not significantly correlate with sex, tumor location, differentiation, or histological classification (P > 0.05) (Table 1). The ex-
pression rate of FAT2 was gradually increased with the progression of tumor.
Correlation between FAT2 expression and patient prognosis
[image:4.612.92.286.71.211.2]Cumulative 5-year survival rates for patients with low FAT2 expression were significantly higher than in patients with high FAT2 expres-sion (Figure 1). We further analyzed the correla-tion between FAT2 expression and patient prog-nosis by Kaplan-Meier curves with univariate analyses (log-rank) according to TNM stage. In
[image:4.612.324.519.73.227.2]Figure 3. Kaplan-Meier curves with univariate analy-ses (log-rank) for patients with low FAT2 expression versus high FAT2 expression tumors in stage I and stage II. The cumulative 5-y survival rate was 75.7% in the low FAT2 protein expression group but was only 52.4% in the high expression group (P < 0.01).
Figure 4. Kaplan-Meier curves with univariate analy-ses (log-rank) for patients with low FAT2 expression versus high FAT2 expression tumors in stage III. The cumulative 5-y survival rate was 23.3% in the low FAT2 protein expression group but was only 14.3% in the high expression group (P < 0.01).
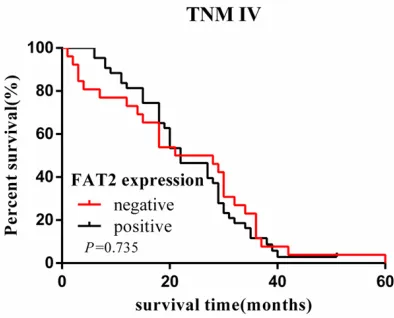
[image:4.612.91.284.304.461.2]Figure 5. Kaplan-Meier curves with univariate analy-ses (log-rank) for patients with low FAT2 expression versus high FAT2 expression tumors in stage IV. The cumulative 5-y survival rate was 4.7% in the low FAT2 protein expression group but was only 0 in the high expression group (P = 0.735).
[image:4.612.324.521.318.477.2]ing egg elongation [19]. FAT2 may govern pla-nar cell polarity (PCP) and Hpo signaling in arachnoid cells [20]. Fat2 acts at an early stage to translate plus-end bias into coordinated actin-mediated collective cell migration [21]. FAT2 has played an important role in the molec-ular pathogenesis of (Esophageal squamous cell carcinoma) ESCC In vitro and in vivo. Human FAT2 is localized at immature adherens junc-tions in epidermal keratinocytes, and the knockdown of human FAT2 by siRNA in- hibited the migration of the cultured HSC-1 human SCC cell line [22]. Furthermore, Lin et al reported that depletion of FAT2 with shR- NA promoted ESCC growth in vivo, and 31/113 (27%) esophageal squamous cell carcino- ma had mutations in FAT1, FAT2, FAT3 or FAT4
[13, 14]. There are few studies about tumor, so, we analyzed the relationships between FAT2 expression and the clinicopathological ch- aracteristics of patients with gastric cancer, and explored the role of FAT2 in gastric can- cer invasion, metastasis and prognosis. The current study revealed that positive expres- sion of FAT2 correlated with age, tumor si- ze, depth of invasion, Lauren’s classifica- tion, lymph node and distant metastases, regional lymph node stage and TNM stage. FAT2 was highly expressed in breast cancer and lung squamous cell carcinoma and the expression of FAT2 correlated with poor prog-nosis of patients [23]. Our results are con- sistent with the literature, the expres- sion rate of FAT2 protein was about 30%. AJCC/ UICC TNM staging system is the most co- mmonly used scheme to predict progno- sis in oncologic patients [24]. We also ana- lyzed the relationship between expres- sion of FAT2 and prognosis of patients ac- cording to TNM stage. In stage I, II, and III tumors, the 5-year survival rate in patients with high expression of FAT2 was significant- ly lower than that in patients with low ex- pression.
stage I, II, and III, the patients with high expres-sion of FAT2 had significantly lower 5-year sur-vival rate than those with low expression (P < 0.05) (Figures 2-4). In stage IV, the expression of FAT2 was not correlated with the 5-year sur-vival rate (P > 0.05) (Figure 5).
Multivariate analysis of clinicopathological parameters and prognosis
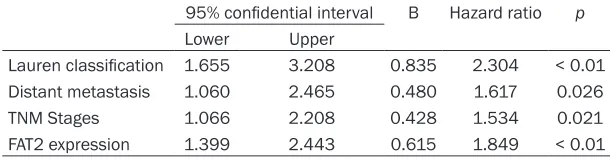
The factors with possible prognostic effects in gastric carcinoma were analyzed by Cox regres-sion analysis (Table 2). The study revealed that Lauren’s classification (P = 0.0001), distant metastases (P = 0.026), TNM stage (P = 0.021), and expression of FAT2 (P = 0.0001) were inde-pendent prognostic factors in the patients with gastric cancer. However, age, sex, tumor loca-tion and size, histological classificaloca-tion, tumor differentiation, invasion depth, and regional lymph node stage did not play significant roles in prognosis.
Discussion
[image:5.612.89.394.86.166.2]Over the past decade, the majority studies have focused on FAT1 and FAT4, FAT1 was found to regulate cell migration and growth through specific protein-protein interactions of its cytoplasmic tail. In contrast, FAT4 has been shown to regulate the planar cell polarity path-way, the Hippo signaling pathpath-way, the canonical Wnt signaling cascade, and the expression of YAP1, FAT2 and FAT3 are relatively less studied [16]. Wu et al reported complete coding sequence of FAT2 in 2000, which is closely related to FAT1 and was mapped to a region in human chromosome 5q33.1, encoding a 14.5-kbp mRNA transcript with an open reading frame of 4,349 amino acids [17]. The literature reported Fat2 may promote cell migration through mediating planar cell polarity and cell rotation. Viktorinova’ study suggest a feedback amplification mechanism between Fat2 local-ization and microtubule polarity involved in
Table 2. Multivariate analysis as determined by Cox regression analysis 95% confidential interval B Hazard ratio p
Lower Upper
Lauren classification 1.655 3.208 0.835 2.304 < 0.01 Distant metastasis 1.060 2.465 0.480 1.617 0.026 TNM Stages 1.066 2.208 0.428 1.534 0.021 FAT2 expression 1.399 2.443 0.615 1.849 < 0.01
dur-However, the presence of mutations and alterations in protein expression strongly suggest that FAT2 may associate with invasiveness of cancer, but the precise role of FAT2 genes in cancer still remains inconclu- sive and needs further characterization. We will further investigate the specific mechanism of FAT2 in the development and progression of cancer, and FAT2 may be a new regulator of collective invasion and influencing the pro- gnosis of patient.
Acknowledgements
This work was supported by Zhejiang Pro- vincial Medical Science Research Foundation (2016KYA017 to YYW and 2016KYA163 to ZLY), National Natural Science Foundation of China (81602174 to HJW), Zhejiang Provinci- al Natural Science Foundation of China (LY16H160042 to HJW).
Disclosure of conflict of interest
None.
Address correspondence to: Dr. Yuan-Yu Wang, Department of gastrointestinal and Pancreatic Surgery, Zhejiang Provincial People’s Hospital, People’s Hospital of Hangzhou Medical College, Hangzhou, Zhejiang, China; Key Laboratory of gastroenterology of Zhejiang Province, Hangzhou, Zhejiang, China. Tel: 571-85893486; Fax: +86-571-85131448; E-mail: lywyy1979@126.com
References
[1] Chen W, Zheng R, Baade PD, Zhang S, Zeng H, Bray F, Jemal A, Yu XQ, He J. Cancer statistics in China, 2015. CA Cancer J Clin 2016; 66: 115-132.
[2] Gandalovičová A, Vomastek T, Rosel D, Brábek
J. Cell polarity signaling in the plasticity of can-cer cell invasiveness. Oncotarget 2016; 7: 25022-25049.
[3] Dunne J, Hanby AM, Poulsom R, Jones TA, Sheer D, Chin Wg, Da SM, Zhao Q, Beverley PC, Owen MJ. Molecular cloning and tissue expres-sion of FAT, the human homologue of the Dro-sophila fat gene that is located on chromo-some 4q34-q35 and encodes a putative adhesion molecule. genomics 1995; 30: 207-23.
[4] Wu Q, Maniatis T. Large exons encoding multi-ple ectodomains are a characteristic feature of protocadherin genes. Proc Natl Acad Sci U S A 2000; 97: 3124-9.
[5] Hoeng JC, Ivanov NV, Hodor P, Xia M, Wei N, Blevins R, gerhold D, Borodovsky M, Liu Y.
Identification of new human cadherin genes
using a combination of protein motif search
and gene finding methods. J Mol Biol 2004;
337: 307-17.
[6] Matsui S, Utani A, Takahashi K, Mukoyama Y, Miyachi Y, Matsuyoshi N. Human Fat2 is local-ized at immature adherens junctions in epider-mal keratinocytes. J Dermatol Sci 2007; 48: 233-6.
[7] Katoh Y, Katoh M. Comparative integromics on FAT1, FAT2, FAT3 and FAT4. Int J Mol Med 2006; 18: 523-528.
[8] Viktorinová I, König T, Schlichting K, Dahmann
C. The cadherin Fat2 is required for planar cell polarity in the Drosophila ovary. Development 2009; 136: 4123-4132.
[9] Sharma P, McNeill H. Fat and Dachsous cad-herins. Prog Mol Biol Transl Sci 2013; 116: 215-235.
[10] Sadeqzadeh E, de Bock CE, Thorne RF. Sleep-ing giants: emergSleep-ing roles for the fat cadherins in health and disease. Med Res Rev 2014; 34: 190-221.
[11] Xie T, Cho YB, Wang K, Huang D, Hong HK, Choi YL, Ko YH, Nam DH, Jin J, Yang H, Fernandez J, Deng S, Rejto PA, Lee WY, Mao M. Patterns of somatic alterations between matched primary and metastatic colorectal tumors character-ized by whole-genome sequencing. genomics 2014; 104: 234-241.
[12] Katoh Y, Katoh M. Comparative integromics on FAT1, FAT2, FAT3 and FAT4. Int J Mol Med 2006; 18: 523-8.
[13] Lin DC, Hao JJ, Nagata Y, Xu L, Shang L, Meng X, Sato Y, Okuno Y, Varela AM, Ding LW, garg M, Liu LZ, Yang H, Yin D, Shi ZZ, Jiang YY, gu WY, gong T, Zhang Y, Xu X, Kalid O, Shacham S,
Ogawa S, Wang MR, Koeffler HP. Genomic and
molecular characterization of esophageal squamous cell carcinoma. Nat genet 2014; 46: 467-73.
[14] Dang TT, Westcott JM, Maine EA, Kanchwala
M, Xing C, Pearson GW. ΔNp63α induces the
expression of FAT2 and Slug to promote tumor invasion. Oncotarget 2016; 7: 28592-28611. [15] Zhao ZS, Wang YY, Chu YQ, Ye ZY, Tao HQ.
SPARC is associated with gastric cancer pro-gression and poor survival of patients. Clin Cancer Res 2010; 16: 260-268.
[16] Sadeqzadeh E, de Bock CE, Thorne RF. Sleep-ing giants: emergSleep-ing roles for the fat cadherins in health and disease. Med Res Rev 2014; 34: 190-221
[18] Viktorinová I, Dahmann C. Microtubule polarity
predicts direction of egg chamber rotation in Drosophila. Curr Biol 2013; 23: 1472-1477. [19] Squarr AJ, Brinkmann K, Chen B, Steinbacher
T, Ebnet K, Rosen MK, Bogdan S. Fat2 acts through the WAVE regulatory complex to drive collective cell migration during tissue rotation. J Cell Biol 2016; 212: 591-603.
[20] Tate g, Kishimoto K, Mitsuya T. A novel muta-tion of the FAT2 gene in spinal meningioma. Oncol Lett 2016; 12: 3393-3396.
[21] Chen DY, Lipari KR, Dehghan Y, Streichan SJ, Bilder D. Symmetry breaking in an edgeless epithelium by Fat2-regulated microtubule po-larity. Cell Rep 2016; 15: 1125-33.
[22] Matsui S, Utani A, Takahashi K, Mukoyama Y, Miyachi Y and Matsuyoshi N. Knockdown of Fat2 by siRNA inhibits the migration of human squamous carcinoma cells. J Dermatol Sci 2008; 51: 207-210.
[23] gao YB, Chen ZL, Li Jg, Hu XD, Shi XJ, Sun ZM, Zhang F, Zhao ZR, Li ZT, Liu ZY, Zhao YD, Sun J, Zhou CC, Yao R, Wang SY, Wang P, Sun N, Zhang BH, Dong JS, Yu Y, Luo M, Feng XL, Shi SS, Zhou F, Tan FW, Qiu B, Li N, Shao K, Zhang LJ, Zhang LJ, Xue Q, gao Sg, He J. genetic landscape of esophageal squamous cell carci-noma. Nat genet 2014; 46: 1097-102. [24] Sobin LH, gospodarowicz MK, Wittekind C.
In-ternational Union against Cancer (UICC) TNM
classification of malignant tumors. 7th edition.