JOURNAL OF FOREST SCIENCE, 48, 2002 (7): 320–327
The energetic exchange between plant communities and the atmosphere if measured close to the plant surface can give a lot of information about the internal stage of natural ecosystems. From this point of view plant water consump-tion is especially important. The main objective of this work is to compare different forest ecosystems, how they differ from each other. On the one hand, an almost natu-ral floodplain forest ecosystem, regularly inundated from ancient times until 1973, when interrupted drastically by hydro-engineering works. On the other hand, artificial
spruce monoculture established in the lower altitudinal vegetation zone.
MATERIAL AND METHODS
RESEARCH SITES
One of the two research sites of the Institute of Forest Ecology, Mendel University of Agriculture and Forestry, Brno, is situated in a South Moravian floodplain forest (48.8 N, 16.8 E, 161 m, no slope, fetch about 150 m at least, complex of forests and agricultural fields as sur-rounding areas). Floodplain forest types of the groups
Ulmeto-Fraxinetum carpineum and Querceto-Fraxinetum
are the most frequent in the region. Dominant tree spe-cies are Quercus robur (74%) and Fraxinus angustifolia
(24%), with admixtures of Tilia cordata (3%) and Ulmus carpinifolia (1%). Other interspersed species occur in these stands such as Carpinus betulus, Acer campestre, Malus sylvestris and Alnus glutinosa. Within the whole area of the floodplain forests, as described by VAŠÍČEK
(1991) there is a layer of shrubs of varying density and
maturity, with Cornus sanquinea as the dominant species. The floodplain forest was 110 years old in 1988. The mean height of trees of the upper canopy was 29 m, the high-est trees reached 37 m. The canopy structure surface was irregular, the stand density was 0.9 (VYSKOT 1991). The long-term (1901–1950) annual average precipitation is 524 mm, the values of monthly precipitation 28, 26, 27, 37, 54, 60, 70, 59, 43, 44, 41, 35 mm; for the growing sea-son from April to October it is 367 mm (values obtained by the Czech Institute of Hydrometeorology – ČHMÚ). The 1988 values of the month precipitation were 18, 33, 29, 22, 44, 57, 41, 48, 57, 12, 19 and 42 mm, i.e. 422 mm a year and 281 mm for the growing season (the values obtained from the meteorological station Mendeleum in Lednice).
The second research site presents the artificially estab-lished first generation of pure spruce plantation (Picea excelsa). It is situated in the Drahanská hills near a small town Rájec, north of Brno (49.5 N, 16.7 E, 620 m, slope eastward about 10%, fetch 300 m at least from the near-est edge, 100 m from the watershed ridge N–S direction oriented, complex of forests and agricultural fields as surrounding areas). The site was classified according to
ZLATNÍK and RAUŠER (1970) as the Querci-fageta abie- tis forest type group. The spruce stand was 90 years old in 1989, the mean tree height was about 28 meters. The long-term (1901–1950) annual average precipitation (for the nearby rainfall station Sloup) is 641 mm, the values of monthly precipitation 36, 32, 37, 45, 60, 76, 89, 72, 54, 52, 45, 43 mm, i.e. 448 mm for the growing season. Monthly precipitation in 1989 was 16, 19, 18, 71, 38, 100, 70, 72, 55, 14, 21, 18 mm, i.e. 512 mm over the year and 420 mm over the growing season (MRKVA 1992).
A short-term response of floodplain and spruce forests
to evaporation requirements in Moravia in different years
J. P
IVECCzech University of Agriculture, Prague, Czech Republic
ABSTRACT: Energy exchange above the floodplain forest and spruce monoculture ecosystems was measured in Moravia in 1988 and 1989. The results showed that the floodplain forest ecosystem with better access to groundwater than the spruce monoculture evaporated more rapidly. A higher flux of energy was recorded daily in latent heat (65% of net radiation) above the floodplain forest canopy, in contrast with the spruce plantation where it reached 17% only. The estimation of the floodplain forest actual evapotranspiration during the first half of June reached its maximum 0.17 g/m2/s, i.e. 0.6 mm/h. During the same period the actual
evapotranspiration of spruce monoculture reached a maximum about 0.28 mm/h, nearly a half of that of the floodplain forest.
MEASUREMENTS SCHEME
The following variables were measured: global solar radiation (using a SCHENK pyranometer, type 8101, Vienna, Austria, for incident and reflected radiation), net all-wave radiation balance (using a SCHENK thermocou-ple net radiometer, type 8111), albedo, air temperature and humidity (with electrically ventilated psychrometers THIES [Göttingen, Germany] with glass Pt 100 electrical resistance thermometers). All the sensors were located at the height of 40.5 meters above the ground surface (ap-proximately 9 m above floodplain forest and 12 m above spruce monoculture canopies) on a steel tower. Air tem-perature and humidity were also measured on the same tower at 31.5 m above the ground (9 m below the upper sensor level) in the floodplain forest and 28.5 m above the ground (12 m below the upper sensor level) in the spruce monoculture. Additional air temperature was measured at 2 m above the ground within the forest (non-aspirated ceramic Ptk 100 electrical resistance thermometer, ZPA Nová Paka, Czech Republic) in a conventional meteo-in-strument weather shelter. Soil temperature was measured at 5 and 15 cm depths (ceramic Ptk 100 electrical resist-ance thermometer). Soil heat flux was measured at the 10 cm depth (heat flux plate 100 × 75 mm DRUTĚVA Brno, Czech Republic, horizontally located in the ground). All data were recorded by a datalogger (EMS Brno, Czech Republic) at one-hour intervals during the whole growing season. 97 days over the vegetation season were usable in the floodplain ecosystem, in the case of spruce forest it was 14 days only from the beginning season. To keep to task comparability of measurements we choose a simulta-neous period of the first half of June in both the years.
DATA ANALYSIS
The data set was processed by the following method: water vapour pressure e [hPa] at both levels above forest canopies was calculated, after correction of psychrometer temperatures, by Unvin algorithm (UNVIN 1980). The ac-curacy presented by the author is ± 0.1 hPa within the range of temperature –5 to +34°C. Actual evapotranspira-tion (Ea) [g/m2/s] was calculated according to the energy balance Bowen ratio (β) method (WOODWARD, SHEEHY
1983). Available energy A (= H + λEa) [W/m2] was con-sidered as a difference between net radiation balance (Rn), soil heat flux (G) and heat flux into the vegetation (Jveg), the latter two so called flux of energy below the active sur-face of forest canopy (B = G + Jveg). Thus A = Rn – G – Jveg. The first two terms were measured directly, heat flux into the vegetation was calculated by Thom algorithm (THOM
1975). The specific heat of wood c was 2.7 kJ/kg Kon average, the weight of vegetation per unit ground area mveg
was 57.4 kg/m2 for floodplain forest, 42.5 kg/m2 for spruce
monoculture, the real wood temperature was substituted by the air temperature change in the forest within the one-hour interval dT [°C]. The potential evapotranspiration Ep
[mm/day] was calculated by Priestley-Taylor algorithm.
Albedo (α) was determined from measurements of the ratio of reflected to incident short-wave radiation.
RESULTS
ALBEDO
Albedo values from 1st to 16th June showed significant
differences between both sites (Fig. 1). In the floodplain forest stand the albedo average reached about twice higher values (14%) than in the spruce forest stand and diurnal variation was smaller. Diurnal variation of albedo in the spruce plantation was more variable from sunrise to sunset as it is apparent from the course of standard deviations (Fig. 1). The curve of albedo was slightly left asymmetric.
HUMIDITY AND TEMPERATURE DIFFERENCES
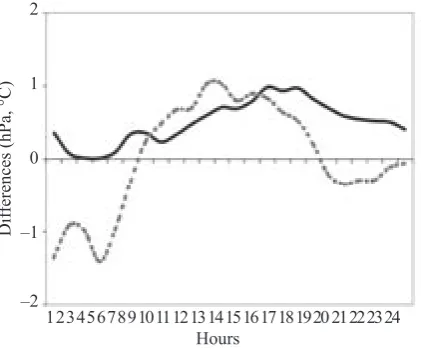
[image:2.595.300.526.61.207.2]In both cases the diurnal variation of the air humidity difference was delayed by about four hours compared with
Fig. 1. Mean diurnal variation of albedo (the bars show standard deviations) for (a) floodplain forest 1–16 June 1988, (b) spruce forest 1–16 June 1989
Fig. 2. Diurnal variation of air humidity difference (de – solid line) and air temperature (dt – dashed line) difference over the floodplain forest on 4 June 1988
Dif
ferences (hPa, °C)
1 2 3 4 5 6 7 8 9 10 11 12 13 14 15 16 17 18 19 20 21 22 23 24 2
1
0
–1
–2
[image:2.595.301.512.532.707.2]the air temperature difference. This resulted in the diurnal variation of the Bowen ratio being asymmetric. Above the
floodplain forest canopy during the observed period of the first half of June the temperature difference was –1.7°C and +1°C for minima and maxima of temperature and from –0.3 to +1.2 hPa for humidity gradients (Fig. 2).
The air humidity difference during the observed period of the first half of June above the spruce plantation
canopy fluctuated between –0.1 and +1.2 hPa, air tempera-ture difference varied in the range from –1.2 to +1.4°C (Fig. 3). In the rest of the 1989 year a systematically negative humidity gradient above the forest canopy was measured.
BOWEN RATIO
The variation of Bowen ratio curve during 24 hours shows regular results, often left side asymmetric (Fig. 4). Bowen ratio in the spruce plantation had similar
devel-opment but reached several times higher values during the day than that in the floodplain forest. This means that the energy used for evapotranspiration was lower than the energy consumption for the heating of air masses over the spruce forest.
ACTUAL EVAPOTRANSPIRATION
The everyday value of actual evapotranspiration (Ea) obtained in the floodplain forest during the first half of June was 0.17 g/m2/s, i.e. 0.6 mm/h. Examples of actual
[image:3.595.71.295.57.233.2]evapotranspiration diurnal variation (Fig. 5) show a regu-lar time shift compared with the radiation balance curve. The time lag was about one to two hours.
Fig. 3. Diurnal variation of air humidity difference (de – solid line) and air temperature (dt – dashed line) difference over the spruce forest on 23 May 1989
1 2 3 4 5 6 7 8 9 10 11 12 13 14 15 16 17 18 19 20 21 22 23 24
Dif
ferences (hPa, °C)
Hours 2
1
0
–1
–2
Fig. 4. Diurnal variation of the Bowen’s ratio over the floodplain forest on 9 June 1988 (a) and over the spruce forest on 23 May 1989 (b)
Bowen ratio
4
2
0
–2
–4 1 2 3 4 5 6 7 8 9 10 11 12 13 14 15 16 17 18 19 20 21 22 23 24 Hours
b
[image:3.595.312.530.239.359.2]a
Fig. 5. Diurnal variation of net radiation (Rn– thin line) and actual evapotranspiration (Ea– thick line) over the floodplain forest on 4 June 1988
1 3 5 7 9 11 13 15 17 19 21 23
Net radiation (W/m
2)
Evaporation (g/m
2/s)
600
400
200
0
0.12
0.08
0.04
0.00
Actual evapotranspiration for the first half of June in the
spruce forest reached the values of about 0.08 g/m2/s, i.e.
0.28 mm/h. Everyday values of actual evapotranspiration could be obtained till the first half of June only due to the continually negative air humidity gradient in the rest of 1989 year measurements (see above). Differences in daily mean actual evapotranspiration in both stands within the comparable period of the first half of June in both men-tioned years are demonstrated in Fig. 6.
Fig. 6. Mean diurnal variation of evapotranspiration (the bars show standard deviations) for (a) floodplain forest 1–16 June 1988, (b) spruce forest 1–16 June 1989
12 00
Hours a
Evaporation (g/m
2/s)
0.10
0.08
0.06
0.04
0.02
12 00
Hours b
[image:3.595.311.538.542.711.2] [image:3.595.77.292.557.716.2]RELATION OF ACTUAL EVAPOTRANSPIRATION TO EVAPORATION REQUIREMENTS OF THE
ENVIRONMENT
The comparatively observed first half of June shows higher actual evapotranspiration in thefloodplain forest
although the values of precipitation were nearly twice lower than in June 1989. Precipitation amounts of 57 mm in the floodplain forest in June 1988 and 100 mm in the spruce forest stand in June 1989 were collected. Regres-sion analysis between potential (as dependent variable) and actual (as independent variable) evapotranspiration was calculated for the first half of June (Fig. 7). In the
LATENT AND SENSIBLE HEAT FLUX AND HEAT FLUX BELOW THE ACTIVE SURFACE
The latent heat flux was predominant (66%) while the proportion of sensible heat flux was lower (28%) in the
floodplain forest (Fig. 8). The proportion of both fluxes was nearly alike but vice versa in the spruce plantation
[image:4.595.300.525.219.356.2](λEa/Rn = 17%, H/Rn = 68%) in the same period of the following year (Fig. 9). The remaining part of radiation balance – the flux of energy below the active surface of forest canopy (B) – appeared twice lower (7%) in the floodplain forest than in the spruce stand (14%).
Fig. 7. Daily actual evapotranspiration plotted against Priestley-Taylor potential evaporation for (a) floodplain forest 1–16 June 1988, (b) spruce forest 1–16 June 1989
0 2 4 6
Actual evaporation (mm) y = 1.61x + 2.03
R2 = 0.358
y = 1.17x + 0.08 R2 = 0.887
a
Potential evaporation (mm)
b 6
4
2
0
case of spruce plantation the coefficients 1.6 (slope) and 2 (intercept) indicate much lower actual evapotranspira-tion than in the floodplain forest ecosystem, where both (actual and potential) evapotranspirations are closer (slope 1.2, intercept 0.1).
Fig. 8. Diurnal variation of the ratio of sensible heat flux (H – dashed line), energy absorbed by the vegetation and soil (B – solid line, thin) and of evapotranspiration (λE – solid line, thick) to net radiation for the floodplain forest in June 1988
1 4 7 10 13 16
June 1988
Ratio
1
0.5
0
Fig. 9. Diurnal variation of the ratio of sensible heat flux (H – dashed line), energy absorbed by the vegetation and soil (B – solid line, thin) and of evapotranspiration (λE – solid line, thick) to net radiation for the spruce forest in June 1989
Ratio
1
0.5
0
1 4 7 10 13 16
June 1989
DISCUSSION
LINDROTH (1985) observed the latent heat to radiation balance ratio reaching the value of 40% in May. It is within the range observed in this study, 66% in the floodplain and 17% in the spruce forest. The energy flux below the active surface of forest canopy (B) corresponds well with albedo values α = 14% in the floodplain and 7% in the spruce stand.
Higher albedo of the floodplain forest canopy indicates optically smoother surface than in the case of spruce for-est. Generally higher values in the morning and in the evening occurred due to the lower sun elevation angle (PIVEC 1992, 1994, 1998). Left-side asymmetry of albedo curve in the case of spruce forest stand was influenced by the eastward oriented slope (about 10%) where the measurements were carried out.
[image:4.595.57.285.227.393.2] [image:4.595.56.284.547.686.2]lim-ited groundwater supply to the initially floodplain forest ecosystem can be expected. ČERMÁK, PRAX (2001a,b) found relatively low actual evapotranspiration as well as transpiration (338 and 261 mm, respectively) under mod-erate weather conditions (characterised by water deficit of only 170 mm). In these conditions precipitation itself was sufficient to cover completely the transpiration of the main canopy trees and over 80% of actual evapotranspi-ration. Under dry weather conditions (characterised by water deficit of 380 mm) substantially higher total actual evapotranspiration as well as transpiration were reported (509 and 434 mm, respectively) while lower precipitation could supply only about 36 and 42% for actual evapora-tion and transpiraevapora-tion, respectively.
Relative transpiration as a ratio of measured transpira-tion and potential evapotranspiratranspira-tion expressed by the model BROOK-90 was determined by the authors in the first half of June 1988 within the range of 50 to 80%, depending on dry or wet canopy conditions, respectively. It corresponds well with our findings as water deficit of 285 mm was observed from May to October and actual evapotranspiration amounted to about 4/5 of the potential one on average in the first half of June 1988. TATARINOV
et al. (2000) found relative transpiration of spruce canopy
at the same site within the six-year measurements (includ-ing 1989) to amount on average to about 1/3 of potential evapotranspiration; it was very variable between individ-ual trees and different periods during the growing season. The analysis of all sample trees taken over two years under good water supply in 1981 and 1989 together shows the ratio of transpiration to potential evapotranspiration from 1/3 to 2/3 at the beginning of June. In our case it was nearly 2/3 of potential evapotranspiration expressed by the Priestley-Taylor algorithm. However, energy received by the spruce canopy was higher than in the floodplain for-est (temperature lower than in the floodplain forfor-est) – see Figs. 10 and 11 – actual evapotranspiration was nearly a half of that of the floodplain forest.
The time delay of the gradient of air humidity behind the gradient of air temperature influences the time delay of ac-tual evapotranspiration against the radiation balance in the diurnal course, which was not practically observed during previous observations in 1979 (ŽIDEK 1991). Similar time
delay of actual evapotranspiration behind the radiation balance was described by MAKI (1991) under drier
condi-tions (on dry sands); the Bowen ratio method is considered by the author to be more suitable for wet conditions be-cause in the dry ones it tends to give excessive estimates. Left side asymmetry of Bowen’s ratio was obtained by
HOLMES and WRONSKI (1981) in a Pinus radiata forest,
when it was dry. The same diurnal course was described by HEILMAN et al. (1989) in the case of simultaneous
Bowen’s ratio measurement over the relatively smooth Bermuda grass surface. Similarly, BERNHOFER and GAY
(1989) in a mature oak forest north of Vienna. LINDROTH
(1985) obtained rather a symmetrical diurnal course of Bowen’s ratio in a pine forest in the vicinity of Jädräs (Sweden), according to the sunrise and sunset. The latent heat to radiation balance ratio was observed by the author to be changeable during the growing season – accordingly to our results – with the values of 40% in May and 60% in August and September.
CONCLUSION
In the first half of June almost two thirds of net radiation were used for evapotranspiration by the floodplain forest ecosystem compared with one third used by the spruce monoculture. If these results are typical of local climatic conditions, the actual evapotranspiration from the flood-plain forests will be more than twice higher than that of spruce forests grown in areas with less groundwater at the end of spring season. The Bowen’s ratio method is useful only if the air humidity difference is large enough to be measured – our case for the floodplain forest relatively well supplied with groundwater.
Acknowledgement
Many thanks to Dr. J. KUČERA for his valuable and creative help with the instrumentation, collection and recommendations for the result processing.
Fig. 10. Radiation balance (Rn [W/m2], column), and air
tempe-rature course (t [°C], curve), first half of June 1988, floodplain forest
Air temperature (°C)
20
15
10
5
0
1 4 7 10 13 16
2,000
1,500
1,000
500
0
Net radiation (W/m
[image:5.595.70.297.579.709.2]2)
Fig. 11. Radiation balance (Rn [W/m2], column), and air
tem-perature course (t [°C], curve), first half of June 1989, spruce forest
Net radiation (W/m
2)
1 4 7 10 13 16
2,000
1,500
1,000
500
0
20
15
10
5
0
References
BERNHOFER CH., GAY L.W., 1989. Evapotranspiration from an oak forest infested by mistletoe. Agric. Forest Meteorol., 48: 205–223.
ČERMÁK J., KUČERA J., PRAX A., BEDNÁŘOVÁ E., TA-TARINOV F., NADYEZHDIN V., 2001a. Long-term course of transpiration in a floodplain forest in southern Moravia as-sociated with changes of underground water table. Ekológia (Bratislava), 20: 92–115.
ČERMÁK J., PRAX A., 2001b. Water balance of a southern Moravian floodplain forest under natural and modified soil water regimes and its ecological consequences. Ann. For. Sci. 58, INRA, EDP Sciences: 15–29.
HEILMAN J.L., BRITTIN C.L., NEALE C.M.U., 1989. Fetch requirements for Bowen ratio measurements of latent and sensible heat fluxes. Agric. Forest Meteorol., 44: 261–273. HOLMES J.W., WRONSKI E.B., 1981. The influence of plant
communities upon the hydrology of catchments. Agric. Water Mgmt, 4: 19–34.
LINDROTH A., 1985. Seasonal and diurnal variation of ener-gy budget components in coniferous forests. J. Hydrol., 82: 1–15.
MAKI T., 1991. Methods for estimating evapotranspiration under wet and arid field conditions. Jarq, 25: 214–221.
MRKVA R., 1992. Atmospheric precipitation and interception of the spruce stand. Manmade Spruce Ecosystem. Brno, Uni-versity of Agriculture, Faculty of Forestry, Institute of Forest Ecology: 11–27.
PIVEC J., 1992. Seasonal course of albedo as an indicator of leaf development in a floodplain forest. Ekológia (ČSFR), 11: 13–19.
PIVEC J., 1994. Utilisation of energy disposable for the flood-plain forest ecosystem within the growing season. Ekológia (Bratislava), 13: 263–282.
PIVEC J., 1998. Sezonní a denní variabilita složek energetické bilance v lužním lese. [Dizertační práce.] Olomouc, UP: 71. TATARINOV F., ČERMÁK J., KUČERA J., PRAX A., 2000.
Transpiration of spruce in a mature plantation in Drahanská vrchovina uplands, Moravia. I. Variation between individual trees. Ekológia (Bratislava), 19: 48–62.
THOM A.S., 1975. Momentum, mass and heat exchange of plant communities. In: MONTEITH J.L., 1976. Vegetation and atmosphere II. London,Academic Press: 57–109. UNVIN D.M., 1980. Microclimate measurement for ecologists.
London,Academic Press: 97.
VAŠÍČEK F., 1991. The reaction of the shrub layer. In: PENKA M. et al., Floodplain forest ecosystem II. After water manage-ment measures. Praha, Elsevier, Academia: 229–242. VYSKOT M., 1991. The tree layer. In: PENKA M. et al.,
Flood-plain forest ecosystem II. After water management measures. Praha, Elsevier, Academia: 243–263.
WOODWARD F.I., SHEEHY J.E., 1983. Principles and mea-surements in environmental biology. London, Butterworth & Co, Ltd: 263.
ZLATNÍK A., RAUŠER J., 1970. Biogeografické mapy. Mapy skupin biogeocenóz (ekosystémů) ve výškových vegetačních stupních. Praha, Kartografické nakladatelství.
ŽIDEK V., 1991. Actual and potential evapotranspiration in the floodplain forest. In: PENKA M. et al., Floodplain forest eco-system II. After water management measures. Praha, Elsevier, Academia: 103–119.
Received 14 September 2001
Odezva lužního a smrkového lesa na evaporační požadavky na Moravě
J. PIVEC
Česká zemědělská univerzita, Praha, Česká republika
ABSTRAKT: V letech1988 a 1989 byla měřena energetická výměna nad povrchem lužního a smrkového porostu na jižní Moravě. Výsledky ukázaly mnohem rychlejší evapotranspiraci lužního lesa s dostupnější zásobou vody v půdě. Vyšší denní energetický tok byl zaznamenán v lužním lese u latentního tepla (65 % radiační bilance) na rozdíl od smrkové monokultury, kde činil pouze 17 %. Skutečná evapotranspirace během první poloviny června dosahovala v lužním lese maximálně 0,17 g/m2/s, tj. 0,6 mm/h,
ve smrkové monokultuře kolem 0,28 mm/h, tj. téměř poloviční hodnotu.
Klíčová slova: albedo; tok latentního (zjevného) tepla; radiační bilance; skutečná evapotranspirace
Měření energetické výměny mezi povrchem rost- linných společenstev a přiléhající vrstvou atmosféry může podat mnoho informací o vnitřním stavu daného
v porovnání z tohoto hlediska rozdílů ekosystémů dvou lesních společenstev v různých lokalitách, různě záso-bených vodou v půdě.
Na jedné straně šlo o téměř přirozený ekosystém lužního lesa, dobře zásobený vodou v půdě, pravidelně zapla-vovaný do roku 1973, kdy zde došlo k zásadní úpravě vodního režimu půd za účelem zamezení záplav. Na druhé straně byla sledována uměle založená smrková monokul-tura nižšího vegetačního stupně (bukový vegetační stupeň 4 místo smrkového 6).
Byly měřeny následující prvky prostředí: globální záření (jak pro dopadající, tak odražené záření pro stanovení albeda), bilance záření, albedo, teplota a vlh-kost vzduchu. Všechna tato čidla byla umístěna ve výšce 40,5 m nad zemí (průměrně 9 m nad povrchem lužního lesa a 12 m nad povrchem smrkového porostu) na ocelové věži čtvercového průřezu asi 1,5 × 1,5 m. Teplota a vlhkost vzduchu byly rovněž měřeny ve výšce 31,5 m nad zemí v lužním lese a 28,5 m nad zemí ve smrkové monokultuře. Jako doplňková byla měřena ještě teplota vzduchu ve 2 m nad zemí v běžné meteorologické budce. Teplota půdy byla měřena v hloubce 5 a 15 cm, tok tepla do půdy v hloubce 10 cm. Všechna data byla soustřeďována ústřednou v hodinových intervalech během celé vegetační sezony. V lužním lese bylo po verifikaci naměřených hod-not takto získáno celkem 97 dní z měřené sezony (VI–X), v případě smrkového porostu bylo použitelných celkem 25 dní za období V–X, z toho 11 dní v květnu a 16 dní v červnu. V rámci zachování srovnatelnosti obou měření byl vybrán průnik obou měřených období s použitelnými výsledky měření, tedy první polovina června.
V lužním lese dosahuje průměrná hodnota albeda asi dvojnásobně vyšší hodnoty (14 %) a jeho denní průběh má hladší průběh, než je tomu v případě smrkového po-rostu. Zde jsou jeho hodnoty během dne proměnlivější, jak je patrné z průběhu standardních odchylek (obr. 1). Křivka denního průběhu albeda je zde lehce levostranně asymetrická. Denní průběh rozdílu vlhkosti vzduchu mezi oběma hladinami měření v lužním lese byl zpožděn oproti průběhu rozdílu teplot vzduchu mezi oběma hladinami měření asi o 4 hodiny (obr. 2). Absolutní hodnoty tohoto rozdílu vlhkosti vzduchu dosahovaly 1,5 až 2 hPa (zřídka záporných hodnot –1 hPa v nočních hodinách), hodnoty rozdílu teploty vzduchu kolísaly v rozsahu +0,5 °C až –2 °C.
Rozdíly vlhkosti vzduchu během druhé poloviny září poklesly a až do konce měření kolísaly kolem nulové hodnoty, a tedy nebyly pro další výpočty použitelné. Měření bylo proto koncem října ukončeno. V době po-klesu rozdílů vlhkosti vzduchu došlo ke zvýšení rozdílů teplot vzduchu. Rozdíly vlhkosti vzduchu nad povrchem smrkové monokultury kolísaly od –0,1 do +1,2 hPa, roz- díly teploty vzduchu od –1,2 °C do +1,4 °C (obr. 3). Denní chod Bowenova poměru vykazoval pravidelný, často levostranně asymetrický průběh (obr. 4). Průběh ve smrkovém porostu měl obdobný charakter, avšak několikrát vyšší hodnoty během dne než v lužním lese. Znamená to, že energie radiační bilance, využitelná na
evapotranspiraci smrkového lesa, byla nižší než ener-gie, využitelná k ohřevu vzduchu v těsné blízkosti jeho povrchu.
Od počátku června téměř po celé měřené období byly získány denní hodnoty skutečného celkového výparu v lužním lese. Denní maximum intenzity výparu činilo až 0,2 g/m2/s, tj. 0,72 mm/h. Během první poloviny června
to bylo 0,17 g/m2/s (0,6 mm/h). Průměrné denní hodnoty
evapotranspirace (mm) pro jednotlivé měsíce činily: 3,5 červen, 4,2 červenec, 3,3 srpen, 1,3 září, 0,7 říjen. Celkový skutečný výpar poklesl ke konci vegetační sezony, zhruba od poloviny října téměř nulový rozdíl vlhkosti vzduchu způsobil nepoužitelnost metody k dal- šímu měření. Příklad denního průběhu evapotranspirace (obr. 5) ukazuje časový posun kulminace a sestupné části křivky výparu (kolem 1–2 hodin) ve srovnání s denním průběhem radiační bilance.
Skutečný celkový výpar smrkového porostu dosa-hoval 0,08 g/m2/s, tj. 0,28 mm/h. Denní hodnoty byly
měřitelné pouze v květnu a v první polovině června díky systematicky zápornému rozdílu vlhkosti vzduchu v obou hladinách měření nad porostem ve zbývajícím období. Rozdíly denního průběhu skutečného celkového výparu obou stanovišť jsou demonstrovány na obr. 6. Evaporační požadavky prostředí byly vyjádřeny potenciálním výpa-rem (Ep) podle Priestley-Taylorova vztahu.
Ze srovnatelného období měření první poloviny června plyne vyšší celkový skutečný výpar z lužního lesa, ačkoliv hodnota srážek byla v tomto období téměř dvakrát nižší než v červnu 1989 (57 mm proti 100 mm). Byla provedena lineární regresní analýza mezi potenciálním (závisle proměnná) a skutečným (nezávisle proměnná) celkovým výparem pro první polovinu června obou let (obr. 7). V případě smrkového porostu ukazují koeficienty 1,6 (směrnice) a 2 (úsek na ose Ep) mnohem menší skutečnou evapotranspiraci než v lužním lese, kde jsou obě denní hodnoty (potenciální a skutečná) bližší. Srovnávací periodou obou měření byla pouze první polovina června. Tok latentního tepla převažoval (65 % proti toku zjevného tepla 28 %) v lužním lese (obr. 8). Hodnota obou toků byla obdobná, avšak opačná co do velikosti u smrkového porostu (λEa/Rn = 17 %,
H/Rn = 68 %) v následujícím roce (obr. 9). Zbývající část radiační bilance – tok energie pod aktivní povrch porostu (B) – byla dvakrát menší (7 %) v lužním než ve smrkovém lese (14 %). V první polovině června – na počátku vegetační sezony – využíval ekosystém lužního lesa asi dvě třetiny energie radiační bilance na pokrytí evaporačních nároků prostředí, smrkový porost asi pouze třetinu, a to navzdory faktu, že energie (radiační bilance) přijatá ekosystémem lužního lesa byla ve sledovaném období nižší než energie přijatá smrkovým porostem (obr. 10, 11).
výpar středoevropského lužního lesa více než 400 mm/m2,
bude tento výpar ze smrkových stanovišť v dané oblasti činit asi 200 mm/m2 ročně. Metoda Bowenova poměru je ke
Corresponding author:
Dr. Ing. JAN PIVEC, Česká zemědělská univerzita, Agronomická fakulta, Ústav obecné produkce rostlinné a agrometeorologie, Praha 6-Suchdol, Česká republika
tel.: + 420 2 24 38 27 75, fax: + 420 2 24 38 27 80, e-mail: pivec@af.czu.cz


![Fig. 11. Radiation balance (Rn [W/m2], column), and air tem-perature course (t [°C], curve), first half of June 1989, spruce forest](https://thumb-us.123doks.com/thumbv2/123dok_us/495510.548044/5.595.70.297.579.709/radiation-balance-column-perature-course-curve-spruce-forest.webp)
