The Impact of Feature Vector Length on Activity
Recognition Accuracy on Mobile Phone
Sulaimon A. Bashir, Daniel C. Doolan, Andrei Petrovski
Abstract—A key challenge for large scale activity recog-nition on mobile phones is the requirement for producing non-static classifiers that cater for differences in individual user characteristics when performing similar activities in a diverse environment. A static classifier is fixed throughout the system lifetime and does not adapt to different users or environmental changes. Therefore, a personalized recognition model is desirable for each user of the system to ensure accurate recognition in a diverse population of people. One of the main approaches for personalization of activity recognition is the generation of the classification model from user annotated data on mobile itself. However, giving the resource constraints on such devices there is a need to examine the effects of system parameters such as the feature extraction parameter that can affect the performance of the system. Thus, this paper examines the effects of feature vector lengths and varying data set sizes on the classification accuracy of four selected supervised machine learning algorithms running on off the shelf mobile phones. Our results show that out of the three feature vector lengths of 32, 64 and 128 considered, the 128 vector length yields the best accuracy for all the algorithms tested. Also, the time taken to train the algorithms with samples of this length is minimal compare to 64 and 32 feature lengths.
Index Terms—activity recognition, smartphone, accelerome-ter sensor data, machine learning algorithms.
I. INTRODUCTION
Sensor rich mobile phones are gradually becoming com-monplace items in the hands of billions of people world-wide. The ubiquity and the improved processing and storage resources on these phones are making them suitable for sensor data gathering and processing to infer meaningful information about the phones internal and external envi-ronment, which include their users activities, locations and interactions. A typical smartphone is equipped with a number of integrated sensors such as accelerometer, microphone, camera, gyroscope, GPS and many others depending on the manufacturer and model. These sensors can facilitate different types of sensor data mining applications such as activity and behavioural sensing, environment sensing, road and traffic monitoring and health monitoring [1]. Recognition of user activities, an important task in pervasive computing is moving from the use of traditional wearable sensors [2], [3], [4] to mobile platforms [5] due to the aforementioned ca-pabilities of smartphones. Recognition of different activities provides contextual information to computing platforms for adapting their functions to the user contexts. For example, a device is configured to increase the screen font size if discovered that the user is walking to make it easy to read the screen or a device may do self-management to conserve resource usage by switching off radios like WiFi
Manuscript received March 08, 2015; revised April 06, 2015.
S.A. Bashir, D.C. Doolan, A. Petrovski School of Computing Sci-ence and Digital Media, Robert Gordon University, Aberdeen, UK. e-mails:(s.a.bashir, d.c.doolan, a.petrovski)@rgu.ac.uk
and bluetooth if discovered the user is running. Similarly, activity recognition is useful for fitness and health monitoring [6], social networking [7] and commercial application like activity based advertising [8].
One of the fundamental steps in performing context recognition with mobile phones is the collection of data for training classification algorithm. In many of the previ-ous work, activity recognition is performed by collecting sensor data from many subjects carrying mobile phones, uploads the data for training and generates a classification model on remote systems. However, the need to personalise classification model to each user requires algorithm to be trained on the mobile using the user generated data only. Furthermore, giving the resource constraints on such devices there is a need to examine the effects of system parameters such as the feature extraction parameter that can affect the performance of the system. Therefore, we examine the effects of feature vector of different lengths and varying data set sizes on the accuracy and time required to train four selected algorithms (J48, Naive Bayes, PART and KNN) directly on a mobile phone with a view to identify which algorithm is more suitable for incremental update with additional data and also to select the optimal feature vector lengths to represent the raw data. We employed Fast Fourier Transform (FFT) algorithm computation of Discrete Fourier Transform (DFT) to extract frequency domain feature from the raw time series accelerometer data. FFT feature extraction method for accelerometer data has been shown to perform better than statistical features extraction methods like mean, standard deviation and variance [9].
The rest of this paper is organised into 5 sections. In Section 2, we present related work in activity recognition system. Section 3 discusses the experimental set-up and method. The results and discussion are presented in section 4 followed by conclusion and future work in section 5.
II. RELATEDWORK
vertical orientation was used for testing. Again, for the device independent test scenario, data from one phone model is used as training while the data from another phone model was used for testing. In the user independent test, a leave-one-out approach is used where a user data is left out during training and then used for testing the generated model from the rest of the users data. Their results show that, with simple features such as mean, variance and standard deviation, the user dependency test records 91% accuracy, while the phone dependency test reached 96% accuracy for the same phone model and 95% with different phone models. The orientation effects test was low with 83% accuracy. They further considered including more sophisticated features like FFT and autocorrelation and the observed an increase of accuracy of up to 1-2% across all the test scenarios. To improve further on the orientation effects test accuracy, they use both linear acceleration that is devoid of gravitational force and earth coordinates reference to collect new set of data. This new dataset yielded 93% for the orientation test and user dependency test increased to 95%. The earth coordinate system data gives a further accuracy of up to 97% for both the orientation effects and the user dependency test. This study does not consider the effect of feature vector lengths in these experiments. In addition, the data processing is performed off the phone on a desktop machine unlike our experiment, which is carried out on the mobile phone directly.
Another study [10] performed a comparative analysis of different classifier algorithms for activity recognition with mobile phone’s accelerometer data. They selected variety of algorithms from the seven categories of classification algorithms in Weka to build model for two different data collection strategies adopted. The data collected with phone placed in the shirt pocket was used to compare accuracies of IBK, Naive Bayes, Rotation Forest, VFI, DTNB and LMT algorithms while the data collected when the phone was placed in the palm position was used to compare accuracies of SMO, NNge, ClaaasificationViaRegression, FT, VFI, IBK and Naive Bayes algorithms. Out of all the algorithms tested, they reported IBK and IB1 to give the best accuracy for the hand’s palm data and VFI gives the lowest accuracy. For the shirt pocket’s data, rotation forest algorithm was reported to give best accuracy while simple logistic regression gives the lowest accuracy. In all, the accuracies of hand palm’s position is reported to be better overall. This study shows the relative performance of the algorithms but does not consider any system parameters such as feature length that makes one algorithm to perform better than the others .
Authors in [11] conducted a study to investigate the impact of user differences on the accuracy of classification algorithms when the data collected from one user is used for training and separate data from another subject is used for testing. They induced three types of models from the data collected to show the impact of each on the accuracy of classifier algorithms like J48 Decision Trees, Random Forest, IBk, J-rip, Voting Features Interval (VFI) and Logistic Regression. The first, called the impersonal model was induced by using training data from set of subjects who are not targeted to use the model afterwards. This implies that the training set is totally different from the test set. This is achieved by designating data from a number of subjects
for training and data from one specific subject as testing data. The personal model on the other hand is generated by using part of the data collected from a particular subject for training and another part of the same data for testing. This yielded a model that is personalised to the intended user only. The last model generated is called hybrid model where the data collected from set of subjects are used for training and part of the data from the same set of subjects are used for testing. The hybrid model can be seen as a combination of the two other models. The result from the experiment shows that the personal model performance in terms of recognition accuracy across all the algorithms tested is the best, while the hybrid model came second best and the impersonal model performs worst. The best performing algorithm for the personal model is reported to be Multi-Layer Perceptron reaching an accuracy of 98.7% and its worst performing algorithm was J-rip with 95.1% accuracy. The best performing algorithm for the hybrid model was K-nearest neighbour which yields an accuracy of 96.5% and worst performing algorithm was VFI with 76%. The impersonal model has random forest algorithm performing best with an accuracy of 75.9% while multilayer perceptron gives the worst accuracy of 67.8 %. This experiment shows the superiority of personal model in activity recognition and support the notions of the need for solving the population diversity problem [12] encountered in large scale activity recognition involving diverse user population.
Several other activity recognition systems on mobile phone have been reported in the literature. Kose et al. [13] imple-mented a modified KNN algorithm called clustered KNN that uses smaller training sets on a mobile phone. Bartolo et al. [14] proposed an online training and classification approach that uses data stream mining. The benefit of data stream mining is that the training data are only observed once and no need to store all training records on the phone. A recent survey of various mobile based activity recognition system is presented in [5].
A. Traditional Supervised Approach to Activity Recognition
and Gaussian and Butterworth filtering for the frequency domain signal. Segmentation phase segments the reading into chunks from which features are extracted. Segmentation can be performed using a timed window in which sensor is sampled for a fixed amount of time to form a segment from which features are extracted. Another approach is to collect a fixed number of samples into, for example, an array of fixed size. The features extracted from the raw sample segment can be time domain or frequency domain. Time domain features include mean, standard deviation and variance. Frequency domain features include, FFT component, spectral energy and principal frequency [15]. A class label of the activity is appended to the extracted feature to form an instance in the data. The training phase uses appropriate learning algorithms on the collected data to generate a model that can be used to recognize unseen data. Training is performed on the device used for data collection or on another system where the data has been transferred. Key performance parameters for this process includes, features used, segmentation type in form of window size and phone model [16].
III. METHODOLOGY
A. Data Collection Procedure
[image:3.595.95.243.479.694.2]We collected the data with a module of the application that sampled accelerometer sensor data on a Sony Xperia E 1505 smartphone. The phone has Qualcomm MSM7227A 1 GHz processor codenamed Snapdragon. It also has 1000MB of RAM, 1530mAh battery and runs Android 4.1.1 Jelly Bean. Each data point from the phone’s accelerometer sensor consists of three axes x, y, z values. These values represent the motion components along each axis. Figure 1 shows the data collection application. The interface allowed the selection of feature vector length and the activity label of the current data collection session.
Fig. 1. Data Collection Interface
To elicit the effect of feature vector lengths and the amount of training data on the accuracy and time required for training the selected algorithms on a mobile phone, we performed the data collection in three phases for each defined feature vector length. We have 32, 64 and 128 vector lengths. For a given
vector length, we collect 1 minute of data for each activity to form the first data set, followed by another 30 seconds of data for each activity to form the second dataset and an additional 30 seconds worth of data to form the third data set. We repeated this process for each of the defined vector length for each activity performed by the user. When users launch the application, they are presented with a screen for selecting the vector size and the activity class they are about to perform. Upon initializing the capture process, the user put the phone into the pants pocket and starts performing the selected activity. We selected pants pocket because other studies [17], [9], [18] have established this to be the most suitable position to record the impacts of user movements on the accelerometer sensor. An Android service is started that asynchronously performs sensor sampling, feature extraction and storage into a file within a background thread.
B. Feature Extraction
This stage is performed by extracting features from the raw time series x, y, z accelerometer values. The sampling rate of the accelerometer is set to the Android provided constant that gets the sensor data as fast as possible. Orientation effects on the data are eliminated by computing the magnitude of x, y, z components of each accelerometer data. A combination of fixed amount of this magnitude values i.e. 32, 64 or 128 are combined into a vector. This time series sample stored in a vector array of real value is converted to frequency domain samples of the same length by making use of Fast Fourier Transform (FFT) algorithm computation of Discrete Fourier Transform (DFT). The FFT computation is based on the decimation-in-time radix 2 algorithm.
C. Training and Model Induction
The training and evaluation of the classifier models are performed directly on a mobile phone. The algorithms tested are from Weka implementation [19]. They were easy to incorporate into our application since the Weka API are available in Java and we used Java to develop our An-droid application. All the Weka classification algorithms are grouped into the base package called weka.classfier and each sub-group of the algorithms were further grouped into sub-packages. For example, all the rules based al-gorithms are in weka.classifier.rules. A specific algorithm from this can then be invoked by instantiating an ob-ject of a specific class such as weka.classifier.rules.PART, weka.classifier.rules.DecisionTable and so on.
IV. RESULTS ANDDISCUSSION
TABLE I
ACCURACY OF THEFOURALGORITHMS WITHVARYINGDATASETSIZES ANDFEATUREVECTORLENGTHS
Algorithms 539 dataset 1034 dataset 1298 dataset
J48 76.44 73.02 76.04
Naive Bayes 74.40 67.89 70.18
PART 77.37 72.24 74.88
IBk (KNN) 80.15 74.95 75.81
32 Feature Vector Length Accuracy (%)
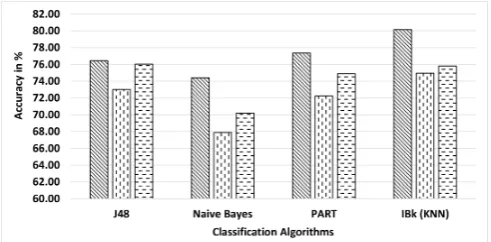
Algorithms 393 dataset 546 dataset 720 dataset
J48 87.53 87.55 85.56
Naive Bayes 84.99 85.35 73.47
PART 89.06 87.36 85.29
IBk (KNN) 90.84 91.76 87.92
64 Feature Vector Length Accuracy (%)
Algorithms 191 dataset) 295 dataset) 385 dataset)
J48 93.19 93.56 92.21
Nave Bayes 90.58 90.85 89.87
PART 93.72 95.25 93.77
IBk (KNN) 91.10 92.54 92.99
128 Feature Vector Length Accuracy (%)
with each feature length settings and the accuracies obtained for the four algorithms.
The accuracies are recorded separately for the 32, 64 and 128 feature vector lengths in the table from top to bottom respectively.
Similarly, table II shows the time taken to train and perform a 10 fold cross validations on each of the algorithms giving the varying dataset sizes and the vector lengths shown from top to bottom in the table.
TABLE II
TRAINING ANDEVALUATIONTIME ON THEFOURALGORITHMS
Algorithms 539 dataset 1034 dataset 1298 dataset
J48 29972 72467 96362
Naive Bayes 6935 13382 17412
PART 54876 248914 314477
IBk (KNN) 4780 14259 23231
32 Feature Vector Length Time (ms)
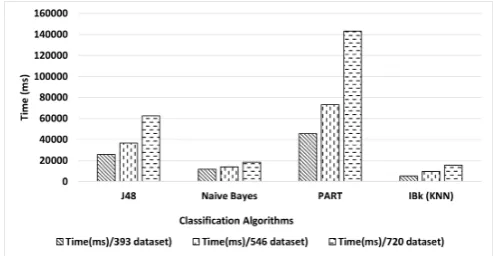
Algorithms 393 dataset) 546 dataset) 720 dataset)
J48 25617 36616 62559
Naive Bayes 11643 13873 18437
PART 45422 72994 143199
IBk (KNN) 5387 9483 15532
64 Feature Vector Length Time (ms)
Algorithms 191 dataset) 295 dataset) 385 dataset)
J48 16425 25893 39677
Nave Bayes 9246 14231 18583
PART 28253 52661 82132
IBk (KNN) 4089 8479 13263
128 Feature Vector Length Time (ms)
The data collection session is carried out in three phases across the three feature lengths. We first collect 1 minute worth of data for each activity class making a total of 4 minutes for the four activities of walking, running, stationary and jumping. This data is then used to train and evaluate the four algorithms under consideration and the result is recorded. Another 30 seconds worth of data is collected in the second and third phase for each activity and the model training and testing are performed. These procedure is repeated for each feature vector length to obtain the results. According to the results in the first part of table I, the
overall classification accuracy rate of 80.15% is obtained from IBk algorithm for the 32 feature vector length using the first dataset. PART, J48 and Naive Bayes algorithms accura-cies range between 74-77%. However, while we expect the accuracies of all the algorithms to increase with additional data, their accuracies degrade with more data in datasets 2 and 3 although the accuracies obtained in dataset 3 are better than those of the second dataset. We opine that the decrease in the accuracies with additional data is caused by the non-discerning information in the small vector lengths.
[image:4.595.63.278.86.267.2]Moreover, we can see that IBk outperforms all the other algorithms across the three datasets except for the J48 that slightly outperforms it in the third dataset. The performance of IBk can be attributed to the nature of the data that are very correlated and since IBk is an instance based algorithm it is able to leverage this to discern the closeness in the data samples. The assumption of Naive Bayes on the indepen-dence of each feature makes it perform worse on all the dataset because the feature instances are dependent on each other. Figure 2 and 3 shows the relative performance of the algorithms and the time taken to train the models for the 32 feature vector length. As indicated in figure 3, IBk takes the smallest amount of time across all the three datasets during training and evaluation. This is understandable because it does not build a model from the data and the dimension of each data sample is manageable for comparison operation inherent in the IBk algorithm. This result indicates that 32 feature vector lengths does not enable the algorithms to benefit from incremental update in terms of adding more training data.
Fig. 2. Accuracy of 32 Feature Vector Length
Fig. 3. Time Taken on 32 Feature Vector Length
[image:4.595.304.550.423.544.2]time consuming to train and evaluate. Unlike the 32 feature vector length whose performance degrades across all the algorithms in dataset 2 and 3, the 64 feature vector length accuracy slightly increases for all the algorithms in dataset 2 except for the PART which decreases slightly as captured in figure 4. However, the increase does not extend to the third dataset. IBk takes the minimal amount of time during training and evaluation followed by Naive Bayes, J48 and PART respectively as shown in figure 5. This result indicates that 64 vector length captures more distinguishing data that aid the algorithms in discerning the differences among the activity better than the 32 vector length.
Fig. 4. Accuracy of 64 Feature Vector Length
Fig. 5. Time Taken on 64 Feature Vector Length
The 128 vector length gives the best accuracies across all the algorithms as indicated in figure 7 and bottom part of table II. The training time is also minimal compared to other vector lengths. We can attribute this to the relatively smaller amount of data set collected within the same period for other vector lengths. This shows that it takes more time to collect more data with long vector length but the training time of the algorithm depends on the amount of data samples. Invariably, the long vector length captures information that is more discerning and thereby enables the algorithms to perform better on the recognition task. As indicated in figure 7, the highest time for the 128 vector length is below 90000msec compared to 32 vector length with 300000msec (figure 3) and 140000msec for the 64 vector length (figure 5).
V. CONCLUSION ANDFUTUREWORK
[image:5.595.47.314.209.333.2]From the analysis presented above, it is clear that 128 vector length yields the best result for all the algorithms tested and required the least amount of time to train and evaluate. The reduced training time can be attributed to
Fig. 6. Accuracy on 128 Feature Vector Length
‘
Fig. 7. Time Taken on 128 Feature Vector Length
the small amount of samples collected within our defined time. However, since this is the same time used for other vector lengths, it implies that its performance over them is justifiable. In terms of accuracy of the algorithms, IBk is the best on the average, followed by PART, J48 and Naive Bayes respectively. Nevertheless, the time requirements of PART is the highest followed by J48, Nive Bayes and IBk. The performance of IBk has been reported in other previous work for online activity recognition task [2], [13]. None of the algorithms shows any significant increase in accuracy with additional data suggesting that they are not amenable to incremental update. With these results, we can conclude that the more the feature vector length the better the discerning information they contain for the accurate performance of classification algorithm. Also, while it takes longer time to collect large data samples for long feature lengths, the length of the feature vector does not have a significant impact on the training and evaluation time of the algorithm. The sample size has more effect on the training time. In addition, the results also show that a minimal amount of personal data is adequate to recognize activity of a user. The main issue with collecting personal data is the duplication of efforts for all users.
[image:5.595.47.552.213.351.2] [image:5.595.45.292.383.511.2]REFERENCES
[1] W. Khan, Y. Xiang, M. Aalsalem, and Q. Arshad, “Mobile phone sensing systems: A survey,”Communications Surveys Tutorials, IEEE, vol. 15, no. 1, pp. 402–427, 2013.
[2] U. Maurer, A. Smailagic, D. P. Siewiorek, and M. Deisher, “Activity recognition and monitoring using multiple sensors on different body positions,” inInternational Workshop on Wearable and Implantable Body Sensor Networks, 2006. BSN 2006. IEEE, 2006, pp. 4–12. [3] Y. Zhan and T. Kuroda, “Wearable sensor-based human activity
recog-nition from environmental background sounds,”Journal of Ambient Intelligence and Humanized Computing, vol. 5, no. 1, pp. 77–89, 2014. [4] L. Bao and S. S. Intille, “Activity recognition from user-annotated acceleration data,” inPervasive computing. Springer, 2004, pp. 1– 17.
[5] M. Shoaib, S. Bosch, O. D. Incel, H. Scholten, and P. J. Havinga, “A survey of online activity recognition using mobile phones,”Sensors, vol. 15, no. 1, pp. 2059–2085, 2015.
[6] N. D. Lane, M. Mohammod, M. Lin, X. Yang, H. Lu, S. Ali, A. Doryab, E. Berke, T. Choudhury, and A. Campbell, “Bewell: A smartphone application to monitor, model and promote wellbeing,” in 5th International ICST Conference on Pervasive Computing Technolo-gies for Healthcare, 2011, pp. 23–26.
[7] E. Miluzzo, N. D. Lane, K. Fodor, R. Peterson, H. Lu, M. Musolesi, S. B. Eisenman, X. Zheng, and A. T. Campbell, “Sensing meets mobile social networks: the design, implementation and evaluation of the cenceme application,” inProceedings of the 6th ACM conference on Embedded network sensor systems. ACM, 2008, pp. 337–350. [8] K. Partridge and B. Begole, “Activity-based advertising techniques and
challenges,” inProceedings of Workshop on Pervasive Advertising, 2009.
[9] Y. E. Ustev, O. Durmaz Incel, and C. Ersoy, “User, device and orientation independent human activity recognition on mobile phones: challenges and a proposal,” in Proceedings of the 2013 ACM con-ference on Pervasive and ubiquitous computing adjunct publication. ACM, 2013, pp. 1427–1436.
[10] M. A. Ayu, S. A. Ismail, A. F. A. Matin, and T. Mantoro, “A compar-ison study of classifier algorithms for mobile-phone’s accelerometer based activity recognition,”Procedia Engineering, vol. 41, pp. 224– 229, 2012.
[11] G. M. Weiss and J. W. Lockhart, “The impact of personalization on smartphone-based activity recognition,” inAAAI Workshop on Activity Context Representation: Techniques and Languages, 2012.
[12] N. D. Lane, Y. Xu, H. Lu, S. Hu, T. Choudhury, A. T. Campbell, and F. Zhao, “Enabling large-scale human activity inference on smart-phones using community similarity networks (csn),” inProceedings of the 13th international conference on Ubiquitous computing. ACM, 2011, pp. 355–364.
[13] M. Kose, O. D. Incel, and C. Ersoy, “Online human activity recognition on smart phones,” inWorkshop on Mobile Sensing: From Smartphones and Wearables to Big Data, 2012, pp. 11–15.
[14] J. B. Gomes, S. Krishnaswamy, M. M. Gaber, P. A. Sousa, and E. Menasalvas, “Mars: a personalised mobile activity recognition system,” in 13th IEEE International Conference on Mobile Data Management (MDM), 2012. IEEE, 2012, pp. 316–319.
[15] S. J. Preece, J. Y. Goulermas, L. P. Kenney, and D. Howard, “A comparison of feature extraction methods for the classification of dynamic activities from accelerometer data,”IEEE Transactions on Biomedical Engineering, vol. 56, no. 3, pp. 871–879, 2009. [16] O. D. Incel, M. Kose, and C. Ersoy, “A review and taxonomy of
activity recognition on mobile phones,”BioNanoScience, vol. 3, no. 2, pp. 145–171, 2013.
[17] P. Siirtola and J. R¨oning, “Recognizing human activities user-independently on smartphones based on accelerometer data,” Inter-national Journal of Interactive Multimedia and Artificial Intelligence, vol. 1, no. 5, 2012.