Abstract— Load frequency control of interconnected power system is important. This ensures the zero steady state error in frequency dynamics and proper sharing of load by generators of interconnected areas. Use of PID controllers enhances smooth and efficient control of area control error (ACE).The ACE in turn works as the control vector of automatic generation control. Nowadays, interconnected power system works under open market scenario called deregulated environment. Here individual DISCOs get power from GENCOs of all connected areas according to the contract made. In such a complex situation, proper tuning of individual area’s PID controller became indispensable. In this work PID controllers tuned with Genetic Algorithm are used in two area Automatic Generation Control under deregulation. The system shows unstable response without controller due to change of load (0.1 pu) in one area. But the introduction of GA tuned PID controller improves the power system dynamic responses. It is observed that frequency reaches the steady state value within reasonable time (around 12 sec) and GENCOs of connected areas share the tie line power according to their participation factors. MATLAB codes are developed for GA based PID controller tuning, the results of which are used to study the system step response. All these are through in Simulink based background.
Index Terms— ACE, DISCO, GENCO, genetic algorithm, PID controller
I. INTRODUCTION
N recent years the power utilities have gone through a major change from monopoly to competition and deregulation has been initiated all over the world. In turn the electricity consumers have the opportunity to choose among several energy providers. With these changes, the electricity generation, transmission and distribution systems are needed to follow new strategies owing to deregulation [1, 2, 3].
Reliable and good quality power transfer is maintained in
Manuscript received January 08, 2014; revised February 06, 2014. This work was supported in part by the DRS project, Jadavpur University, India. G. Konar is with the Power Engineering Department, Jadavpur University, LB-8, Sector - III, Salt Lake, Kolkata - 700098. (+919830250659; fax: 033-23357254, e-mail: [email protected], [email protected]).
K. K. Mandal is with the Power Engineering Department, Jadavpur University, LB-8, Sector - III, Salt Lake, Kolkata - 700098. (+919433789792; fax: 033-23357254, e-mail: [email protected], [email protected]).
N. Chakraborty is with the Power Engineering Department, Jadavpur University, LB-8, Sector - III, Salt Lake, Kolkata - 700098. (+919433789792; fax: 033-23357254, e-mail: [email protected], [email protected]).
interconnected power system under deregulated environment through proper choice of automatic generation control components [4]. Sudden change in load introduces frequency fluctuations and tie-line power exchange. Suitable load frequency control with the consideration of bilateral contracts between participating areas nowadays became mandatory. Optimal output feedback, linear feedback, Kalman estimator [2, 5, 6, 7] are such few control strategies adopted elsewhere to accomplish the same.
Other than the classical control strategies, some soft computing techniques became popular in designing load frequency control. Several optimization techniques like Genetic algorithm, Particle Swarm Optimization, Bacterial Foraging are currently being applied for the automatic generation control in multi-area system under deregulation [8, 9, 10]. Such optimization techniques have also been used for automatic generation control of interconnected power system without deregulation [11, 12]. These techniques are used either to tune the different types of controllers or to set the parameters for power system stabilizers. These actions enable operators to improve the control of the frequency deviation situation and restoration of the tie line power fluctuations quickly. In deregulated environment participation contract between two or more areas are regulated by an ‘independent system operator’ (ISO) [13]. Contract violation and its effects are also important in these situations [2].
In this paper, two area automatic generation control has been studied in a deregulated environment to observe the effect of load change in system dynamics. One GENCO and one DISCO are considered in each area under study. GENCOS share load of its own area as well as that of the other area as demanded by the DISCOs. This participation is based on the contract made between the two systems as per the corresponding DISCO Participation Matrix (DPM) matrix. It is generally developed in restructured environment [13]. The PID controller is used here to nullify the effect of frequency and tie-line power deviations in both the areas. MATLAB code has been developed to achieve PID controller tuning based on genetic algorithm. PID controller tuning ensures the improvements in the system response in terms of settling time, rise time, overshoot and steady state value. Studies are made for different contract conditions. The results are compared with step response of similar system having a PID controller tuned with PSO in conventional interconnected power system [14] without
Two Area Load Frequency Control Using GA
Tuned PID Controller in Deregulated
Environment
G. Konar, K. K. Mandal, and N. Chakraborty
deregulation. The results obtained for the problem in hand provide interesting load control scenario in comparison to the conventional situation. The block diagrams of two area load frequency control under deregulation and conventional scenario are drawn in Simulink and the overall system response is found for change of load in one area.
II. TWO AREA LOAD FREQUENCY CONTROL IN
RESTRUCTURED POWER SYSTEM
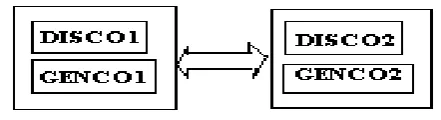
A. Two Area Power System In Restructured Environment Restructured power system consists of Generation companies – GENCOs, Transmission companies – TRANSCOs, Distribution companies - DISCOs, and independent system operators ISO. In this paper, the power system comprises two areas having one DISCO and one GENCO in each area as shown in Fig. 1. The corresponding DISCO Participation Matrix (DPM) is shown in (1). Each DISCO can buy power from the GENCOs according to the fractions assigned to the elements of the corresponding column of DPM matrix. Thus a GENCO sells a fraction of total load to a DISCO as per contract made between them. Hence, sum of all the elements in each column of DPM is unity i.e.
1icpfij , where cpf is the contract participation factor [13].
Fig. 2 depicts the block diagram of the two area load frequency control under deregulated environment. In this model the control vectors u1 and u2 are determined from the
knowledge of the area control error (ACE) and frequency deviations of area 1 and 2 respectively. (2) and (3) represent the ACEs of both areas. ACEs are calculated based on the frequency deviation (F1) and the tie-line power deviation i.e. the difference between the scheduled power deviation (Ptie12sch) and the actual power deviation (Ptie12actual). The latter two are represented through (4) and (5).
22 21 12 11 cpf cpf cpf cpf
DPM (1)
error tie
P F B
ACE1 1 1 12 (2)
error tie
P F B
ACE2 2 2 12 (3)
1 21 2 12
12sch L L
tie cpf P cpf P
P
(4)
sch tie actual tie error
tie P P
P 12 12 12
(5)
[image:2.595.316.537.53.113.2]Here Ptie12erroris the tie-line power error. Using ACE participation factor (apf), ACE signal is distributed among the GENCOs. These ACE signals are then fed into PID controller e sure that the symbols in your equation .
Fig. 1. Configuration of the power system
B. PID controller design
The PID controller design is the most important part of the Automatic Generation Control (AGC). The choice of proportional-integral-derivative (PID) controller than proportional plus integral (PI) controller ensures better system response in terms overshoot and settling time [15]. The ACE signals are controlled using the PID controller to produce control vectors for the AGC. In this work, the PID controller tuning is done through Genetic Algorithm (GA). The proportional (kp), integral (ki) and derivative (kd) gains
are set using GA. The transfer function of the PID controller (6) used for both the areas are considered to be identical.
To get the optimized values of the PID gains, suitable objective function is developed here. However the maximum and minimum values of the gains are appropriately chosen. This objective function (OB) can be defined as the sum of the squares of the area control errors (ACE1 and ACE2) in each area as shown in (7).
s k s k k s
Gc( ) p i d (6)
ACE
dt OB i i
0 2 1 2 (7)The optimization problem is based on the minimization of the Objective Function subject to the conditions that the PID gains kp, ki and kd of both the controllers will lie within the
minimum and the maximum limits as shown in (8). max min
max min
max
min , ,
d d d i i i p p
p k k k k k k k k
k (8)
Thus the PID controller parameters are obtained using (7) and (8) with the help of Genetic Algorithm as discussed in the next section.
III. P ID CONTROLLER PARAMETER TUNING USING GENETIC
ALGORITHM
A combination of Darwinian Survival of the fittest principle and genetic operation is popularly known as Genetic Algorithm. This became an effective method of optimization. This global optimization technique involves stochastic search algorithm. Since the gains of PID controllers, kp, ki and kd, are to be optimized using GA, three
Fig.2 Block diagram of two area load frequency control under deregulation
The decimal integers of binary strings are obtained following (9).
2 (j=1,2,….L)
1 1
ij l
i i
j b
y
(9)
Where
j
y is the decimal coded value of the binary string ij
b is the ith binary digit of the jth string l is the length of the string
L is the population size
Following a fixed mapping rule, the continuous variable xj (10) is found in the search space where xmin
and xmax are the minimum and the maximum values of the
variable xj.
Here, the minimum and maximum values of the PID gains are assigned as the minimum and maximum limits of the variables.
) ,... 2 , 1 ( 1 2
min max
min y j L
x x x
xj l j
(10)
In the next step the most challenging task is done i.e. the evaluation of the best values of PID controller gains are obtained to minimize the objective function. This task ensures smallest overshoot, fastest rise time and quickest settling time.
Another important step in GA is to select the highly fit strings in population as the parents and a mating pool is formed. The probability [16] for selecting the ith string is
L
j j i i
f f p
1
(11)
where fi is the fitness here fi is the fitness of the ith
population.
Another important step is the crossover operation. In this operation new strings are generated by exchanging the information among the strings of the mating pool. The mutation operator is also introduced to bring variations. Here mutation rate is chosen to be 0.5.
This newly tuned PID gains are used to form the PID controller transfer function. The controller transfer function is then used to simulate the overall system response of two area Load Frequency Control in deregulated environment for a given step input. The main objective is to find the smallest overshoot, fastest rise time and the settling time for frequency deviation and tie-line power characteristics.
The algorithm used for tuning PID controller is written below:
1. Set the population size, mutation rate, string size, generation counter, population counter, minimum and maximum values of variables etc. 2. Code the problem variables kp, ki and kd into
binary strings.
3. Create the initial population of 100 members using random number generation
4. Initialize the generation counter.
5. Increase the generation counter and initialize population counter.
6. Increase the population counter.
7. Decode the binary string using (9) and (10). Use these values of variables in PIDGA blocks of Simulink model to find out the objective function i.e. area control errors (ACEs). Send these values to MATLAB code.
8. Check the fitness.
10. Select highly fit strings as parents and produce offsprings according to their fitness.
11. Generate new strings by mating current offsprings using crossover operation.
12. Introduce variations by using mutation operator and replace the existing strings by new strings. 13. Check if the generation counter is less the
maximum iteration number. It true, GOTO step 5 and repeat. Otherwise,
14. Stop.
IV. RESULTS AND DISCUSSIONS
The code for PID controller tuning is written in MATLAB. The best values of PID controller parameters i.e. the gains kp, kd and ki obtained using GA are used in
PIDGA blocks of two area LFC block diagram (Fig.2) drawn in MATLAB/Simulink. The power system parameters used here are given in Table I.
The DISCOs of this problem take power from the GENCOs according to the DPM. Here it is assumed that the each element of DPM has a value of 0.5. At the same time each GENCO participates in automatic generation control according to the area participation factors apf1 =
0.5 and apf2 = 0.5
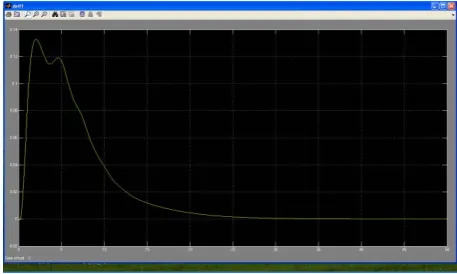
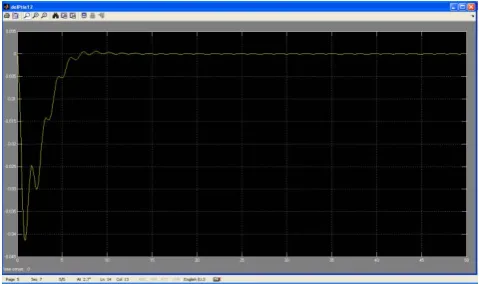
Initially the system is run without the use of the controller due to the load change in area1 under deregulation. But it is found that the system is unstable. The tie line power deviation due to load change in area1 in two area load frequency control without controller is shown in Fig. 3. Hence with the application of PID controller the simulation is done again for the change of load in area1 by 0.1 pu in deregulated environment. The corresponding frequency deviations in area1 and area2 are shown in Fig. 4 and Fig. 5 respectively. The values of PID controller gains obtained through GA are shown in Table II. The tie line power deviation is depicted in Fig. 6.
TABLE I POWER SYSTEM DATA
Power SYSTEM DATA Values
generator time constants Tg1, Tg2 0.2 s
turbine time constants Tt1, Tt2 0.3 s
power system gains Kp1, Kp2 120 Hz/pu MW
power system time constants 20 s
B1, B2 0.425pu MW/Hz
speed regulation of governors R1, R2 2.4 Hz/pu MW
s = second, W = watt, M = mega.
TABLE II VALUES OF PID GAINS
Area kp ki
kd
1 0.224 0.414 0.231 2 0.224 0.414 0.231
TABLE III PERFORMANCE STUDY
Parameters ∆F1 ∆F2 ∆Ptie12actual
Settling time (s) 12.562 12.44 10.155
Rise time (s) 0.5086 0.466 4.3678
% Peak Overshoot 13 17 9
[image:4.595.322.551.229.364.2]The two area power system without PIDGA was simulated initially and it showed unstable response. With the application of GA tuned PID controller, the system became stable. The system performances based on the settling time, rise time and % peak overshoot are shown in Table III.
[image:4.595.324.553.404.541.2]Fig. 3. Tie line power deviation (in pu) with respect to time (in sec) due to change in load of area1 without any PID controller.
Fig. 4. Frequency deviation with respect to time (in sec) in area1 due to 0.1 pu load change in area1
[image:4.595.66.260.552.643.2] [image:4.595.323.553.580.715.2]Fig. 6. Tie line power deviation (in pu ) with respect to time (in sec)due to change in load of area1
[image:5.595.46.284.61.188.2]It is observed from Table III that peak overshoot is well below 25%, settling time and rise time are also within limits i.e. the steady state frequency is restored within 12 sec (approximately) after the sudden change of load in area1. The tie line power characteristics shows that the 0.1 pu change of load in area 1 is shared by both the GENCOs as per the DPM matrix. It means that the 0.05 pu load will be supplied from GENCO 2 to DISCO 1. An interconnected power system having same parameters that of the power system chosen here was simulated using PSO based PID controller under deregulation in another work [14]. A comparison of the frequency deviation characteristics of these two works reveals that the numbers of oscillations have been reduced in case of PIDGA (Fig. 3 and 4) in deregulated environment.
Fig. 7. Tie line power error i.e.Ptie12error (in pu) with respect to time
(in s) due to 0.1 pu change in load of area1 without deregulation
[image:5.595.45.292.438.579.2]Fig. 8. Tie line power deviation (in pu) with respect to time (in sec) due to 0.1 pu change in load of area1 without deregulation.
Fig. 7 shows the tie line power error i.e.Ptie12errorversus time. It is clear from the plot that the steady state value of tie line power error is zero and its settling time is less than 4 sec (2% basis). Fig. 8 depicts the tie line power deviation in two area load frequency control system without deregulation, the steady state value of which is zero. But the corresponding tie line power deviation plot with deregulation is smooth and has less oscillations than that without deregulation.
V. CONCLUSION
In this work, two area load frequency control is established under deregulation. The PID controller which is used to bring the system dynamics within comfortable limits is tuned with the help of genetic algorithm. With the variation of load in one area, the deregulated system response is better than the system without deregulation in terms of numbers of oscillations and at the same time the load change is accommodated by the GENCOs of both the areas without overloading any one of them.
REFERENCES
[1] A. G. Kagiannas, D. T. Askounis and J. Psarras “Power generation planning: from monopoly to competetion” Electrical Power and Energy Systems, vol. 26, pp. 413–421, November 2004.
[2] J. Sadeh and E. Rakhshani, “Multi-Area load frequency control in a deregulated power system using optimal output feedback control”, 5th Int. Conf. on European Electricity Market, May, 2008,
pp.1-6.
[3] W. Tan, H. Zhang and M. Yu, “Decentraliszed load frequency control in deregulated environment”, Electrical Power and Energy
Systems, vol. 41, pp. 16-26, March, 2012.
[4] H. Sadat. (2002). Power System Analysis (2nd edition), TATA McGraw Hill, NewDelhi
[5] V. Donde, M. A. Pai, and L. A. Hiskens, "Simulation and optimization in an AGC system after deregulation", IEEE Trans.
on Power Systems, vol.l6, no. 3, pp. 481- 489, August 2001
[6] F. Liu, Y.H. Song, J. Ma, S. Mei and Q. Lu, “Optimal load-frequency control in restructured power systems,” IEE
Proc.-Gener. Transm. Distrib., vol. 150, no. 1, January 2003.
[7] E. Rakhshani & J. Sadeh, "Simulation of two-area AGC system in a competitive environment using reduced-order observer method", in Proc of IEEE conf, April 2008.
[8] N. Sinha, Loi Lei Lai, and V.G Rao, "GA Optimized PID Controllers for Automatic Generation Control of Two Area Reheat Thermal Systems Under Deregulated Environment", in
IEEE conference on Electrical utility DRPT , 2008, pp.
1186-1191.
[9] J. Nanda, S. Mishra and Lalit Chandra Saikia, "Maiden Application of Bacterial Foraging Based Optimization Technique in Multi-area Automatic Generation Control", IEEE Transactions on Power
Systems, vo1.24, no.2, pp. 602-609, May, 2009
[10] S. Debbarma and L. C. Saikia, “Bacterial Foraging Based FOPID Controller in AGC of an Interconnected Two-Area Reheat Thermal System Under Deregulated Environment”, in
International Conference On Advances In Engineering, Science
And Management (ICAESM-2012), March 30-31, 2012, pp.
303-08.
[11] E. S. Ali, S. M. Abd-Elazim, “BFOA based design of PID controller for two area load frequency with nonlinearities”,
Electrical Power and Energy Systems, vol. 51, pp. 224-231, April,
2013.
[12] R. K. Sahu, S. Panda, U. K. Rout “DE optimized parallel 2-DOF PID controller for load frequency control of power system with governor dead-band nonlinearity”, Electrical Power and Energy
Systems, vol. 49, pp. 19-33, February, 2013.
[image:5.595.46.286.619.761.2][14] A. M. Jadhav and K. Vadirajacharya, “Performance verification of PID controller in an interconnected power system using particle swarm optimization”, Energy Procedia, vol.14, pp. 2075- 2080, 2012.
[15] K. Ogata, (2010), Modern Control Engineering, (5th Edition),
Pearson Education Limited