Supported by the Grant Agency of the Academy of Sciences of the Czech Republic (Project No. IAA400400806).
Long-term effect of diet amended by risk elements
contaminated soils on risk element penetration
and physiological parameters of rats
V. Vlčková
1, M. Malinová
1, B. Koubková
1, J. Száková
1, V. Zídek
2,
A. Fučíková
1, J. Zídková
3, D. Kolihová
1, P. Tlustoš
11Faculty of Agrobiology, Food and Natural Resources, Czech University of Life Sciences Prague,
Prague, Czech Republic
2Institute of Physiology, Academy of Sciences of the Czech Republic, Prague, Czech Republic
3Faculty of Food and Biochemical Technology, Institute of Chemical Technology Prague,
Prague, Czech Republic
ABSTRACT: The long-term accumulation of risk elements (As, Cd, Pb) originated from differently contami-nated soils in rat organism was investigated during a model two-generation experiment. The effect of soil con-tamination level, gender, and length of exposure as well as the interactions between risk elements and selected essential macro- and microelements were studied. Rat diet contained 10% of individual soils (based on dry
weight): (i) Fluvisol heavily polluted by As, Cd, Zn, and Pb, (ii) Luvisol contaminated by As, Cd, and Zn, and
(iii) uncontaminated Chernozem. Male and female Wistar rats used for the experiment were housed in cages
in a room with controlled temperature for 60 days and were fed ad libitum the mentioned diets. Subsequently,
the pregnant females were continuously fed the experimental diet until weaning when the young animals were separated to male and female and fed the experimental diet till day 110 of age. The element contents in rat tissues reflected the risk element contents in contaminated soils. The bioaccessibility and bioavailability of the risk elements decreased in the order Cd>As>Pb and was affected by the soil physicochemical parameters. No significant differences were observed between male and female rats as well as between the first and the second generation. However, interactions were reported among the risk elements where the high cadmium content in Fluvisol resulted in increasing arsenic accumulation in the rat liver. Moreover, arsenic–copper interactions were observed where significant increase of the copper level was determined in kidney of the animals fed Luvisol exceeding 50-fold the maximum permissible limits for As content in agricultural soils. Among the hematological and biochemical characteristics of rats, total erythrocyte count (Er), hematocrit (Hct) increased confirming adverse effect of soil-derived risk elements especially in male rats.
Keywords:risk elements; soil; soil ingestion; liver; kidney; blood; Rattus norvegicus
INTRODUCTION
The potential environmental impact of risk elements originated from mining and smelting activities is widely investigated from various as-pects where the potential health risk for popula-tion living in the vicinity of these locapopula-tions is predominantly highlighted. There are two main
potential risk of soil ingestion in the vicinity of zinc, lead, and manganese mines. However, the potential risk of the ingestion of soil-derived risk elements depends on individual mining areas and element levels in the soils in the vicinity of the mine and also on bioavailability of individual elements in the soils (Noble et al. 2010; Szakova et al. 2012). As already mentioned in our previous work, the inhabitants living in element contaminated area are long-term exposed to the contaminated soil and the impact of risk elements should be evaluated also from biochemical, physiological, and hemato-logical point of view (Amaral et al. 2007). Fischer et al. (2003) observed significant changes of selected hematological parameters in blood of children long-term exposed to enhanced concentrations of lead and cadmium close to a smelter. Phagocytic activity and some hematological parameters are known to be highly susceptible to alterations of nutritional and environmental factors including trace elements (Kostic et al. 1993). Ognjanovic et al. (2003) studied the impact of acute cadmium exposition of rats on hematological and immunological parameters as well as on the activities of lipid peroxidases and the potential role of vitamin E. They proved decreasing number of erythrocytes, hematocrit values, and hemoglobin concentrations in the exposed animals. The increased activity of antioxidative enzymes was observed, as well. Woods and Fowler (1977) and Bhadauria and Flora (2007) investigated the impact of mammal chronic exposition to arsenic where the adverse effect on the heme biosynthesis in liver was observed. The effect of risk elements on rat biochemical characteristics was reported in our previous investigation especially in the case of white blood cells (Szakova et al. 2012). Compa-rably, Castro et al. (2009) described the effect of arsenic on lymphocyte count and functions where low arsenic concentrations increased the number of T-lymphocytes whereas increasing As uptake decreased.
Instead of the direct adverse effect of the risk elements, potential effect of element inter-actions affecting the balance of nutrients in the animal organism could be taken into account. For example, calcium and/or zinc deficiency can result in increasing resorption of lead and cad-mium (Bencko et al. 1995). Increased Cd, Cu, and Pb levels were observed in the blood of anaemic children (Turgut et al. 2007). Similarly, daily rat
exposition to 15 mg/kg CdCl2 for 30 days resulted
in anaemia followed by the changes in the
meta-bolism and antioxidative activity of erythrocytes (Kostic et al. 1993). This effect has already been described by Prigge et al. (1977) presenting rat anaemia due to increased Cd uptake in feed (up to 31 mg/kg). Paul et al. (2002) reported higher arsenic accumulation in liver of iron-deficient rats compared to the animals with optimal iron uptake.
On the contrary, the increased Cd uptake can lead to suppressed resorption of iron, copper, zinc, cobalt etc., especially in the pregnant organism where the faetus development could be adversely affected due to the nutrient imbalance and lower bioavailability of the nutrients for the faetus (Bencko et al. 1995; Chmielnicka and Sowa 1996). The increased cadmium contents in the animal organism can affect the metabolism of many other essential elements such as selenium, manganese, chromium, magnesium, sodium, potassium, etc. (Matovic et al. 2011). Therefore, the supplementation of the organism with essential elements can lead to improvement of animal health status as described by Kusakabe et al. (2008) in the case of Fe, Cu, and Zn. Matovic et al. (2011) reported the effects and interactions of magnesium and zinc supplementation in this context.
The animals can be exposed to either single dose of contaminated soil suspension (Ellickson et al. 2001) or to long-term consumption of diet amended by the contaminated soil (Hetiarachchi et al. 2003). According to the results of the mentioned studies and our expertize, the following hypotheses
were set up: (i) the risk elements contained in
the contaminated soils can affect the whole rat organism in dependence on gender and exposition
length, (ii) the exposure of the rat organisms to
MATERIAL AND METHODS
Experimental design. Twenty-four male and the same number of female Wistar rats (average body weight 251 ± 2 g for male, 185 ± 2 g for female rats, respectively) were obtained from the breeder (Velaz Ltd., Prague, Czech Republic) at 30 days of age and housed in cages (1 animal per cage) in a room with controlled temperature (varying from 23 to 25°C) under natural light conditions. The animals were randomly divided into 4 groups per 6 animals and fed a semi-synthetic diet according to the experimental design for 60 days. Subsequently, the females were fertilized by the male individuals and the males were euthanized. The whole blood samples were taken from all the animals. Pregnant females were continuously fed the experimental diet until weaning when the young animals were separated to male and female and divided again into 4 groups per 6 animals and fed the experimental diets till day 110 of age when the experiment was terminated. Feed and water were supplied to the
animals ad libitum, feed consumption and body
weight of animals were monitored weekly. The control group was fed the untreated semi-synthetic diet consisting from 50% of wheat coarse meal, 13% of fish meal, 14% of soybean meal, 0.28% of
CaHPO4, 1.12% of limestone, 4% of alfalfa hay,
1% of mineral additives (Aminovitan STER PLUS, Biofaktory Ltd., Prague, Czech Republic), 7.5% of feeding yeast, 4.5% of wheat germs, and 10% of oat meal. In the case of treated groups defined portions
of individual soils were mixed with the mentioned semi-synthetic diet to obtain final percentage of 10% soil from final weight of the diet. The soils
used for diet amendment were: (i) Fluvisol from
the alluvium of the Litavka River, Czech Republic, heavily polluted by wastes from smelter setting pits
(soil L), (ii) Kutná Hora soil (Luvisol) contaminated
by arsenic, cadmium, and zinc mainly due to tailings of silver mining in the Middle Ages (soil K), and
(iii) uncontaminated Chernozem (soil S). Before
mixing, the soils were air-dried, homogenized, grinded, and passed through a 2-mm plastic sieve. The total element contents in soils, diet, and soil-amended diet are summarized in Table 1 and main physicochemical parameters of the soils in Table 2. After the termination of the individual parts of the experiment the animals were euthanized by exsanguination after anaesthetizing with Xylapan (xylasin) and Narketan (ketamin) and whole blood
(only in the 1st generation), liver, and kidney were
sampled. The sampled tissues were kept at –18°C, freeze-dried, and homogenized; aliquots of blood
samples were treated by K2EDTA, and immediately
used for determination of hematological param-eters whereas remaining blood was sedimented to obtain serum samples for determination of both risk and essential elements as well as the selected biochemical parameters.
[image:3.595.66.534.536.737.2]Analytical methods. Pressurized wet ashing: An aliquot (~500 mg of dry matter) of the freeze-dried liver and whole kidney samples from the individual animals, or experimental diet were weighed into a
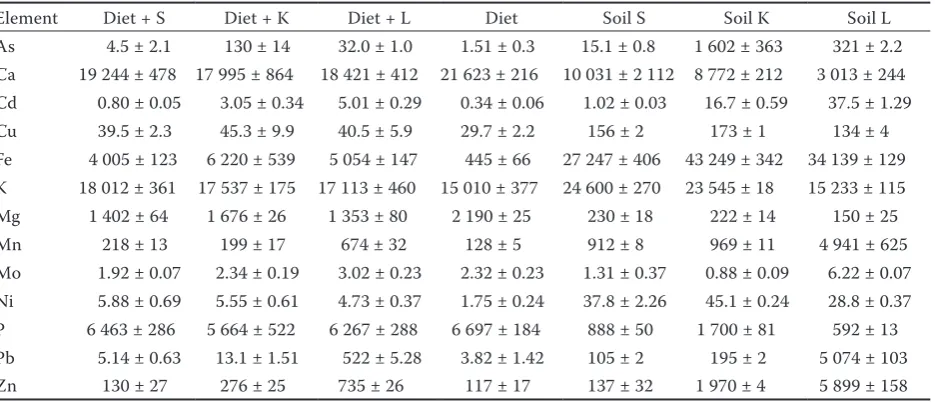
Table 1. Total content of elements in individual soils, diet, and diet amended by 10% of the soil (mg/kg of dry matter)
Element Diet + S Diet + K Diet + L Diet Soil S Soil K Soil L
As 4.5 ± 2.1 130 ± 14 32.0 ± 1.0 1.51 ± 0.3 15.1 ± 0.8 1 602 ± 363 321 ± 2.2
Ca 19 244 ± 478 17 995 ± 864 18 421 ± 412 21 623 ± 216 10 031 ± 2 112 8 772 ± 212 3 013 ± 244
Cd 0.80 ± 0.05 3.05 ± 0.34 5.01 ± 0.29 0.34 ± 0.06 1.02 ± 0.03 16.7 ± 0.59 37.5 ± 1.29
Cu 39.5 ± 2.3 45.3 ± 9.9 40.5 ± 5.9 29.7 ± 2.2 156 ± 2 173 ± 1 134 ± 4
Fe 4 005 ± 123 6 220 ± 539 5 054 ± 147 445 ± 66 27 247 ± 406 43 249 ± 342 34 139 ± 129
K 18 012 ± 361 17 537 ± 175 17 113 ± 460 15 010 ± 377 24 600 ± 270 23 545 ± 18 15 233 ± 115
Mg 1 402 ± 64 1 676 ± 26 1 353 ± 80 2 190 ± 25 230 ± 18 222 ± 14 150 ± 25
Mn 218 ± 13 199 ± 17 674 ± 32 128 ± 5 912 ± 8 969 ± 11 4 941 ± 625
Mo 1.92 ± 0.07 2.34 ± 0.19 3.02 ± 0.23 2.32 ± 0.23 1.31 ± 0.37 0.88 ± 0.09 6.22 ± 0.07
Ni 5.88 ± 0.69 5.55 ± 0.61 4.73 ± 0.37 1.75 ± 0.24 37.8 ± 2.26 45.1 ± 0.24 28.8 ± 0.37
P 6 463 ± 286 5 664 ± 522 6 267 ± 288 6 697 ± 184 888 ± 50 1 700 ± 81 592 ± 13
Pb 5.14 ± 0.63 13.1 ± 1.51 522 ± 5.28 3.82 ± 1.42 105 ± 2 195 ± 2 5 074 ± 103
Zn 130 ± 27 276 ± 25 735 ± 26 117 ± 17 137 ± 32 1 970 ± 4 5 899 ± 158
digestion vessel. Concentrated nitric acid (8.0 ml)
and 30% H2O2 (2.0 ml) (both Analytika Ltd., Prague,
Czech Republic) were added. The mixture was heated in an Ethos 1 (MLS GmbH, Leutkirch, Germany) microwave assisted wet digestion system at 220°C for 30 min. After cooling, the digest was quantitatively transferred into a 20 ml glass tube and filled up to the volume by deionized water (Jankovska et al. 2010). The total concentrations of trace elements in the soils were determined in the digests obtained by the following decomposi-tion procedure: aliquots (0.5 g) of air-dried soil samples were decomposed in a digestion vessel with a mixture of 8 ml of concentrated nitric acid, 5 ml of hydrochloric acid, and 2 ml of concentrated hydrofluoric acid. The mixture was heated in an Ethos 1 (MLS GmbH) microwave assisted wet digestion system at 210°C for 33 min. After cool-ing, the digest was quantitatively transferred into
a 50 ml Teflon® vessel and evaporated to dryness
at 160°C. The digest was then dissolved in 3 ml of nitric and hydrochloric acid mixture (1 : 3), transferred into a 25 ml glass tube, filled up by deionized water, and kept at laboratory tempera-ture until measurement. In the case of serum, the samples were diluted before measurement without any other sample preparation.
The total contents of elements in the digests were determined by optical emission spectroscopy with inductively coupled plasma (ICP-OES) with axial plasma configuration, Varian VistaPro, equipped with SPS-5 autosampler (Varian Inc., Mulgrave, Australia). Measurement conditions were for all lines: power 1.2 kW, plasma flow 15.0 l/min, auxiliary flow 0.75 l/min, nebulizer flow 0.9 l/min. Low concentrations of As, Cd, Cr, Ni, and Pb in the digests and serum were determined by electro-thermal atomic absorption spectrometry (ETAAS) using the instrument VARIAN AA280Z (Varian Inc.) equipped with GTA120 graphite tube at-omizer, and by inductively coupled plasma mass
spectrometry using the apparatus Agilent 7700x ICP-MS (Agilent Technologies Inc., Santa Clara, USA) equipped with an auto-sampler ASX-500, a three channel peristaltic pump, and a MicroMist nebulizer. The contents of Ca, Mg, and K in the digests were determined by flame atomic absorp-tion spectrometry (Varian 280FS; Varian Inc.).
Among the hematological parameters total num-ber of erythrocytes (Er; T/l), hemoglobin (Hb; g/100 ml), hematocrit value (Hct; %), mean cell volume (MCV; fl), and total number of leukocytes (Le; g/l) were determined in the whole blood
stabi-lized by K2EDTA. All parameters were determined
on a computerized analyzer MEK 5208 Celltac (NIHON KOHDEN Corp., Tokyo, Japan). For the determination of the number of leukocytes and hemoglobin values the blood hemolysis solution Isotonac 3 MEK 640 (NIHON KOHDEN Corp.) was used. In the case of biochemical parameters (aspartate transaminase (AST), alkaline phosphatase (ALP), total protein, urea, and glucose contents) and Ca, Mg, and P contents in blood serum were determined by using a computerized analyzer Cobas 6000 (Roche, Basel, Switzerland).
Statistical analysis. The data obtained were subjected to Dixon’s test for identification of out-liers (significance level α = 0.05) using MS Excel 2007. Subsequently, two-way analysis of variance and linear correlation analysis were used at the significance level α = 0.05 (STATISTICA, Version 9.1, 2011).
RESULTS
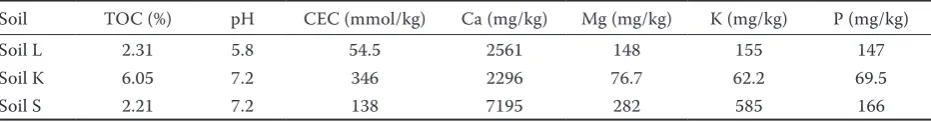
[image:4.595.65.531.115.176.2]The effect of the contaminated soil addition on total element contents in the experimental diets as well as the bioavailability of individual elements determined as the element portion extractable with simulated gastric and pancreatic solution (Ruby et al. 1996) was discussed in detail in our previous paper (Szakova et al. 2012). We can summarize Table 2. Main physicochemical parameters of experimental soils and available contents of main nutrients according to Mehlich III soil extraction procedure (Mehlich 1984)
Soil TOC (%) pH CEC (mmol/kg) Ca (mg/kg) Mg (mg/kg) K (mg/kg) P (mg/kg)
Soil L 2.31 5.8 54.5 2561 148 155 147
Soil K 6.05 7.2 346 2296 76.7 62.2 69.5
Soil S 2.21 7.2 138 7195 282 585 166
that the relatively high contents of As, Cd, and Pb
in the soils K and L resulted in significantly (P <
0.05) increased contents of these elements in the amended diets (Table 1). Moreover, the element contents extractable with simulated gastric solution confirmed higher bioaccessible contents of risk elements in the contaminated soils. The extract-able portions of elements increased in the order soil S < soil K < soil L for Cd, Cu, Fe, Pb, and Zn, and opposite pattern for As, Mn, and P. The effect of soil physicochemical parameters (Table 2) was not significant.
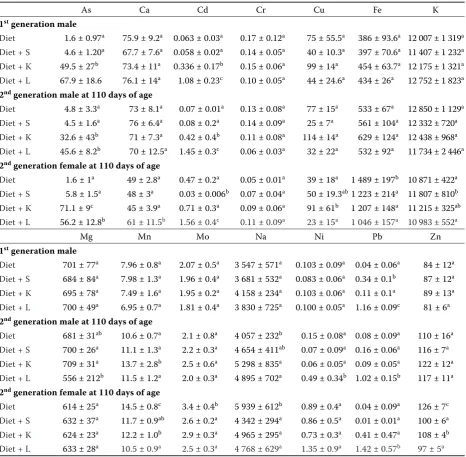
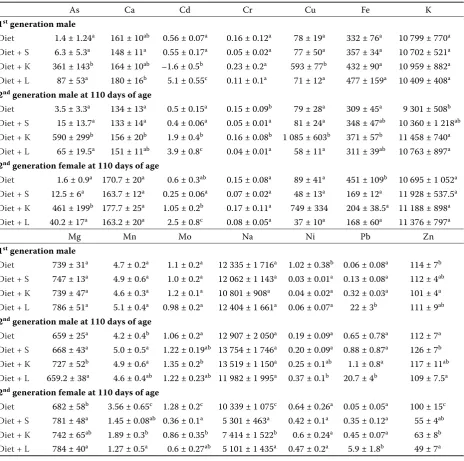
Body weight of the animals was monitored (Ta-ble 3) as well as the total body weight gain and feed consumption. No significant changes were observed among the experimental groups although both body weight and weight gain of the litter from females fed the diet amended by the soil L tended to decrease. The contents of both risk and essential elements in liver, kidney, and serum of the animals are summarized in Tables 4–6. The arsenic contents in liver varied between 0.55 ± 0.23 mg/kg (diet) and 48.8 ± 5.8 mg/kg (diet + K), in kidney between 1.09 ± 0.60 mg/kg (diet) and 47.2 ± 9.6 mg/kg (diet + K); the cadmium content in liver varied between 0.03 ± 0.01 mg/kg (soil S) and 0.90 ± 0.15 mg/kg (diet + L), in kidney between 0.11 ± 0.05 mg/kg (diet) and 3.54 ± 1.76 mg/kg (diet + L); the lead content in liver between 0.08 ± 0.08 mg/kg (diet) and 0.74 ± 0.22 mg/kg (diet + L), in kidney between 0.09 ± 0.02 mg/kg (diet) and 20.8 ± 2.8 mg/kg (diet + L). The pattern of risk elements was comparable regardless of the generation and higher risk element contents (Cd and Pb) were found in kidney. Arsenic contents
in kidney of the 2nd generation rats tended to
increase especially in the case of the animals fed the As contaminated soil K.
Among the other investigated elements,
sig-nificant (P < 0.05) increase of copper contents
in kidney of the 1st generation and both liver and
kidney in the 2nd generation of the animals fed
the diet containing As-contaminated soil K was reported. Because the Cu contents and bioavail-ability of copper in this soil did not differ from the remaining experimental soils we can anticipate As-Cu interaction observed also by other authors (Birri et al. 2010). The levels of other macro- and
micronutrients were not significantly (P < 0.05)
changed due to increased risk element uptake. However, a slight decrease of Fe, Na, and Mn
contents in kidney of the 2nd generation female
Ta
ble 3. B
ody weig
ht and t
ot
al weig
ht g
ain (
g) of t
he animal s monit or ed dur ing t he e xp er imen t ( n
= 6; me
an ± st
and ar d de vi ation) 1
st genera
tion
2
nd genera
tion
at 110 d
ay
s of age
male female lit ter 30 d ay s 90 d ay s weig ht g ain 30 d ay s 90 d ay s weig ht g ain 1 d ay 30 d ay s weig ht g ain male female Die t
250 ± 24
514
± 24
265 ± 46
184 ± 8 336 ± 22 152 ± 19 87 ± 8 1152 ± 74 1066 ± 67
482 ± 18
285 ± 23
Die
t + S
253 ± 12 502 ± 18 249 ± 20 188 ± 12 338 ± 18 150 ± 12 94 ± 8 1110 ± 210 1016 ± 206
453 ± 20
289 ± 27
Die
t + K
253 ± 15 511 ± 27 258 ± 27 186 ± 14 353 ± 23 167 ± 34 101 ± 13 1120 ± 108 1099 ± 95
505 ± 99
278 ± 15
Die
t + L
248 ± 7 499 ± 47 252 ± 44 183 ± 13 326 ± 22 143 ± 28 87 ± 14 1076 ± 178 989 ± 167
481 ± 41
275 ± 18
L = Fluv
is
ol, K = L
uv
is
ol, S = unc
on tamina te d C her no zem value
s do not sig
nific an tly diff er a t P
< 0.05 w
ithin indiv
idu
al c
Table 4. Element contents (mg/kg of dry matter) in liver of the animals (n = 6; mean ± standard deviation)
As Ca Cd Cr Cu Fe K
1st generation male
Diet 1.6 ± 0.97a 75.9 ± 9.2a 0.063 ± 0.03a 0.17 ± 0.12a 75 ± 55.5a 386 ± 93.6a 12 007 ± 1 319a
Diet + S 4.6 ± 1.20a 67.7 ± 7.6a 0.058 ± 0.02a 0.14 ± 0.05a 40 ± 10.3a 397 ± 70.6a 11 407 ± 1 232a
Diet + K 49.5 ± 27b 73.4 ± 11a 0.336 ± 0.17b 0.15 ± 0.06a 99 ± 14a 454 ± 63.7a 12 175 ± 1 321a
Diet + L 67.9 ± 18.6 76.1 ± 14a 1.08 ± 0.23c 0.10 ± 0.05a 44 ± 24.6a 434 ± 26a 12 752 ± 1 823a
2nd generation male at 110 days of age
Diet 4.8 ± 3.3a 73 ± 8.1a 0.07 ± 0.01a 0.13 ± 0.08a 77 ± 15a 533 ± 67a 12 850 ± 1 129a
Diet + S 4.5 ± 1.6a 76 ± 6.4a 0.08 ± 0.2a 0.14 ± 0.09a 25 ± 7a 561 ± 104a 12 332 ± 720a
Diet + K 32.6 ± 43b 71 ± 7.3a 0.42 ± 0.4b 0.11 ± 0.08a 114 ± 14a 629 ± 124a 12 438 ± 968a
Diet + L 45.6 ± 8.2b 70 ± 12.5a 1.45 ± 0.3c 0.06 ± 0.03a 32 ± 22a 532 ± 92a 11 734 ± 2 446a
2nd generation female at 110 days of age
Diet 1.6 ± 1a 49 ± 2.8a 0.47 ± 0.2a 0.05 ± 0.01a 39 ± 18a 1 489 ± 197b 10 871 ± 422a
Diet + S 5.8 ± 1.5a 48 ± 3a 0.03 ± 0.006b 0.07 ± 0.04a 50 ± 19.3ab1 223 ± 214a 11 807 ± 810b
Diet + K 71.1 ± 9c 45 ± 3.9a 0.71 ± 0.3a 0.09 ± 0.06a 91 ± 61b 1 207 ± 148a 11 215 ± 325ab
Diet + L 56.2 ± 12.8b 61 ± 11.5b 1.56 ± 0.4c 0.11 ± 0.09a 23 ± 15a 1 046 ± 157a 10 983 ± 552a
Mg Mn Mo Na Ni Pb Zn
1st generation male
Diet 701 ± 77a 7.96 ± 0.8a 2.07 ± 0.5a 3 547 ± 571a 0.103 ± 0.09a 0.04 ± 0.06a 84 ± 12a
Diet + S 684 ± 84a 7.98 ± 1.3a 1.96 ± 0.4a 3 681 ± 532a 0.083 ± 0.06a 0.34 ± 0.1b 87 ± 12a
Diet + K 695 ± 78a 7.49 ± 1.6a 1.95 ± 0.2a 4 158 ± 234a 0.103 ± 0.06a 0.11 ± 0.1a 89 ± 13a
Diet + L 700 ± 49a 6.95 ± 0.7a 1.81 ± 0.4a 3 830 ± 725a 0.100 ± 0.05a 1.16 ± 0.09c 81 ± 6a
2nd generation male at 110 days of age
Diet 681 ± 31ab 10.6 ± 0.7a 2.1 ± 0.8a 4 057 ± 232b 0.15 ± 0.08a 0.08 ± 0.09a 110 ± 16a
Diet + S 700 ± 26a 11.1 ± 1.3a 2.2 ± 0.3a 4 654 ± 411ab 0.07 ± 0.09a 0.16 ± 0.06a 116 ± 7a
Diet + K 709 ± 31a 13.7 ± 2.8b 2.5 ± 0.6a 5 298 ± 835a 0.06 ± 0.05a 0.09 ± 0.05a 122 ± 12a
Diet + L 556 ± 212b 11.5 ± 1.2a 2.0 ± 0.3a 4 895 ± 702a 0.49 ± 0.34b 1.02 ± 0.15b 117 ± 11a
2nd generation female at 110 days of age
Diet 614 ± 25a 14.5 ± 0.8c 3.4 ± 0.4b 5 939 ± 612b 0.89 ± 0.4a 0.04 ± 0.09a 126 ± 7c
Diet + S 632 ± 37a 11.7 ± 0.9ab 2.6 ± 0.2a 4 342 ± 294a 0.86 ± 0.5a 0.01 ± 0.01a 100 ± 6a
Diet + K 624 ± 23a 12.2 ± 1.0b 2.9 ± 0.3a 4 965 ± 295a 0.73 ± 0.3a 0.41 ± 0.47a 108 ± 4b
Diet + L 633 ± 28a 10.5 ± 0.9a 2.5 ± 0.3a 4 768 ± 629a 1.35 ± 0.9a 1.42 ± 0.57b 97 ± 5a
L = Fluvisol, K = Luvisol, S = uncontaminated Chernozem
a–caverages marked by the same letter do not significantly differ at P < 0.05 within individual columns
rats fed the soil-containing diets was observed most probably due to lower bioavailability of these elements in soil compared to the unamended diet. Although the Zn content in the soil L was extremely high compared to other soils, in liver and kidney it even tended to decrease. Due to high cadmium content in the soil L the potential adverse effect of Cd on Zn uptake and accumulation can be taken into account (Chmielnicka and Sowa 1996; Matovic et al. 2011).
In the case of blood serum (Table 6), where only
the 1st generation of the animals was studied,
the diet containing soil K could be also credited to cadmium.
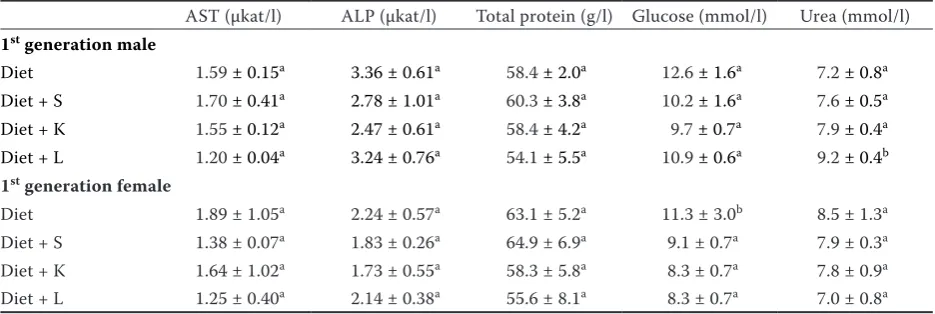
The contents of selected biochemical parame- ters determined in blood serum of the animals are summarized in Table 7. Among the enzymes indicating potential adverse effect of enhanced risk element content in feed on liver function, AST and ALP activity was assessed where no significant
changes (P < 0.05) among the experimental groups
were observed. However, the results showed a
significantly (P < 0.05) increased concentration
of urea in male rat serum indicating potential
[image:7.595.66.531.100.561.2]cadmium-induced renal damage. El-Demerdash et al. (2004) and Borgese et al. (2008) suggested the enhanced serum urea concentrations as the first indicator of cadmium induced reversible kidney injury. Moreover, the addition of soil itself resulted in decreasing female serum glucose whereas male samples remained unchanged. Differences between male and female glucose levels in serum of rats exposed to arsenic and lead via drinking water due to significant increase in intestinal glucose absorption by male rats was observed by Palacios et al. (2012). In our case, however, the results sug- Table 5. Element contents (mg/kg of dry matter) in kidney of the animals (n = 6; mean ± standard deviation)
As Ca Cd Cr Cu Fe K
1st generation male
Diet 1.4 ± 1.24a 161 ± 10ab 0.56 ± 0.07a 0.16 ± 0.12a 78 ± 19a 332 ± 76a 10 799 ± 770a
Diet + S 6.3 ± 5.3a 148 ± 11a 0.55 ± 0.17a 0.05 ± 0.02a 77 ± 50a 357 ± 34a 10 702 ± 521a
Diet + K 361 ± 143b 164 ± 10ab –1.6 ± 0.5b 0.23 ± 0.2a 593 ± 77b 432 ± 90a 10 959 ± 882a
Diet + L 87 ± 53a 180 ± 16b 5.1 ± 0.55c 0.11 ± 0.1a 71 ± 12a 477 ± 159a 10 409 ± 408a
2nd generation male at 110 days of age
Diet 3.5 ± 3.3a 134 ± 13a 0.5 ± 0.15a 0.15 ± 0.09b 79 ± 28a 309 ± 45a 9 301 ± 508b
Diet + S 15 ± 13.7a 133 ± 14a 0.4 ± 0.06a 0.05 ± 0.01a 81 ± 24a 348 ± 47ab 10 360 ± 1 218ab
Diet + K 590 ± 299b 156 ± 20b 1.9 ± 0.4b 0.16 ± 0.08b 1 085 ± 603b 371 ± 57b 11 458 ± 740a
Diet + L 65 ± 19.5a 151 ± 11ab 3.9 ± 0.8c 0.04 ± 0.01a 58 ± 11a 311 ± 39ab 10 763 ± 897a
2nd generation female at 110 days of age
Diet 1.6 ± 0.9a 170.7 ± 20a 0.6 ± 0.3ab 0.15 ± 0.08a 89 ± 41a 451 ± 109b 10 695 ± 1 052a
Diet + S 12.5 ± 6a 163.7 ± 12a 0.25 ± 0.06a 0.07 ± 0.02a 48 ± 13a 169 ± 12a 11 928 ± 537.5a
Diet + K 461 ± 199b 177.7 ± 25a 1.05 ± 0.2b 0.17 ± 0.11a 749 ± 334 204 ± 38.5a 11 188 ± 898a
Diet + L 40.2 ± 17a 163.2 ± 20a 2.5 ± 0.8c 0.08 ± 0.05a 37 ± 10a 168 ± 60a 11 376 ± 797a
Mg Mn Mo Na Ni Pb Zn
1st generation male
Diet 739 ± 31a 4.7 ± 0.2a 1.1 ± 0.2a 12 335 ± 1 716a 1.02 ± 0.38b 0.06 ± 0.08a 114 ± 7b
Diet + S 747 ± 13a 4.9 ± 0.6a 1.0 ± 0.2a 12 062 ± 1 143a 0.03 ± 0.01a 0.13 ± 0.08a 112 ± 4ab
Diet + K 739 ± 47a 4.6 ± 0.3a 1.2 ± 0.1a 10 801 ± 908a 0.04 ± 0.02a 0.32 ± 0.03a 101 ± 4a
Diet + L 786 ± 51a 5.1 ± 0.4a 0.98 ± 0.2a 12 404 ± 1 661a 0.06 ± 0.07a 22 ± 3b 111 ± 9ab
2nd generation male at 110 days of age
Diet 659 ± 25a 4.2 ± 0.4b 1.06 ± 0.2a 12 907 ± 2 050a 0.19 ± 0.09a 0.65 ± 0.78a 112 ± 7a
Diet + S 668 ± 43a 5.0 ± 0.5a 1.22 ± 0.19ab 13 754 ± 1 746a 0.20 ± 0.09a 0.88 ± 0.87a 126 ± 7b
Diet + K 727 ± 52b 4.9 ± 0.6a 1.35 ± 0.2b 13 519 ± 1 150a 0.25 ± 0.1ab 1.1 ± 0.8a 117 ± 11ab
Diet + L 659.2 ± 38a 4.6 ± 0.4ab 1.22 ± 0.23ab 11 982 ± 1 995a 0.37 ± 0.1b 20.7 ± 4b 109 ± 7.5a
2nd generation female at 110 days of age
Diet 682 ± 58b 3.56 ± 0.65c 1.28 ± 0.2c 10 339 ± 1 075c 0.64 ± 0.26a 0.05 ± 0.05a 100 ± 15c
Diet + S 781 ± 48a 1.45 ± 0.08ab 0.36 ± 0.1a 5 301 ± 463a 0.42 ± 0.1a 0.35 ± 0.12a 55 ± 4ab
Diet + K 742 ± 65ab 1.89 ± 0.3b 0.86 ± 0.35b 7 414 ± 1 522b 0.6 ± 0.24a 0.45 ± 0.07a 63 ± 8b
Diet + L 784 ± 40a 1.27 ± 0.5a 0.6 ± 0.27ab 5 101 ± 1 435a 0.47 ± 0.2a 5.9 ± 1.8b 49 ± 7a
L = Fluvisol, K = Luvisol, S = uncontaminated Chernozem
Table 6. Element concentrations in blood serum of the animals (n = 6; mean ± standard deviation)
As (nmol/l) Cd (nmol/l) Pb (nmol/l) Zn (µmol/l) Ca (mmol/l) Mg (mmol/l) P (mmol/l)
1st generation male
Diet 27.8 ± 15.9a 0.408 ± 0.294b 2.93 ± 1.75ab 11.1 ± 1.2a 2.28 ± 0.12a 1.65 ± 0.16b 1.88 ± 0.25a
Diet + S 17.6 ± 5.5a 0.025 ± 0.025a 0.94 ± 0.61a 12.0 ± 2.2a 2.22 ± 0.28a 0.97 ± 0.31a 2.05 ± 0.32a
Diet + K 2456 ± 334b 0.016 ± 0.016a 2.24 ± 1.19ab 7.84 ± 2.20b 2.32 ± 0.26a 0.88 ± 0.36a 1.87 ± 0.31a
Diet + L 404 ± 218b 0.237 ± 0.082ab 3.09 ± 1.05b 9.17 ± 1.74ab 2.19 ± 0.16a 0.92 ± 0.24a 2.13 ± 0.33a
1st generation female
Diet 87.8 ± 43.9a 0.155 ± 0.090ab 2.74 ± 1.01b 13.5 ± 4.3b 2.40 ± 0.34a 0.95 ± 0.35a 1.79 ± 0.43a
Diet + S 72.3 ± 31.9a 0.074 ± 0.041a 1.39 ± 0.52a 16.3 ± 4.4bc 2.47 ± 0.12a 0.73 ± 0.06a 1.71 ± 0.12a
Diet + K 5112 ± 774b 0.123 ± 0.033ab 2.44 ± 0.37b 7.69 ± 1.07a 2.40 ± 0.17a 0.75 ± 0.22a 1.87 ± 0.33a
Diet + L 912 ± 2648b 0.204 ± 0.025b 2.51 ± 0.55b 9.62 ± 1.59ab 2.38 ± 0.16a 0.79 ± 0.18a 1.83 ± 0.37a
L = Fluvisol, K = Luvisol, S = uncontaminated Chernozem
a–caverages marked by the same letter do not significantly differ at P < 0.05 within individual columns
Table 7. Average contents of selected biochemical parameters determined in blood serum of the animals (n = 6; mean ± standard deviation)
AST (µkat/l) ALP (µkat/l) Total protein (g/l) Glucose (mmol/l) Urea (mmol/l)
1st generation male
Diet 1.59 ± 0.15a 3.36 ± 0.61a 58.4 ± 2.0a 12.6 ± 1.6a 7.2 ± 0.8a
Diet + S 1.70 ± 0.41a 2.78 ± 1.01a 60.3 ± 3.8a 10.2 ± 1.6a 7.6 ± 0.5a
Diet + K 1.55 ± 0.12a 2.47 ± 0.61a 58.4 ± 4.2a 9.7 ± 0.7a 7.9 ± 0.4a
Diet + L 1.20 ± 0.04a 3.24 ± 0.76a 54.1 ± 5.5a 10.9 ± 0.6a 9.2 ± 0.4b
1st generation female
Diet 1.89 ± 1.05a 2.24 ± 0.57a 63.1 ± 5.2a 11.3 ± 3.0b 8.5 ± 1.3a
Diet + S 1.38 ± 0.07a 1.83 ± 0.26a 64.9 ± 6.9a 9.1 ± 0.7a 7.9 ± 0.3a
Diet + K 1.64 ± 1.02a 1.73 ± 0.55a 58.3 ± 5.8a 8.3 ± 0.7a 7.8 ± 0.9a
Diet + L 1.25 ± 0.40a 2.14 ± 0.38a 55.6 ± 8.1a 8.3 ± 0.7a 7.0 ± 0.8a
AST = aspartate transaminase, ALP = alkaline phosphatase, L = Fluvisol, K = Luvisol, S = uncontaminated Chernozem
a,baverages marked by the same letter do not significantly differ at P < 0.05 within individual columns
gested suppressed bioavailability of feed-derived glucose due to presence of soil in the diet.
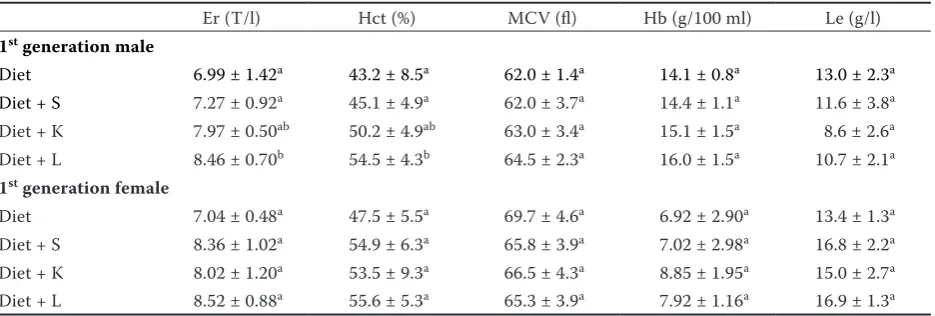
The investigated hematological parameters are summarized in Table 8 where a significant increase
(P < 0.05) of hematocrit value and total erythrocyte
count is evident in the case of male rats fed the diet amended by the soils K and L. Although not significant, this pattern indicated also the results of female hematological parameters. Significant increase of leukocyte count as observed in our previous experiment (Szakova et al. 2012) was not reported in this experiment.
DISCUSSION
The effect of risk element uptake on body weight and weight gain of rats was investigated by Paul et
[image:8.595.63.531.567.724.2]diet but the As tissue concentrations were almost comparable for both soil K and soil L amend-ments although the arsenic content in the soil L
was significantly (P < 0.05) lower. As discussed
in our previous experiment, the differences in As bioavailability in both soils also do not correspond to arsenic concentrations in individual tissues (Szakova et al. 2012). Therefore, potential As-Cd interactions seemed to play a substantial role. As already published, the interaction between arsenic and cadmium applied simultaneously is evident. The addition of Cd to the diet can significantly increase arsenic contents in liver and kidney of rats fed the diet containing Cd-enriched yeasts (Sza-kova et al. 2009). Similarly, rats treated with As + Cd had more As in heart tissue than rats treated only with arsenic (Yanez et al., 1991). Hochadel and Waalkes (1997) stated that arsenic pretreat-ment can reduce mortality in rats given the high dose of cadmium compared to rats given cadmium alone. The opposite effect of both elements was not observed. Moreover, arsenic pretreatment produced an 8-fold increase in hepatic levels of metallothionein. Thus, increasing contents of both elements in liver and kidney can be expected and enhanced metallothionein content in these tissues could be verified in further research. In the case of lead, low bioavailability of this element (Ellick-son et al. 2001; Szakova et al. 2012) resulted in its relatively low contents in analyzed tissues where
significantly (P < 0.05) enhanced levels were
ob-served only in the case of extremely contaminated soil L. As explained by Smith et al. (2008), the lead uptake and transformation do not differ
signifi-cantly in dependence on lead compound and/or lead-enriched matter including lead-contaminated soil. Although the lead transport through placenta and mother’s milk was described by Todorovic et
al. (2005), no differences between the 1st and 2nd
generation were observed due to long-term uptake of the soil-amended diet after weaning.
Among the essential elements, the most appar-ent effect of the risk elemappar-ent dietary uptake was observed in the case of Cu in the tissues of animals fed As-contaminated soil K as already observed in our previous experiment (Szakova et al. 2012) and confirmed by other authors (Schmolke et al. 1992; Uthus 2001; Yu and Beynen 2001; Birri et al. 2010). Comparing the arsenic compounds, the Cu-As interaction was observed only if inorganic As compounds were the predominant species present. In our case, the mobile As pool in soils is represented by inorganic arsenate (Marin et al. 1993) suggesting possible intensification of As-Cu interaction. The other previously described interactions such as As-Fe (Paul et al. 2002), Cd-Fe (Turgut et al. 2007), or Cd-Cu (Chmielnicka and Sowa 1996) were not confirmed in our experiment. As already mentioned, the individual experiments differed in element dose and application, element source, and duration of the experiment.
[image:9.595.64.532.101.259.2]The significant effect of risk element intoxica-tion of the rats on the activity of hepatospecific enzymes such as ALT and ALP was observed after both single-dose (Dudley et al. 1982; Tzirogiannis et al. 2003), and long-term (Renugadevi and Pra-bu 2010) dietary exposure documenting clearly hepatotoxic effect of risk elements, especially Table 8. Average contents of selected hematological parameters of the animals (n = 6; mean ± standard deviation)
Er (T/l) Hct (%) MCV (fl) Hb (g/100 ml) Le (g/l)
1st generation male
Diet 6.99 ± 1.42a 43.2 ± 8.5a 62.0 ± 1.4a 14.1 ± 0.8a 13.0 ± 2.3a
Diet + S 7.27 ± 0.92a 45.1 ± 4.9a 62.0 ± 3.7a 14.4 ± 1.1a 11.6 ± 3.8a
Diet + K 7.97 ± 0.50ab 50.2 ± 4.9ab 63.0 ± 3.4a 15.1 ± 1.5a 8.6 ± 2.6a
Diet + L 8.46 ± 0.70b 54.5 ± 4.3b 64.5 ± 2.3a 16.0 ± 1.5a 10.7 ± 2.1a
1st generation female
Diet 7.04 ± 0.48a 47.5 ± 5.5a 69.7 ± 4.6a 6.92 ± 2.90a 13.4 ± 1.3a
Diet + S 8.36 ± 1.02a 54.9 ± 6.3a 65.8 ± 3.9a 7.02 ± 2.98a 16.8 ± 2.2a
Diet + K 8.02 ± 1.20a 53.5 ± 9.3a 66.5 ± 4.3a 8.85 ± 1.95a 15.0 ± 2.7a
Diet + L 8.52 ± 0.88a 55.6 ± 5.3a 65.3 ± 3.9a 7.92 ± 1.16a 16.9 ± 1.3a
Er = total erythrocyte count, Hct = hematocrit, MCV = mean cell volume, Hb = hemoglobin, Le = total leukocyte count L = Fluvisol, K = Luvisol, S = uncontaminated Chernozem
cadmium. In our case no changes in the enzymatic activity were observed (Table 7) but other bioche-mical indicator, urea concentration in the blood serum, documents adverse effect of long-term risk element exposure via the contaminated soil. The renal injury as a result of long-term cadmium exposure was frequently reported (Hiratsuka et al. 1996; El-Demerdash et al. 2004; Borgese et al. 2008). Hypoglykaemia resulting from the single-dose cadmium application was reported due to disability of gluconeogenesis caused by the liver injury by Adachi et al. (2007). However, long-term cadmium exposure resulted in the restoration of original glucose concentrations because of anti-oxidative mechanisms of the rats. Our results, however, do not allow us to conclude that the serum glucose suppression in female rats was caused by risk element uptake.
Decreasing hemoglobin content connected with decreasing blood iron levels and anaemia was de-scribed (El-Demerdash et al. 2004; Adachi et al. 2007). However, opposite effect was observed by Fucikova et al. (1995) where rats were fed
semisyn-thetic diets supplemented with feeding yeast
Can-dida utilis with low (3 mg/kg) or high (90 mg/kg)
content of organically bound cadmium and/or
cadmium in the form of CdCl2 (9 mg/kgof diet).
Rats on diet with yeast high in Cd or with CdCl2
supplement had higher (P < 0.05) levels of cadmium
in liver and kidney than controls. The animals fed high Cd content yeast had significantly higher hemoglobin values compared to the group fed low Cd content yeast. The effect of experimental design and duration of the experiment is docu-mented by Fucikova et al. (1996) presenting no changes in hemoglobin values in rats fed yeast supplemented Cd-enriched diet. Also our previ-ous experiment (Szakova et al. 2012) showed no changes in hemoglobin values but decreased iron tissue concentrations. In this experiment the iron suppression was not confirmed but hemoglobin values and total erythrocyte count increased in female rats exposed to soil L documenting unam-biguous response of animal organisms to enhan-cement of the dietary cadmium level. Similarly, increasing white blood cells count observed after both single-dose (Kataranovski et al. 1998) and long-term (Fucikova et al. 1995; Szakova et al. 2012) cadmium exposition was not confirmed in our experiment.
The results confirmed our previous results (Sza-kova et al. 2012) showing increased tissue risk
element levels (especially of As and Cd) as a result of regular uptake of the risk element contamina-ted soils. Although the shifts in the biochemical and hematological parameters of the animals did not give unambiguous results, their existence confirms adverse effect of the soil-derived risk element exposure. In the case of lead, relatively low increase of tissue levels was reported due to its low bioavaolability. However, Oktem et al. (2004) observed harmful effects (injury of red blood cells, adverse renal effects) of long-term uptake of low levels of lead in the organisms of people living in contaminated areas. Moreover, the inter-element interactions in the case of multiinter-element contaminated area (Wang et al. 2009; Whittaker et al. 2011) can substantially modify the potential effects of the individual elements as well as the nutrient imbalance.
REFERENCES
Adachi K., Dote T., Dote E., Mitsui G., Kono K. (2007): Strong acute toxicity, severe hepatic damage, renal in-jury and abnormal serum electrolytes after intravenous administration of cadmium fluoride in rats. Journal of Occupational Health, 49, 235–241.
Amaral A., Cabral C., Guedes C., Rodrigues A. (2007): Apoptosis, metallothionein, and bioaccessible metals in domestic mice (Mus musculus L.) from a human-inhab-ited volcanic area. Ecotoxicology, 16, 475–481.
Asagba S.O. (2010): Comparative effect of water and food-chain mediated cadmium exposure in rats. Biometals, 23, 961–971.
Bencko V., Cikrt M., Lener J. (1995): Toxic Metals in Life and Work Environment of People. Grada, Prague, Czech Republic. (in Czech)
Bhadauria S., Flora S.J.S. (2007): Response of arsenic-in-duced oxidative stress, DNA damage, and metal im-balance to combined administration of DMSA and monoisoamyl-DMSA during chronic arsenic poisoning in rats. Cell Biology and Toxicology, 23, 91–104. Birri P.N.R., Perez R.D., Cremonezzi D., Perez C.A., Rubio
M., Bongiovanni G.A. (2010): Association between As and Cu renal cortex accumulation and physiological and histological alterations after chronic arsenic intake. Environmental Research, 110, 417–423.
Borgese L.P., Brandao R., Godoi B., Nogueira C.W., Zeni G. (2008): Oral administration of diphenyl diselenide protects against cadmium-induced liver damage in rats. Chemico-Biological Interactions, 171, 15–25.
A.Q., Amaro R.G. (2009): Effect of arsenic on regulatory T cells. Journal of Clinical Immunology, 29, 461–469. Chmielnicka J., Sowa B., (1996): Cadmium interaction with
essential metals (Zn, Cu, Fe), metabolism metallothio-nein, and ceruloplasmin in pregnant rats and fetuses. Ecotoxicology and Environmental Safety, 35, 277–281. Cui X., Okayasu R. (2008): Arsenic accumulation,
elimina-tion, and interaction with copper, zinc and manganese in liver and kidney of rats. Food and Chemical Toxicology, 46, 3646–3650.
Dudley R.E., Svoboda D.J., Klaassen C.D. (1982): Acute exposure to cadmium causes severe liver injury in rats. Toxicology and Applied Pharmacology, 65, 302–313. El-Demerdash F.M., Yousef M.I., Kedwany F.S., Baghdadi
H.H. (2004): Cadmium induced changes in lipid peroxi-dation, blood hematology, biochemical parameters and semen quality of male rats: protective role of vitamin E and β-carotene. Food and Chemical Toxicology, 42, 1563–1571.
Ellickson K.M., Meeker R.J., Gallo M.A., Buckley B.T., Lioy P.J. (2001): Oral bioavailability of lead and arsenic from a NIST standard reference soil material. Archives of Envi-ronmental Contamination and Toxicology, 40, 128–135. Fischer A.B., Georgieva R., Nikolova V., Halkova J., Bainova A., Hristeva V., Penkov D., Alandjiisk D. (2003): Health risk for children from lead and cadmium near a non-fer-rous smelter in Bulgaria. International Journal of Hygiene and Environmental Health, 206, 25–38.
Fucikova A., Slamova A., Szakova J., Cibulka J., Heger J. (1995): The influence of dietary cadmium on hematologi-cal parameters and phagocytic activity of leukocytes in rats. Živočišná výroba, 40, 15–18. (in Czech)
Fucikova A., Kozakova H., Slamova A., Cibulka J. (1996): The influence of dietary cadmium on hematological parameters and disaccharidase activities in rat jejunal enterocytes. Živočišná výroba, 41, 63–67. (in Czech) Hettiarachchi G.M., Pierzynski G.M., Oehme F.W., Sonmez
O., Ryan J.A. (2003): Treatment of contaminated soil with phosphorus and manganese oxide reduces lead absorp-tion by Sprague-Dawley rats. Journal of Environmental Quality, 32, 1335–1345.
Hiratsuka H., Katsuta O., Toyota N., Tsuchitani M., Umemu-ra T., Marumo F. (1996): Chronic cadmium exposure-induced renal anemia in ovariectomized rats. Toxicology and Applied Pharmacology, 137, 228–236.
Hochadel J.F., Waalkes M.P. (1997): Sequence of exposure to cadmium and arsenic determines the extent of toxic effects in male Fisher rats. Toxicology, 116, 89–98. Jankovska I., Vadlejch J., Szakova J., Miholova D., Kunc P.,
Knizkova I., Cadkova Z., Langrova I. (2010): Experimen-tal studies on the cadmium accumulation in the cestode Monienzia expansa (Cestoda: Anoplocephalidae) and
its final host (Ovis aries). Experimental Parasitology, 126, 130–134
Karadas C., Kara D. (2011): In vitro gastro-intestinal me-thod for the assessment of heavy metal bioavailability in contaminated soils. Environmental Science and Pollution Research, 18, 620–628.
Kataranovski M., Kataranovski D., Savic D., Jovcic G., Bog- danovic Z., Jovanovic T. (1998): Granulocyte and plasma cytokine activity in acute cadmium intoxication in rats. Physiological Research, 47, 453–461.
Kostic M.M., Ognjanovic B., Dimitrijevic S., Zikic R.V., Stajn A., Rosic G.L., Zivkovic R.V. (1993): Cadmium-induced changes of antioxidant and metabolic status in red-blood cells of rats – in-vivo effects. European Journal of Haematology, 51, 86–92.
Kusakabe T., Nakajima K., Suzuki K., Nakazato K., Takada H., Satoh T., Oikawa M., Kobayashi K., Koyama H., Ara-kawa K., Nagamine T. (2008): The changes of heavy metal and metallothionein distribution in testis induced by kadmium exposure. Biometals, 21, 71–81.
Marin A.R., Masscheleyn P.H., Patrick Jr. W.H. (1993): Soil redox-pH stability of arsenic species and its influence on arsenic uptake by rice. Plant and Soil, 152, 245–253. Matovic V., Buha A., Bulat Z., Dukic-Cosic D. (2011): Cad-mium toxicity revisited: focus on oxidative stress induc-tion and interacinduc-tions with zinc and magnesium. Arhiv za Higijenu Rada i Toksikologiju, 62, 65–76.
Mehlich A. (1984): Mehlich 3 Soil Test Extractant: A modi-fication of Mehlich 2 Extractant. Communications in Soil Science and Plant Analysis, 15, 1409–1416.
Noble R.R.P., Hough R.M., Watkins R.T. (2010): Enrichment and exposure assessment of As, Cr and Pb of the soils in the vicinity of Stawell, Victoria, Australia. Environmental Geochemistry and Health, 32, 193–205.
Ognjanovic B.I., Pavlovic S.Z., Maletic S.D., Zikic R.V., Stajn A.S., Radojicic R.M., Saicic Z.S., Petrovic V.M. (2003): Protective influence of vitamin E on antioxidant defence system in the blood of rats treated with cadmium. Physio- logical Research, 52, 563–570.
Oktem F., Arslan M.K., Dundar B., Delibas N., Gultepe M., Ilhan I.E. (2004): Renal effects and erythrocyte oxidative stress in long-term low-level lead-exposed adolescent workers in auto repair workshops. Archives of Toxicol-ogy, 78, 681–687.
Palacios J., Roman D., Cifuentes F. (2012): Exposure to low level of arsenic and lead in drinking water from Anto-fagasta city induces gender differences in glucose ho-meostasis in rats. Biological Trace Element Research, 148, 224–231.
Corresponding Author
Prof. Ing. Jiřina Száková, CSc., Czech University of Life Sciences Prague, Department of Agroenvironmental Chemistry and Plant Nutrition, Kamýcká 129, 165 21 Prague 6-Suchdol, Czech Republic
Phone: +420 224 382 753, e-mail: [email protected] Prigge E., Baumert H.P., Muhle H. (1977): Effects of dietary
and inhalative cadmium on hemoglobin and hematocrit in rats. Bulletin of Environmental Contamination and Toxicology, 17, 585–590.
Pruvot C., Douay F., Herve F., Waterlot C. (2006): Heavy metals in soil, crops and grass as a source of human ex-posure in the former mining areas. Journal of Soils and Sediments, 6, 215–220.
Renugadevi J., Prabu S.M. (2010): Cadmium-induced hepa-totoxicity in rats and the protective effect of naringenin. Experimental and Toxicologic Pathology, 62, 171–181. Ruby M.V., Davi A., Schoo R., Eberl S., Sellston C.M. (1996):
Estimation of lead and arsenic bioavailability using a physiologically based extraction test. Environmental Science and Technology, 30, 422–430.
Saito S., Yamauchi H., Yoshida K. (2008): Interactions of arsenic with zinc, copper and iron in human hepatic cells. Trace Elements and Electrolytes, 25, 206–210.
Schmolke G., Elsenhans B., Ehtechami C., Forth W. (1992): Arsenic copper interaction in the kidney of the rat. Hu-man and Experimental Toxicology, 11, 315–321. Shan G., Tang T., Zhang X. (2009): The protective effects
of ascorbic acid and thiamine supplementation against damage caused by lead in the testes of mice. Journal of Huazhong University of Science and Technology – Medi-cal Sciences, 29, 68–72.
Smith Jr. D.M., Mielke H.W., Heneghan J.B. (2008): Sub-chronic lead feeding study in male rats. Archives of En-vironmental Contamination and Toxicology, 55, 518–528. Szakova J., Zidek V., Miholova D. (2009): Influence of el-evated content of cadmium and arsenic in diet contain-ing feedcontain-ing yeast on organisms of rats. Czech Journal of Animal Science, 54, 1–9.
Szakova J., Novosadova Z., Zidek V., Fucikova A., Zidkova J., Miholova D., Tlustos P. (2012): The effect of diet amended by risk elements contaminated soil on risk element tissue contents and hematological parameters of rats. Czech Journal of Animal Science, 57, 430–441.
Todorovic T., Dozic I.V.D., Pejovic J., Marjanovic M. (2005): The influence of chronic lead poisoning on the activity
of some serum enzymes in rats. Acta Veterinaria, 55, 471–482.
Turgut S., Polat A., Inan M., Turgut G., Emmungil G., Bican M., Karakus T.Y., Genc O. (2007): Interaction between anemia and blood levels of iron, zinc, copper, cadmium and lead in children. Indian Journal of Pediatrics, 74, 827–830.
Tzirogiannis K.N., Panoutsopoulos G.I., Demonakou M.D., Hereti R.I., Alexandropoulou K.N., Basayannis A.C., My-koniatis M.G. (2003): Time-course of cadmium-induced acute hepatotoxicity in the rat liver: the role of apoptosis. Archives of Toxicology, 77, 694–701.
Uthus E.O. (2001): High dietary arsenic exacerbates copper deprivation in rats. Journal of Trace Elements in Experi-mental Medicine, 14, 43–55.
Wang L., Chen D., Wang H., Liu Z. (2009): Effects of lead and/or cadmium on the expression of metallothionein in the kidney of rats. Biological Trace Element Research, 129, 190–199.
Whittaker M.H., Wang G., Chen X.-Q., Lipsky M., Smith D., Gwiazda R., Fowler B.A. (2011): Exposure to Pb, Cd, and As mixtures potentiates the production of oxidative stress precursors: 30-day, 90-day, and 180-day drinking water studies in rats. Toxicology and Applied Pharmacol-ogy, 254, 154–166.
Woods J.S., Fowler B.A. (1977): Effects of chronic arsenic exposure on hematopoietic function in adult mammalian liver. Environmental Health Perspectives, 19, 209–213. Yanez L., Carrizales L., Zanatta M.T., de Jesus Mejia J., Batres
L., Diaz-Barriga F. (1991): Arsenic-cadmium interaction in rats: toxic effects in the heart and tissue metal shifts. Toxicology, 67, 227–234.
Yu S., Beynen A.C. (2001): High arsenic intake raises kidney copper and lowers plasma copper concentrations in rats. Biological Trace Element Research, 81, 63–70.