Comparative Study of Adaptive Beam-Steering and
Adaptive Modulation-Assisted Dynamic Channel
Allocation Algorithms
Jonathan Blogh, Peter. Cherriman, and Lajos Hanzo, Senior Member, IEEE
Abstract—A range of dynamic channel allocation (DCA) algo-rithms, namely, distributed control and locally distributed control assisted DCA arrangements, are studied comparatively. The so-called locally optimized least interference algorithm (LOLIA) emerges as one of the best candidates for future mobile systems, supporting more than twice the number of subscribers in compar-ison to conventional fixed channel allocation (FCA). It can also cope with unexpected large increases in teletraffic demands while requiring no tedious frequency planning. This is achieved at the cost of more complex call setup and control, and the requirement of fast backbone networks for base station–base station signalling. Adaptive antennas are shown to significantly enhance the capacity of both the LOLIA and FCA-based networks, especially when used in conjunction with adaptive modulation techniques.
Index Terms—Adaptive arrays, adaptive modulation, beam steering, dynamic channel allocation (DCA), smart antennas, wireless networking.
I. BACKGROUND
T
HE recently emerging micro/picocellular frequency reuse structures increase the user capacity and area spectral effi-ciency of the system, although often at the cost of reduced fre-quency reuse distance and hence increased cochannel interfer-ence. Sectorization techniques [1], interference cancellation [2], or adaptive antennas [3]–[5] have been proposed for mitigating the cochannel interference. In small-cell environments, the han-dover process is critical, as highlighted by Tekinay et al. [6], [7], while the associated issues of timeslot reassignment were studied by Bernhardt [8].This paper is concerned with the comparative study of dy-namic channel allocation (DCA) algorithms [9]–[12], many of which were proposed and studied in terms of the achievable grade-of-service (GOS) by Chuang et al. throughout the past few years. In this paper, in addition to the GOS, we attempt to provide a performance comparison in terms of the carried teletraffic, call blocking probability, call dropping probability, probability of low-quality access, and outage probability for a range of DCA techniques under identical conditions, where all users seamlessly roam across the simulation area rather than simply assigning them to arbitrary, uncorrelated, but essentially
Manuscript received December 18, 1998; revised August 14, 2000. This work was supported by the European Commission in the framework of the TRUST Project.
The authors are with the Department of Electronics and Computer Science, University of Southampton, Southampton SO17 1BJ, U.K. (e-mail: http://www-mobile.ecs.soton.ac.uk; [email protected]; [email protected]).
Publisher Item Identifier S 0018-9545(01)03222-4.
stationary random positions. It is also demonstrated that the pro-posed burst-by-burst adaptive modulation scheme [13] results in substantial teletraffic performance improvements.
This paper is structured as follows. Section II describes the DCA algorithms involved in the comparisons, while Section III–A introduces the simulation conditions, such as performance metrics, the nonuniform traffic model, and system parameters employed. The performance comparisons of Section IV constitute the bulk of this paper, leading to the conclusions in Section V.
II. DYNAMICCHANNELALLOCATIONALGORITHMS
We investigated both distributed and locally distributed DCA algorithms, which are described in Sections II-A and II-B, re-spectively. In this section, we mainly follow the approach of Chuang [9]–[11], who has pioneered the performance charac-terization of DCA techniques throughout the past few years.
A. Distributed DCA Algorithms
In this section, we highlight the four distributed DCA algorithms that we have studied comparatively. The least inter-ference algorithm (LIA)—which was also studied by Chuang in terms of the grade of service [11]—always assigns the channel suffering from the least interference, which minimizes the system’s interference load at low traffic loads. However, at high traffic loads, the LIA algorithm will still attempt to allocate a channel to a new call, even when all the slots have a high level of interference, which increases the total interference of the system. A refined version of the LIA algorithm, namely, the least interference below threshold algorithm (LTA) [11], attempts to reduce the interference caused by the LIA algorithm at high loads, by blocking calls from using those channels, where the interference is deemed excessive for the transceiver, in order to sustain adequate communications quality. Hence, the LTA algorithm attempts to minimize the overall interference in the system while maintaining the targeted call quality.
The highest (or most) interference below threshold algorithm (HTA or MTA) [11] allocates the most interfered channel, whose interference is below the maximum tolerable inter-ference threshold, which is determined by the transceiver’s interference resilience. Hence, instead of minimizing the interference, this technique maximizes the spectral efficiency.
Lastly, the lowest frequency below threshold algorithm (LFA) [11], which was also studied by Chuang, is a relative of the
LTA algorithm, attempting to reduce the number of carrier fre-quencies used simultaneously, requiring on average a reduced number of transceivers at each basestation. The algorithm al-locates the least interfered channel below the maximum tol-erable interference threshold while also attempting to reduce the number of carrier frequencies used. Therefore, no new car-rier frequency is assigned from the set of carcar-riers, unless all of the available timeslots on the currently used carrier frequencies have too high a level of interference. In the next section, we de-scribe the two locally distributed DCA algorithms, whose per-formance we have compared to the above algorithms using sim-ulations.
B. Locally Distributed DCA Algorithms
The locally optimized least interference algorithm (LOLIA) attempts to reduce the overall interference in a system, like the LIA and LTA, while the locally optimized most interference algorithm (LOMIA) improves the spectral efficiency similarly to the HTA. Specifically, the LOLIA and LOMIA exploit the channel assignment information provided by neighboring basestations in order to improve their DCA decisions.
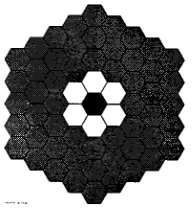
More explicitly, the LOLIA always assigns the least inter-fered channel, unless it is used in the nearest neighboring cells by another subscriber. However, the larger that is, the higher the number of blocked calls, since there are fewer avail-able channels that are not used in the nearest base stations. Fig. 1 shows the arrangement of neighboring cells for .
The parameter of the algorithm effectively imposes a min-imum reuse distance constraint upon the algorithm. By contrast, the LOMIA picks the most interfered channel, provided that this channel is not used in the nearest neighboring cells. The LOLIA and LOMIA are similar to those proposed by Del Re et al. [14] and by ChihLin et al. [15].
III. SIMULATIONCONDITIONS
A. Performance Metrics
The following performance metrics have been widely used in the literature and were also advocated by Chuang [11]:
1) new call blocking probability ;
2) call dropping or forced termination probability or ;
3) probability of low-quality connection , quantifying the chances that either the uplink or downlink signal quality is below the level required by the specific trans-ceiver to maintain a given target performance;
4) probability of outage , defined as the probability that the signal-to-interference-plus-noise ratio (SINR) value is below the value where the call is deemed to be in outage, as described in Section III-C;
5) GOS, defined by Cheng and Chuang [11] as
GOS unsuccessful or low-quality call accesses
call is blocked call is admitted
low signal quality and call is admitted
[image:2.612.380.476.61.167.2](1)
Fig. 1. Frequency-reuse “exclusion zone” employed by the LOLIA and LOMIA. This cell layout also demonstrates the nonuniform traffic conditions used in the forthcoming performance comparisons, exhibiting a traffic “hot spot” in the central cell (black) and a “warm spot” (white cells) surrounding it. Mobiles in the gray cells move at the standard speed of 13.4 m/s (30 mi/h). Mobiles in the white (“warm spot”) cells can move at a speed of 9 m/s (20 mi/h). Mobiles in the black “hot-spot” cell are limited to a speed of 4 m/s (9 mi/h).
B. Beamforming
Since cellular networks are generally interference limited, the interference reduction capabilities of adaptive antenna arrays render them particularly suitable for this application [16], [17]. Adaptive antennas reduce the levels of cochannel interference by exploiting the spatial dimension, i.e., the physical separa-tion between users, and thus may increase the network capacity, or the call quality. Assuming that each mobile station may be uniquely identifiable, a beamforming algorithm may be invoked in order to calculate the antenna array’s receiver weights, so as to maximize the received SINR. However, in a frequency-divi-sion duplexed (FDD) system, the up- and downlink channels are generally uncorrelated; hence the antenna array weights calcu-lated for the uplink are not directly applicable to the downlink situation. A feedback loop from the mobile station to the base station has been proposed [18], [19], thus enabling the transmit antenna array weights to be adjusted. An alternative solution is to use time-division duplexing (TDD) with adjacent up- and downlink slots and a sufficiently short dwell time, such that the up- and downlink channels do not vary significantly, therefore allowing the complex conjugate of the receive antenna weights to be used as the transmit antenna weights [16].
The receiver antenna array weights were calculated em-ploying the sample matrix inversion (SMI) algorithm [16], using a binary phase-shift keying (BPSK) modulated reference signal of eight bits, chosen as a compromise between com-plexity and the quality of the estimation of the received signal’s covariance matrix. It was assumed that the up- and downlink channels were identical, thus enabling the same antenna pattern to be used in both transmit and receive modes. This assumption should therefore give an upper limit to the performance gains that may be achieved using an adaptive antenna array. The array consisted of four antenna elements in a linear array configuration with 2 element spacing.
C. System Parameters
TABLE I
GSM-LIKEDCA SYSTEMPARAMETERS
when necessary, to generate the log-normal shadow fading, with random time offsets used for the different subscribers. The mobile and base-station transmit powers were fixed at 10 dBm (10 mw), i.e., no power control was used. The number of carrier frequencies in the whole system was limited to seven [12 for the fixed channel allocation (FCA) algorithm using a 12-cell cluster size], each with eight timeslots, in order to maintain an acceptable computational load. This meant that the DCA system could theoretically handle a maximum of (or ) instantaneous calls at one base station, provided that their quality was adequate. If a channel allocation request for a new call could not be satisfied immediately, it was queued for up to 5 s, after which time, if not satisfied, it was classified as blocked. It was assumed that the network was synchronous from cell to cell; thus channels on different time slots of the same frequency were orthogonal.
The physical layer was modeled using two parame-ters—outage SINR and reallocation SINR—defined as the average SINR required by a transceiver in order to maintain given frame error rates (FERs) over a narrow-band Rayleigh fading channel. When the signal quality, expressed in terms of the SINR, drops below the reallocation SINR, a low-quality access is encountered, and the mobile requests a new physical channel to handover to, thus initiating an intra- or intercell han-dover. If, while waiting for a reallocation handover, the signal quality drops further, below the outage SINR, then an outage is encountered. A prolonged outage leads to the call’s being dropped or forcibly terminated. Since a user typically views a dropped call as less desirable than a blocked call, a handover queueing system (HQS) was employed. The HQS allows allo-cation of network resources to handovers, before assignment to new call requests, thus reducing the number of dropped calls at the expense of the blocked call probability. An additional benefit of the HQS is the time window formed, during which resource allocation may take place, thus increasing the chances of a used slot’s becoming free and allowing a handover to be successfully executed. This twin-threshold physical layer model is similar to those described by Tekinay et al. [22] and Katzela et al. [23]. However, the model described here is based on SINR thresholds, rather than the received power thresholds of Tekinay et al. [22] and Katzela et al. [23]. A further metric, namely, the low-signal quality probability, is calculated as the proportion of time that the SINR is below the reallocation SINR threshold.
The outage SINR and reallocation SINR threshold were determined, via independent bit-level simulation, for BPSK, QPSK/4-QAM, and 16-QAM models, conducted in a Rayleigh fading environment using approximately half-rate Bose–Chaudhuri–Hocquenghem (BCH) codes, which em-ployed interleaving over the different number of bits conveyed by the different modem modes. Thus, the reallocation SINR threshold was determined to be the average SINR required by the specific transceiver employed to maintain a 5% transmission FER. This SINR value is transceiver dependent and in general can be reduced at the cost of increased transceiver complexity and power consumption. The loss of a maximum of 5% of the speech or video packets can be considered a worst case scenario for modern “wireless orientated,” i.e., error-resilient source codecs. Therefore, by setting the reallocation threshold at this level, the system requested handovers to new channels before the speech or video quality degradation became objectionable.
The outage SINR threshold sets the SINR, below which the system declares that the radio channel has degraded to such a level as to cause a service outage. If the radio channel continues to be in outage, then the call is forcibly terminated. The outage SINR threshold was determined by simulations to be the av-erage SINR required to maintain a 10% FER. Therefore, if the radio channel degrades such that at least 10% of the speech or video packets were lost for some period of time, then the call would be forcibly terminated. The SINR thresholds for BPSK, QPSK/4-QAM, and 16-QAM modems are shown in Table II.
TABLE II
REALLOCATIONSINRS ANDOUTAGESINRSUSED IN THEHANDOVER
PROCESS, FOUND BYSIMULATION FORBPSK, QPSK/4-QAM,AND16-QAM MODEMS. REALLOCATIONSINR ISTHESINR BELOWWHICH ACHANNEL
REALLOCATIONWILL BEREQUESTED, WHILE THEOUTAGESINR IS THE
SINR, BELOWWHICH ASERVICEOUTAGEISDECLARED. SUCCESSIVESERVICE
OUTAGESCAUSE THECALL TO BEFORCIBLYTERMINATED
tradeoff between the mean FER and the data throughput, which is governed by the modem mode switching thresholds. These switching thresholds define the SINRs at which the channel is considered unsuitable for a given modulation mode, where an alternative mode must be invoked. The pseudocode of the pro-posed algorithm is as follows:
determine lowest SINR out of up- and down-link SINRs
if in 16 QAM mode
if lowestSINR < 16 QAM drop SINR drop to 4 QAM mode
else if lowestSINR < 16 QAM reallocation SINR if at maximum transmit power then revert to 4 QAM
else increase transmit power
else if lowestSINR < 16 QAM target SINR increase transmit power
else if lowestSINR > 16 QAM target SINR+hysteresis decrease transmit power
else if in 4 QAM mode
if lowestSINR < 4 QAM drop SINR drop to BPSK mode
else if lowestSINR < 4 QAM reallocation SINR if at maximum transmit power then revert to BPSK
else increase transmit power
else if lowestSINR < 4 QAM target SINR increase transmit power
else if lowestSINR > 16 QAM target SINR+hysteresis change to 16 QAM mode
else if lowestSINR > 4 QAM target SINR+hysteresis if at maximum transmit power then
reduce transmit power
else change to 16 QAM
else if in BPSK
if lowestSINR < BPSK drop SINR outage occurs
else if lowestSINR < BPSKreallocation SINR if not at maximum transmit power
then increase transmit power
else if lowestSINR > 4 QAM target SINR+hysteresis change to 4 QAM
else if lowestSINR > BPSK target hysteresis if at maximum transmit power then
reduce transmit power
else change to 4 QAM
The power control and modulation mode switching algorithm invoked in our simulations attempted to minimize the trans-mitted power while maintaining a high throughput with a less than 5% target FER. Target SINRs of 21, 27, and 32 dB were used for the BPSK, 4-QAM, and 16-QAM modulation modes, respectively.
When simulating the network employing adaptive antennas in conjunction with adaptive modulation and power control, a multipath propagation environment was employed. This con-sisted of the line-of-sight (LOS) ray and two additional rays, each having a third of the power of the LOS ray, with angles of arrival at the base station determined using the geometri-cally-based single-bounce elliptical model (GBSBEM) of [24] and [25], with parameters chosen such that the multipath rays had one-third of the received power of the direct ray. It was as-sumed that all of these multipath rays arrived with zero time delay relative to the LOS path, or that a space-time equalizer [26], [27] was employed, thus making full use of the additional received signal energy. However, the many extra desired and in-terfering signals incident upon the antenna array rapidly con-sume the limited degrees of freedom of the antenna array, lim-iting its ability to fully cancel each source of interference.
The mobiles were capable of moving freely at a speed of 30 mi/h, in a fixed random direction and were selected at the start of the simulation from a uniform distribution within the simulation area of 49 cells, each having a radius of 218 m. How-ever, the nonuniform traffic model limited the maximum ve-locity of mobile terminals within specified cells, thus creating a higher user density in these cells. This reduced mobile velocity resulted in an increased average cell crossing time, and hence higher teletraffic. For example, in Fig. 1, the mobiles occupying the gray cells all travel at 30 mi/h, while those entering the white cells have a reduced speed of 20 mi/h. The white cells therefore could be said to represent city outskirts, with the black cell being the city center, limiting the mobile speed to 9 mi/h. When a mo-bile leaves the simulation area, it reenters the simulation area at a random location with its speed and direction unchanged.
We investigated the algorithms both in conjunction with uni-form and nonuniuni-form traffic distributions. When the nonuni-form traffic model was used, the speed of the mobiles in the central cells of the top two cell configurations in Fig. 1 was re-duced. The call length and intercall time periods were Poisson distributed [10], [28] with the mean values shown in Table I. The activity rate of the users was fairly high. On average, a user would make a 60-s call every 300 s, a measure that allowed us to expedite our simulations.
Having described the simulation parameters, in the next sec-tion we present our simulasec-tion results, quantifying the amount of traffic that can be carried by each channel allocation algo-rithm.
IV. PERFORMANCESTUDY
A. Comparing the LOLIA with FCA
(a)
[image:5.612.324.532.62.412.2](b)
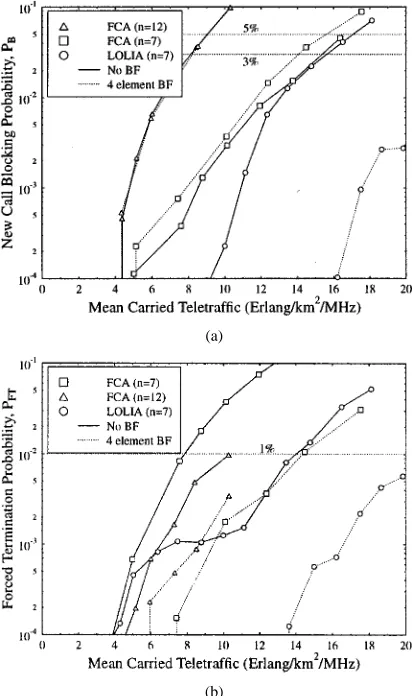
Fig. 2. (a) Call blocking and forced termination performance versus (b) mean carried traffic for comparison of the LOLIA with seven “local” base stations and FCA using 7- and 12-cell reuse clusters under uniform traffic.
LOLIA used seven nearest base stations, i.e., , which statistically speaking has the promise of tighter channel reuse than that of the FCA scheme.
Fig. 2 shows the new call blocking and forced call termina-tion probability for different uniform traffic loads, measured in terms of the mean normalized carried traffic expressed in Erlangs/km /MHz. Specifically, Fig. 2(a) portrays that the FCA algorithm with a 12-cell reuse factor gives the highest new call blocking probability, followed by the FCA scheme using a seven-cell reuse factor, and then the LOLIA with the lowest probability of a blocked call. The poor blocking performance of the FCA algorithm with the 12-cell reuse factor can be attributed to its inherently poorer spectral efficiency than that of its seven-cell derivative. The lack of reduction in the new call blocking probability when using the four-element adaptive antenna arrays in conjunction with the FCA algo-rithms suggests that their blocking performance is limited by the available frequency/timeslot combinations. By contrast, however, the blocking performance of the LOLIA appears to be interference limited, since the addition of the adaptive antenna array results in a significantly reduced call blocking probability. Fig. 2(b) shows that the FCA algorithm using a 12-cell reuse cluster has a lower call dropping probability than that of a seven-cell reuse cluster. This is a result of the greater reuse distance between cochannel cells, leading to lower interference
(a)
(b)
Fig. 3. (a) Probability of low-quality signal(P ) and GOS versus (b) mean carried traffic for comparison of the LOLIA with seven “local” base stations and FCA using 7- and 12-cell reuse clusters under uniform traffic.
levels and hence fewer dropped calls. The efficiency of the adaptive antenna arrays can be seen clearly in this figure, with significantly reduced call dropping probabilities observed for all of the channel allocation algorithms. It is interesting to note that the FCA algorithm with a seven-cell reuse cluster size, in conjunction with the adaptive antenna array, exhibits a lower forced termination probability than the 12-cell reuse factor variant. This is due to the greater levels of interference present with the seven-cell FCA network. Therefore, it benefits to a greater extent from the interference reduction capabilities of the adaptive antenna array.
[image:5.612.62.268.63.411.2]Fig. 4. Mean carried teletraffic versus number of mobile users in the system for the LOLIA with seven “local” base stations and FCA using a seven-cell reuse cluster under uniform traffic.
stable interference characteristic and the LOLIA can perform the channel allocations in a more beneficial manner. The GOS performance of the FCA algorithm and the 12-cell reuse factor of Fig. 3(b) are dominated by the new call blocking probability. Hence, the adaptive antenna arrays offer little reduction in the GOS. However, for both the FCA scheme using the seven-cell cluster size and the LOLIA, the performance gain of the adaptive antenna arrays is clearly evident.
Fig. 4 portrays the mean carried teletraffic versus the number of mobiles in the simulated system. The figure shows that at low traffic loads, the FCA algorithm with a seven-cell cluster size and the LOLIA carried nearly identical amounts of traffic. How-ever, the reduced spectral efficiency of the FCA algorithm using the 12-cell cluster size is clearly evident in the figure. As the mo-bile density, and hence the traffic load, increased, the LOLIA carried more traffic than the FCA algorithms. It is interesting to note that the FCA algorithm with the 12-cell reuse factor does not benefit from the adaptive antenna arrays. Hence its mean carried teletraffic is dominated by the call blocking probability, and not by interference induced call dropping or low-quality ac-cess.
B. Effect of the “Reuse Distance” Constraint on the LOLIA and LOMIA DCA Algorithms
In this section, we quantify the effect of modifying the number of nearest base stations from which channel usage information is obtained when a channel allocation request is made in the LOLIA and LOMIA DCA algorithms. In the LOLIA and LOMIA, a channel cannot be allocated if it is being used in the local “neighborhood” of base stations. Therefore, by increasing the number of excluded nearest base stations in this neighborhood, the minimum reuse distance for a channel is effectively increased.
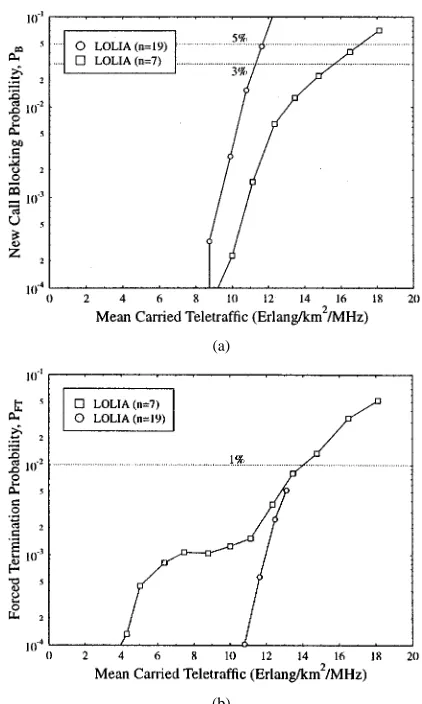
Fig. 5 displays the call blocking and forced termination prob-abilities for a variety of uniform traffic loads with a nearest base station constraint of seven and 19 when using the LOLIA DCA algorithm. It can be seen that the new call blocking probability is higher for the larger exclusion zone scenarios. This results from the larger exclusion zone (of 19 cells), limiting the number of available channels in the neighborhood of a user in call. Thus
(a)
(b)
Fig. 5. (a) Blocking and forced termination performance versus (b) mean carried traffic for comparison of the LOLIA with the number of “local” base stations equal to seven and 19 under uniform traffic.
the new call blocking probability is higher. However, the use of the larger exclusion zone does reduce the forced call termi-nation probability, especially at lower traffic loads. This is due to the increased effective reuse distance of the cochannel users, leading to a reduced level of interference and thus fewer calls dropped as a result of interference. However, at higher traffic loads, the large exclusion zone leads to resource allocation fail-ures in the handover process and the call dropping probability degrades rapidly.
Fig. 6 shows the probability of low-quality access and the GOS for a range of uniform traffic loads, measured in terms of the carried teletraffic for the LOLIA with nearest base-station constraints of seven and 19 cells. It can be seen that the number of low-quality accesses is higher when the exclusion zone is small because the effective reuse distance is lower, inflicting more cochannel interference. The GOS is better (i.e., lower) for larger exclusion zones, when the traffic load is low, which is reversed for high traffic loads. This is mainly attributable to the higher call blocking probability of the larger exclusion zone of 19 cells, particularly in the region of the highest traffic load, as seen in Fig. 5(a).
[image:6.612.60.268.61.218.2](a)
[image:7.612.61.271.56.423.2](b)
Fig. 6. (a) Probability of low-quality signal and GOS versus (b) mean carried traffic for comparison of the LOLIA with the number of “local” base stations equal to seven and 19 under uniform traffic.
is because the LOMIA picks the most interfered channel avail-able within the effective reuse distance. Simulations were car-ried out with a 19-cell exclusion zone, within a 49-cell structure, and for the LOLIA. When the exclusion zone was increased to 37 cells for the LOMIA, the number of cells in the simulation area was increased from 49 to 133 in order to enable the algo-rithm to configure itself properly, i.e., a 37-cell exclusion zone within a 49-cell simulation area does not give the algorithm suf-ficient cells to “manipulate” in order to achieve good perfor-mance.
In Fig. 7, the results are shown versus the normalized carried traffic, which is defined in terms of Erlangs/km /MHz. There-fore, the results are independent of the size of the simulation area used for the LOMIA investigations.
Explicitly, Fig. 7 shows the call blocking and forced termina-tion probabilities versus carried teletraffic for exclusion zones of 19 and 37 cells, using the LOMIA. As expected, the LOMIA ex-hibits lower call blocking, but more forced terminations, when the exclusion zone is smaller. The call blocking is higher when the exclusion zone is larger since there are fewer unused chan-nels available in the local neighborhood. The forced call termi-nation probability is lower when the exclusion zone is larger because the effective reuse distance is larger, and hence the cochannel interference is reduced.
(a)
(b)
Fig. 7. (a) Blocking and forced termination performance versus (b) mean carried teletraffic for comparison of the LOMIA with the number of “local” base stations equal to 19 and to 37 under uniform traffic.
C. Comparison of the LOLIA and LOMIA with the LIA
In this section, we compare the locally distributed DCA algo-rithms, LOLIA and LOMIA, with the simplest distributed DCA algorithm, the LIA. The locally distributed algorithms are ex-pected to perform better than the corresponding distributed al-gorithm, since they have additional knowledge to assist in their decisions. The locally distributed algorithms are aware of the channel allocations made by the nearby base stations. However, this additional knowledge comes at the expense of additional complexity and cost required in order to signal all the channel allocations between the base stations within the neighborhood. Therefore, the LOLIA should perform better than the corre-sponding distributed algorithm, the LIA.
[image:7.612.324.533.60.410.2](a)
[image:8.612.322.530.59.411.2](b)
Fig. 8. Comparison of DCA algorithms: LOMIA, LOLIA, and LIA under uniform traffic. (a) New call blocking probability. (b) Forced termination probability.
a larger exclusion zone, from which the base station receives channel allocation information. Hence, there will be fewer un-used channels available, leading to the increased call blocking probability. The figure also shows that, both the LOMIA and LOLIA achieve lower forced call termination probabilities than the LIA. This is because the interference is more easily controlled in the LOLIA and LOMIA by the exclusion zone constraint. It should be noted that the LOLIA achieves a better call termination performance than the LOMIA.
D. Interference Threshold-Based Distributed DCA Algorithms
Interference threshold-based DCA algorithms rely on an in-terference threshold in order to maintain the minimum required signal quality. An interference threshold-based channel alloca-tion algorithm will not allocate a channel if the measured in-terference in that channel is higher than the maximum toler-able interference threshold. The interference threshold must be above the noise floor, otherwise no channel can be allocated. The closer the interference threshold is to the noise floor, the less the interference in the system. Increasing the interference threshold allows more interfered channels to be allocated to channel requests. The effective reuse distance of the interfer-ence threshold-based DCA algorithms is dependent on the in-terference threshold. As the inin-terference threshold is increased,
(a)
(b)
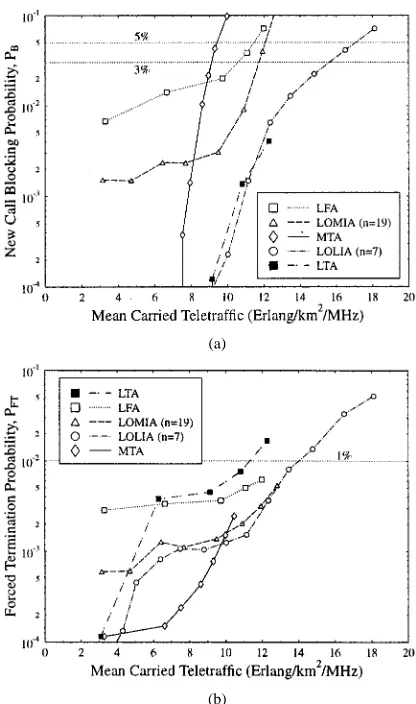
Fig. 9. Comparison of interference threshold-based distributed DCA algorithms (LTA, MTA, LFA) with locally distributed DCA algorithms (LOLIA, LOMIA) using a uniform traffic distribution. (a) New call blocking probability. (b) Forced termination probability.
the effective reuse distance is decreased, allowing more calls to be handled at the expense of higher interference.
[image:8.612.60.267.63.410.2]techniques. More specifically, if the interference level is above the maximum tolerable interference threshold, calls are blocked. Therefore, by reducing the interference in the system, more suc-cessful channel allocations may be performed. The MTA has the highest probability of a blocked call, resulting from its attempts to allocate the most interfered channel available, having an inter-ference level below the acceptable interinter-ference threshold. When the traffic load is low, there are many unused channels, which exhibit an interference level below the interference threshold, and these are allocated to requests by the MTA. However, at high traffic loads there is a high amount of interference present in the system, and hence few channels are classed as suitable for allocation, leading to a high probability of a blocked call. Therefore, at low traffic loads, a very low new call blocking probability is achieved by the MTA, but at high traffic loads, its blocking performance is extremely poor. The blocking per-formance of the LFA is also poor due to its attempts to utilize the minimum number of carrier frequencies.
Fig. 9(b) shows the forced termination probability versus traffic load. Comparing these call dropping results in this figure with the call blocking results of Fig. 9(a) shows that generally, a channel allocation algorithm exhibits either a low new call blocking probability or a low call dropping probability. The LTA and MTA exemplify this, with their “complemented” performance characteristics. However, the flexibility of the lo-cally distributed DCA algorithms, the LOLIA and the LOMIA, allows them to trade off the two performance measures and thus to provide both the lowest new call blocking probability and the lowest call dropping probability.
E. Performance Comparison of Fixed and DCA Algorithms Using Nonuniform Traffic Distributions
In order to show the performance benefits of DCA under nonuniform traffic conditions, we investigated the performance of FCA and some DCA algorithms using the nonuniform traffic model described in Section III–C. We decided to have a “hotspot” cell, surrounded by some less heavily loaded cells for our nonuniform traffic distribution model. This is shown in Fig. 1, where the black cell in the center is the most heavily loaded cell, since mobile terminals are limited to a maximum speed of 4 m/s (9 mi/h). The black “hot spot” cell is surrounded by six white “warm spot” cells, in which the maximum mobile speed is limited to 9 m/s (20 mi/h). All the other cells (gray) serve mobile terminals that move with a constant velocity of 13.4 m/s (30 mi/h). The effect of these “hot spot” cells is that mobile terminals stay longer in such cells, increasing the terminal density and hence the teletraffic.
Another way of showing the benefits of DCA algorithms over FCA under nonuniform traffic conditions is to study the proba-bility density function (pdf) of instantaneous traffic at a range of basestations. Fig. 10 shows the pdf of instantaneous traffic mea-sured in Erlangs at several base stations using both uniform and nonuniform traffic distributions for fixed and DCA algorithms. Under a nonuniform traffic distribution, the figure shows the his-togram of the number of channels used at each of the three types: [normal (30 mi/h), warm spot (9 mi/h), and hot spot (4 mi/h)] of cell. The FCA algorithm is limited to a maximum of eight instantaneous calls (8 erlangs), since each base station has only
(a)
[image:9.612.324.531.61.406.2](b)
Fig. 10. PDF of the number of instantaneous calls at a basestation in terms of erlangs for uniform traffic and for the three possible cell types in nonuniform traffic. Results are shown for (a) the FCA algorithm and (b) the LOLIA withn =
7.
one carrier frequency and eight timeslots. This is clearly shown by the pdf of the “hot spot” cells, where, for 81% of the time, all eight channels are in use simultaneously. However, the dy-namic nature of the LOLIA allows it to theoretically support 56 calls simultaneously on one base station, albeit with no calls on the surrounding base stations. Thus, the LOLIA can support many more simultaneous calls on a base station than the FCA algorithm, as shown in Fig. 10(b), where the “hot spot” cell car-ried in excess of 20 erlangs under nonuniform traffic conditions. Clearly, these results have shown the benefits of DCA in terms of being able to cope with unexpected peaks of traffic demand. These results have shown that the LOLIAs can carry more teletraffic than the FCA algorithm when the traffic distribution is nonuniform. However, we will now show how the performance of the various channel allocation algorithms changes, in com-parison to our previous results throughout Section IV, when sub-jected to nonuniform traffic distributions.
(a)
[image:10.612.322.530.58.409.2](b)
Fig. 11. (a) Blocking and forced termination performance versus (b) mean carried traffic for comparison of the LOLIA, LOMIA, and FCA under both uniform and nonuniform traffic distributions.
cells with a high user density. However, since the LOLIA and the LOMIA are part of the family of DCA algorithms, they are capable of sharing channels between cells, subject to the exclu-sion zone constraints, and consequently suffer less performance degradation than the FCA algorithm.
The comparison of the forced termination probability under uniform and nonuniform traffic loading is shown in Fig. 11(b). The FCA algorithm suffered only a small increase in the dropped call probability, which was most likely limited by the HQS’ giving priority to handovers at the expense of new call requests, as can be clearly seen in Fig. 11(a). The LOLIA and the LOMIA also suffer a performance gradation in the nonuni-form traffic conditions, which becomes more evident as traffic levels increase. At low levels of traffic, it is possible for the channel allocation algorithms to allocate sufficient resources to the cells with the highest user densities while maintaining the coverage of the other, lower traffic cells and meeting the exclusion zone constraints. However, at higher traffic levels, the exclusion zone renders the frequency reuse to be limited, and hence calls are dropped due to a lack of network resources.
F. Effect of Shadow Fading on the FCA, LOLIA, and LOMIA
In this section, we quantify the effect of shadow fading on three channel allocation algorithms. For our shadow fading
in-(a)
(b)
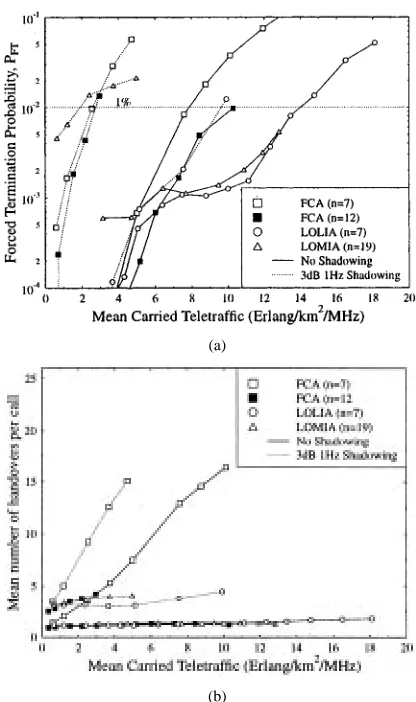
Fig. 12. (a) Forced termination performance and mean number of handovers performed per call versus (b) mean carried traffic for comparison of the LOLIA, LOMIA, and FCA algorithm with and without shadowing. Log-normal shadow fading was generated with a frequency of 1 Hz and a standard deviation of 3 dB.
vestigations, we used a log-normally distributed shadow fading model, with a fading frequency of 1 Hz and a standard deviation of 3 dB. We performed simulations with and without shadow fading using the FCA algorithm and the two locally distributed DCA algorithms, LOLIA and LOMIA.
[image:10.612.60.267.62.409.2]cluster size performs significantly more handovers than all the other channel allocation algorithms, including the FCA algorithm using a 12-cell cluster size. This suggests that the performance of the FCA algorithm with the seven-cell cluster size is limited by the interference arising from its smaller reuse distance. However, the FCA algorithm using a 12-cell cluster size leads to reduced levels of interference, and hence the number of handovers performed per call is significantly lower, as exemplified by Fig. 12(b). When the radio channels are shadow-faded, the LOLIA performs the lowest number of handovers, which is a consequence of allocating the least interfered channels that are likely to withstand the irregular channel impairments of shadowed channels. For both non-shadow-faded and non-shadow-faded radio channels, the FCA algorithm employing a seven-cell reuse cluster performed the greatest number of handovers. By contrast, in conjunction with a 12-cell reuse cluster, the FCA algorithm performed well, given its simplicity. These results show that the performance of all of the channel allocation algorithms is severely affected by shadow fading. However, the DCA algorithms, particularly the LOLIA, cope best with the channel degradation caused by shadow fading. In the next section, we study the effect of the shadow-fading frequency and standard deviation on the LOLIA.
G. Effect of Shadow Fading Frequency and Standard Deviation on the LOLIA
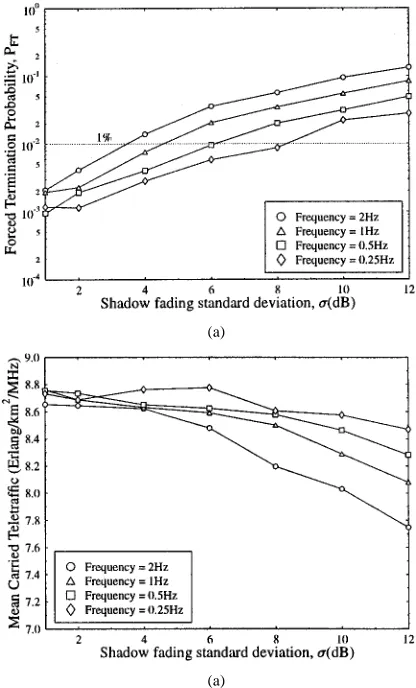
In this section, we investigate the performance effects of the LOLIA among different shadow-fading conditions. We investi-gated the LOLIA using a seven-cell exclusion zone and 1400 users employing QPSK modulation for a range of shadow-fading frequencies and standard deviations. The shadow-shadow-fading frequencies investigated were 0.25, 0.5, 1.0, and 2.0 Hz. The standard deviation of the shadow fading was varied from 1.0 to 12.0 dB.
The forced termination probability is plotted versus the stan-dard deviation of the shadow fading for the range of shadow-fading frequencies in Fig. 13(a). The figure shows the expected increase of the forced termination probability as either the stan-dard deviation or the fading frequency of the shadow fading in-creases.
Fig. 13(b) shows the mean carried teletraffic plotted versus the standard deviation of the shadow fading for the range of shadow-fading frequencies. The figure illustrates that the car-ried teletraffic rolls off more rapidly, as the standard deviation increases, for faster fading rates. The reduction in carried tele-traffic, as the fading standard deviation is increased, is due to the wider power range over which the shadow fading may vary the received signal power. Hence, larger changes in the interference levels are inflicted upon other users, causing calls to be forcibly terminated and eventually reducing the carried teletraffic. The carried teletraffic performance is worse at higher shadow-fading frequencies, as observed for the forced termination performance earlier.
Fig. 14 shows the average number of handovers per call and the grade of service for a range of shadow-fading frequencies and fading standard deviations in the context of the LOLIA.
(a)
[image:11.612.324.532.62.406.2](a)
Fig. 13. (a) Forced termination performance and mean carried traffic versus (b) shadow fading standard deviation and frequency, using the LOLIA with an exclusion zone of seven cells(n = 7). A total of 1400 mobile users were simulated in a 49-cell area, all using the 4-QAM/QPSK modulation scheme.
The average number of handovers per call is shown to increase with the standard deviation and frequency of the shadow fading. Every time a handover is required, either because of moving between cells or due to increased interference, the chance of the call’s being forcibly terminated increases. Therefore, it is wise to restrict handovers to those calls that are most likely to succeed.
The figure shows that the number of handovers increases with both the frequency and the standard deviation of the shadow fading. However, it is at the higher fading frequencies that the variation of the standard deviation has the most pronounced ef-fect, with a ten-fold increase in the number of handovers per-formed upon increasing the standard deviation from 1.0 to 12.0 dB at a fading frequency of 2 Hz. At a fading frequency of 0.25 Hz, an increase by slightly less than a factor of 4.5 was observed under the same conditions. Hence, the combination of received signals and interfering signals varying rapidly over a wider range of powers leads to handovers’ being performed more frequently.
(a)
[image:12.612.323.531.58.407.2](b)
Fig. 14. (a) Average number of handovers per call and the GOS versus (b) shadow-fading standard deviation and frequency. The LOLIA with an exclusion zone of seven cells(n = 7) was used. A total of 1400 mobile users were simulated in a 49-cell simulation area, all using the 4-QAM/QPSK modulation scheme.
of service (i.e., increased). This is due to the combination of the higher fading frequencies and lower standard deviations, leading to shorter periods of time during which the received signal quality is poor, and hence low-quality accesses. However, at higher standard deviations, the variation of the received signal quality is significantly higher, and the increased fading frequency leads to a greater likelihood of a poor-quality access. In the next section, we investigate the effect of the standard deviation of the shadow fading on the FCA algorithm and the LOLIA.
H. Effect of Shadow Fading Standard Deviation on FCA and LOLIA
In this section, we study the effect of shadow fading on both fixed and DCA algorithms employed in a 49-cell network supporting 1200 users. We employed an FCA scheme with a seven-cell reuse cluster and the LOLIA using exclusion zones of both seven and 19 cells.
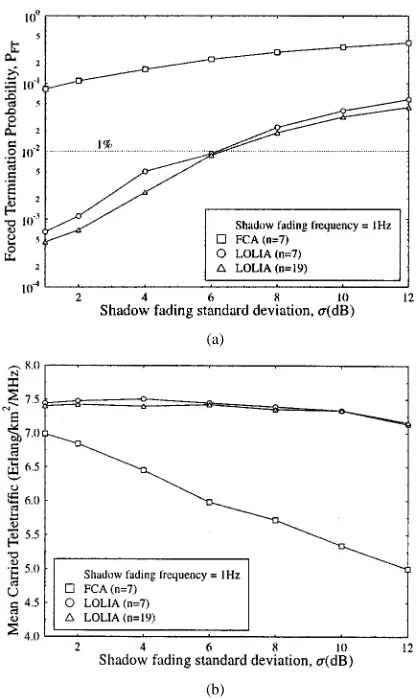
Fig. 15 shows the forced termination and carried traffic per-formance versus the standard deviation of the shadow fading for FCA and LOLIA in conjunction with and .
As the shadow-fading standard deviation increases, so does the range over which the desired signal power and the
unde-(a)
(b)
Fig. 15. (a) Forced termination probability and mean carried traffic versus (b) shadow fading standard deviation. Simulations use the LOLIA, with an exclusion zone of seven and 19 cells (n = 7 and 19), and FCA (n = 7). A total of 1200 mobile users were simulated in a 49-cell simulation area, all using 4-QAM/QPSK modulation thresholds.
sired interference power may vary. Hence, as the shadow-fading standard deviation increases, the received signal-to-interference ratio varies over a wider range at a higher rate of change. Fur-thermore, the chance of a handover to base stations that are not geographically the closest ones becomes more likely. Handovers to a base station when the mobile is not in that cell’s designed coverage area areis not a problem in the context of DCA algo-rithms, since they can adapt. However, such handovers can spu-riously reduce the designed reuse distance in FCA.
Fig. 15(a) shows the forced termination probability for the three channel allocation algorithms—namely, for FCA and for LOLIA using and . As expected, FCA is outperformed by the DCA algorithms. Furthermore, the LOLIA algorithm with the more stringent reuse distance constraint per-forms better than the LOLIA with an exclusion zone of . Although not shown in the figure, the FCA simulations exhibit a marked increase in the number of intracell handovers, or han-dovers within the same cell. This is a sign of the interference’s causing call outages and requesting an emergency intracell han-dover.
[image:12.612.63.265.62.405.2](a)
[image:13.612.62.269.60.403.2](b)
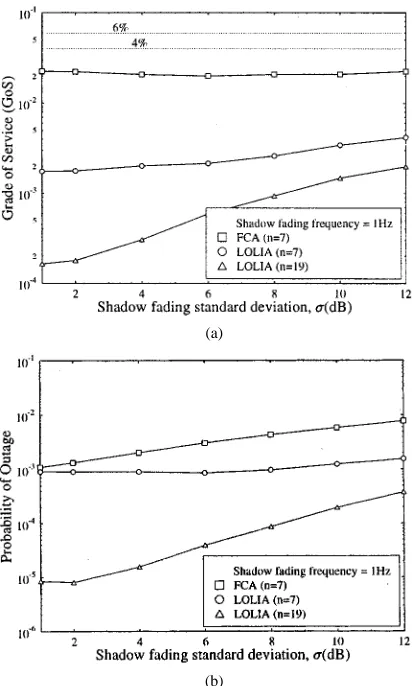
Fig. 16. (a) GOS performance and probability of outage versus (b) shadow-fading standard deviation. Simulations use the LOLIA with an exclusion zone of seven and 19 cells (n = 7 and 19), and FCA (n = 7). A total of 1200 mobile users were simulated in a 49-cell simulation area, all using the 4-QAM/QPSK modulation scheme.
LOLIAs, and the level of traffic carried decreases the most rapidly as the shadow-fading standard deviation is increased. The carried traffic upon using the LOLIAs remains nearly con-stant until a standard deviation of about 10 dB is reached, at which point a noticeable change of gradient occurs.
Fig. 16 displays various GOS performance metrics. The grade of service is the probability that a new call is blocked, or, if the call attempt is successful, that the quality of the channel pro-vided is poor, which is shown in Fig. 16(a). The figure demon-strates that the LOLIAs consistently provide a better (lower) grade of service than the FCA algorithm. The increased reuse distance of the LOLIA with results in a significantly lower grade of service than that of the LOLIA using an ex-clusion zone of seven cells. The FCA algorithm, with its fixed seven-cell reuse cluster size, exhibits the poorest performance, which remained approximately constant for all of the shadow-fading standard deviation values, a side-effect of the high rate of dropped calls. In other words, the number of low-quality ac-cesses is limited because the calls are frequently dropped once a low-quality access has occurred.
The probability of outage, which was defined in Sec-tion III-A, is shown in Fig. 16(b). Again, the LOLIA with offers the best performance, followed by the LOLIA using and, lastly, the FCA algorithm using a seven-cell
reuse cluster size. In the next section, we analyze the distribu-tion of the SINR profiles across the cells.
I. SINR Profile Across Cell Area
In addition to the performance metrics we derived in Sec-tion III-A, our mobile radio simulator can provide a range of other statistical characteristics, such as the signal quality across the simulation area. The simulator divides the service area into a fine grid, and for every time interval when a mobile is in a specific grid square, the statistics for that grid square are up-dated. For each grid square, the minimum, maximum, and av-erage values for the SIR, SINR, SNR, and the interference signal strength are recorded. In this section, we compare the uplink SINR profiles of the FCA algorithm and the LOLIA. For the LOLIA, we used an exclusion zone of 19 cells . This LOLIA setup uses information from the 19 nearest basestations and hence has approximately the same reuse distance as the FCA algorithm employing a seven-cell reuse cluster. However, in highly loaded situations, the number of interferers that are approximately the reuse distance away from the user could be far higher for the LOLIA than the limit of six in the case of the FCA algorithm.
Fig. 17 shows the minimum uplink SINR profile across the cell, which identifies the areas where the minimum SINR is very low. These are the areas where outages are more likely to occur. The figure shows that the minimum SINR is less pre-dictable for the LOLIA, since the contours are not as smooth as for FCA; and the three-dimensional view is less defined than for the FCA algorithm. However, the LOLIA achieves a higher minimum SINR than the FCA algorithm, as evidenced by the contour plots in Fig. 17(b) and (d). In these figures, the contours are at 5-dB intervals, with every 20-dB interval being labeled. The 40-dB contours are so small that they are not labeled in the FCA results shown in Fig. 17(b), whereas the 40-dB contour area is considerably larger for the LOLIA, as characterized in Fig. 17(d). Furthermore, the 20-dB contour is more erratic in the LOLIA simulations but is farther from the base stations, in-dicating a better signal quality between the base stations than for FCA.
The results in this section have demonstrated that the LOLIA achieves better SINR performance across the cell area than the FCA algorithm. In the next section, we attempt to combine the different performance metrics in order to produce an overall comparison between the various channel allocation algorithms that we have investigated.
J. Performance of the Adaptive Modulation Scheme Using Power Control and Adaptive Antennas over a Multipath Channel
(a) (b)
[image:14.612.85.505.69.497.2](c) (d)
Fig. 17. Minimum uplink SINR profile across the experimental area for several cells in the center of a 49-cell simulation. The results correspond to 1200 4-QAM/QPSK mobiles under uniform traffic distribution and without shadow fading, using FCA in conjunction with a seven-cell cluster size and the LOLIA using
n = 19. The contour lines are 5 dB apart. (a) FCA n = 7 (3-D view). (b) FCA n = 7 (contour view). (c) LOLIA n = 7 (3-D view). (d) LOLIA n = 7 (contour
view).
The call dropping probability, depicted in Fig. 18(b), shows that when invoking adaptive modulation, the FCA algorithm performs better than the LOLIA below a traffic load of about 32 erlangs/km /MHz. The FCA scheme consistently offered a lower call dropping probability when employing adaptive quadrature amplitude modulation (AQAM) than when using the 4-QAM modulation mode. However, the AQAM-assisted LOLIA using a two-element adaptive antenna array performed slightly worse than 4-QAM for traffic levels below about 30 erlangs/km /MHz. Nonetheless, above this level, the LOLIA performance remained relatively constant, whereas for 4-QAM, the dropping probability increased fairly sharply.
From Fig. 19(a), it can be seen that the GOS of the FCA al-gorithm did not benefit from AQAM to the same extent as the LOLIA. The FCA scheme using AQAM and a two-element an-tenna array offered a marginally lower, i.e., better GOS than fixed 4-QAM combined with a four-element antenna array.
Con-versely, the GOS of the LOLIA was reduced by up to a factor of 200 at a traffic load of about 40 erlangs/km /MHz. Above this load, the GOS increased steeply due to the nonzero blocking probability incurred under this traffic loading.
Fig. 19(b) shows that the probability of a low-quality access was reduced due to AQAM for both the FCA scheme and the LOLIA. For traffic loads below about 10 erlangs/km /MHz, the FCA algorithm using AQAM behaved similarly to fixed 4-QAM, but when more moderate levels of traffic were reached, the advantage of adaptive modulation increased. Likewise, for low traffic levels, the LOLIA gained little from investing in AQAM, but for higher traffic loading, the probability of a low-quality access’ occurring levelled off to a near constant value.
(a)
[image:15.612.64.269.60.411.2](b)
Fig. 18. (a) New call blocking and call dropping probabilities versus (b) mean carried traffic of the LOLIA usingn = 7, and of FCA employing a seven-cell reuse cluster, for two- and four-element antenna arrays, with and without adaptive modulation.
least throughput, with its performance degrading near linearly with increasing network traffic. The LOLIA, especially for the lower levels of traffic, offered a higher modem throughput for a given level of teletraffic carried, with the performance grace-fully decreasing as the carried teletraffic continued to increase. The mean transmission power results of Fig. 20(b) demon-strate how the employment of AQAM can reduce the power transmitted for both the up- and the downlink. At low traffic levels, the FCA algorithm performed noticeably worse in trans-mitted power terms than the LOLIA. However, as the traffic loads increased, the difference became negligible. By contrast, the gap between the up- and the downlink powers was close to zero for the lighter traffic loads, but as the level of network traffic increased, so did the difference, with 2 dB extra transmit power required on the uplink for the maximum traffic load sim-ulated. This resulted from the interfering mobiles’ being lo-cated closer to the serving base station than the interfering base stations are to the served mobile. The mean power reduction, when compared to a fixed transmission power of 10 dBm, varied from approximately 1 to more than 8 dB. A 1-dB reduction in transmission power is not particularly significant for the mo-bile user, especially since at this network load, a throughput of just 2 bits/symbol is possible. The difference between the net-work using adaptive modulation and that without, though, is the
(a)
[image:15.612.324.531.62.412.2](b)
Fig. 19. (a) GOS and probability of a low-quality outage versus (b) mean carried traffic of the LOLIA usingn = 7, and of FCA employing a seven-cell reuse cluster, for two- and four-element antenna arrays with and without adaptive modulation.
overall improved call quality that can be achieved in these cir-cumstances.
K. Overview of Results
In our previous investigations, we have simulated several channel allocation algorithms. However, no single algorithm performs best in terms of every performance metric. Therefore, in order to compare our results for the fixed and the various DCA algorithms, it is necessary to consider a combination of performance metrics. Sometimes an algorithm may provide excellent performance in terms of one metric but poor perfor-mance in terms of another. Therefore, we defined a conservative and a lenient scenario as follows:
1) a conservative scenario, where the maximum acceptable value for the new call blocking probability is 3%, for the forced termination probability is 1%, for is 1%, and for the GOS is 4%.
2) a lenient scenario, in which the forced termination prob-ability still must be less than 1% but the maximum tolerable percentage for the blocking probability is 5%, for is 2%, and for the GOS is 6%.
(a)
[image:16.612.63.266.59.409.2](b)
Fig. 20. (a) Mean modem throughput in terms of bits per symbol and mean transmit power versus (b) mean carried traffic of the LOLIA usingn = 7, and of FCA employing a seven-cell reuse cluster, for two- and four–element antenna arrays with adaptive modulation. Without adaptive modulation, mean throughout was 2 b/s and mean transmit power was+10 dB.
The maximum traffic load, measured in terms of the number of users in the system that could be served while maintaining the constraints imposed by the above two scenarios, is shown in Table III, portraying results for both uniform and nonuniform traffic distributions. The number of users in the table is dis-tributed over the 49-cell simulation area, which is 6 km . There-fore, a network load of 1200 users represents a user density of 198 users/km . The table shows that the DCA algorithms can cope with more users than the FCA algorithm under both uni-form and nonuniuni-form traffic distributions.
While this table is useful for finding the amount of traffic that can be handled under certain constraints, it can give misleading impressions. For example, the two LOLIAs with different exclusion zones seem to have a similar performance. However, this is a somewhat simplistic view, since the LOLIA with the larger exclusion zone has a better quality of service than the other LOLIA , at the expense of higher probability of blocking new calls. The two LOLIAs appear to have a similar performance, since the capacity of the LOLIA using is limited by the new call blocking performance, whereas the LOLIA with is constrained by the low-quality access constraint. This implies that the network capacity of the LOLIA, with an exclusion zone of seven base
stations, is limited by the levels of interference. Hence, the addition of adaptive antennas increased the network capacity significantly, as can be clearly seen in Table III. In fact, an increase in the number of supported users of between 50–60% was observed for a four-element adaptive antenna array. The FCA algorithm with a seven-cell cluster size also benefitted significantly through the use of adaptive antenna arrays at the base stations, with an additional 100% of users served. However, the network capacity of the FCA algorithm using a 12-cell reuse pattern was not enhanced by the implementation of adaptive antennas, since its capacity was restricted by the new call blocking probability. These differences between the two FCA algorithms are confirmed by their performances in the shadowing environment, with the 12-cell cluster size variant performing better due to its greater reuse distance, leading to lower levels of interference. The LOLIA supports the higher number of users in the shadowing environment due to its dynamic configurability and goal of interference minimization. The network capacity of the LFA is limited to less than 500 users in the conservative scenario, but in the lenient scenario 1430 users are supported. This is due to the probability of low-quality access metric (not shown), which only dipped below 1% with less than 500 users.
Table III also demonstrates that the LOLIA can maintain the required performance constraints for the highest number of users in both the conservative and lenient scenarios, and with both uniform and nonuniform traffic distributions. In addition, the table shows that the DCA algorithms that attempt to reduce the interference, like LIA, LTA, and LOLIA, typically achieve a better overall performance than the radio spectrum packing algorithms, such as LOMIA and MTA.
In addition, the table shows the large increases in network capacity that can be obtained through the use of adaptive modu-lation. The network capacity of the FCA algorithm was limited by its network performance (as opposed to a data throughput restriction of 2 bits/s) and hence, at its maximum capacity, pro-vided a mean data throughout of between 2.6 and 2.9 bits/s. However, the LOLIA exploited the network to a greater ex-tent due to its dynamic nature, which resulted in a network per-formance limited by the mean data throughput for the two-tenna-element case. Hence, for the two-element adaptive an-tenna array, the change in mean modem throughput was 0%, but an additional 87% of network users were supported. The network using four-element adaptive antenna arrays exhibited a 59% gain in the number of supported users while benefitting from a 6.5% improvement in mean modem throughput.
V. CONCLUSION
In this paper, we have discussed various DCA techniques and compared their performance to FCA both with and without shadow fading and under both uniform and nonuniform traffic distributions, using the performance metrics of Section III-A. The various channel allocation algorithms have different and sometimes opposite aims; hence a variety of performance met-rics were required to quantify their performance.
TABLE III
MAXIMUMNUMBER OFMOBILEUSERSTHATCANBESUPPORTEDUSING THEALGORITHMSINVESTIGATEDWHILEMEETING THEDESIREDSYSTEM
CONSTRAINTS FORUNIFORMTRAFFIC(UT)ANDNONUNIFORMTRAFFIC(NUT) DISTRIBUTIONS. THEUSERS IN THESYSTEMAREDISTRIBUTED OVER THE
49-CELLSIMULATIONAREA, WHICHIS6 km . THESIMULATIONPARAMETERSWEREDESCRIBED INTABLEI
both uniform and nonuniform traffic conditions, and also in a slow fading propagation environment. The LOMIA with offered similar performance under nonuniform traffic condi-tions and under the uniform traffic distribution in the lenient sce-nario. However, the LOMIA did not perform well in the shad-owing environment, with the LOLIA offering a significantly higher network capacity in the shadowing environment than the FCA algorithm or the LOMIA.
The benefits of using adaptive antenna arrays have been demonstrated, with improved network quality for an increased number of users, for both the FCA algorithm and the LOLIA. These benefits were then extended through the use of adaptive modulation to further improve call quality while simultane-ously increasing the data throughput and the number of users adequately supported by the network.
A range of interesting further research problems arise when these algorithms are combined with statistical multiplexing al-gorithms or when burst-by-burst adaptive modems and slot clas-sification algorithms are invoked, where more robust modem modes can be employed in strongly interfered channels while supporting more bandwidth-efficient modem modes in unin-terfered slots. Exploiting the spatial dimension with the aid of adaptive antennas is also a promising research area.
ACKNOWLEDGMENT
The authors would like to thank the EPSRC, U.K., and the Virtual Centre of Excellence in Mobile Communications, U.K. They would also like to thank numerous professional friends for fruitful discussions.
REFERENCES
[1] E. Sourour, “Time slot assignment techniques for TDMA digital cellular systems,” IEEE Trans. Veh. Technol., vol. 43, pp. 121–127, Feb. 1994. [2] S. W. Wales, “Technique for cochannel interference suppression in
TDMA mobile radio systems,” Proc. Inst. Elect. Eng. Commun., vol. 142, no. 2, pp. 106–114, 1995.
[3] J. Litva and T. Lo, Digital Beamforming in Wireless Communica-tions. Norwood, MA: Artech House, 1996.
[4] L. Godara, “Applications of antenna arrays to mobile communications, part I: Performance improvement, feasibility, and system considera-tions,” Proc. IEEE, vol. 85, pp. 1029–1060, July 1997.
[5] , “Applications of antenna arrays to mobile communications, part II: Beam-forming and direction-of-arrival considerations,” Proc. IEEE, vol. 85, pp. 1193–1245, Aug. 1997.
[6] S. Tekinay and B. Jabbari, “A measurement-based prioritization scheme for handovers in mobile cellular networks,” IEEE J. Select. Areas Commun., vol. 10, no. 8, pp. 1343–1350, 1992.
[7] G. P. Pollini, “Trends in handover design,” IEEE Commun. Mag., vol. 34, pp. 82–90, Mar. 1996.
[8] R. C. Bernhardt, “Timeslot re-assignment in a frequency reuse TDMA portable radio system,” IEEE Trans. Veh. Technol., vol. 41, pp. 296–304, Aug. 1992.
[9] J. C. I. Chuang, “Performance issues and algorithms for dynamic channel assignment,” IEEE J. Select. Areas Commun., vol. 11, pp. 955–963, Aug. 1993.
[10] J. C. I. Chuang and N. R. Sollenberger, “Performance of autonomous dy-namic channel assignment and power control for TDMA/FDMA wire-less access,” IEEE J. Select. Areas Commun., vol. 12, pp. 1314–1323, Oct. 1994.
[11] M. M. L. Cheng and J. C. I. Chuang, “Performance evaluation of distributed measurement-based dynamic channel assignment in local wireless communications,” IEEE J. Select. Areas Commun., vol. 14, pp. 698–710, May 1996.
[12] L. Hanzo, P. Cherriman, and J. Streit, Wireless Video Communications: From Second to Third Generation Systems and Beyond. New York: IEEE Press, 2001.
[14] E. D. Re, R. Fantacci, and G. Giambene, “Handover and dynamic channel allocation techniques in mobile cellular networks,” IEEE Trans. Veh. Technol., vol. 44, pp. 229–237, May 1995.
[15] I. ChihLin and C. PiHui, “Local packing—Distributed dynamic channel allocation at cellular basestation,” in Proc. IEEE Globecom’93, vol. 1, Houston, TX, Nov. 29–Dec. 2 1993, pp. 293–301.
[16] L. C. Godara, “Applications of antenna arrays to mobile communica-tions, part I: Performance improvement, feasibility, and system consid-erations,” Proc. IEEE, vol. 85, pp. 1029–1060, July 1997.
[17] J. H. Winters, “Smart antennas for wireless systems,” IEEE Personal Commun., vol. 5, pp. 23–27, Feb. 1998.
[18] D. Gerlach and A. Paulraj, “Adaptive transmitting antenna arrays with feedback,” IEEE Signal Processing Lett., vol. 1, pp. 150–152, Oct. 1994. [19] , “Basestation transmitting antenna arrays for multipath
environ-ments,” Signal Process., pp. 59–73, 1996.
[20] L. Hanzo and J. Stefanov, “The pan-European digital cellular mobile radio system—Known as GSM,” in Mobile Radio Communications, R. Steele and L. Hanzo, Eds. Piscataway, NJ: IEEE Press, 1999, ch. 8, pp. 677–765.
[21] W. C. Jakes, Ed., Microwave Mobile Communications. New York: Wiley, 1974.
[22] S. Tekinay and B. Jabbari, “Handover and channel assignment in mobile cellular networks,” IEEE Commun. Mag., pp. 42–46, Nov. 1991. [23] I. Katzela and M. Naghshineh, “Channel assignment schemes for
cellular mobile telecommunication systems: A comprehensive survey,” IEEE Personal Commun., pp. 10–31, June 1996.
[24] J. Liberti and T. Rappaport, “A geometrically based model for line-of-sight multipath radio channels,” in Proc. VTC, 1996, pp. 844–848. [25] R. Ertel, P. Cardieri, K. Sowerby, T. Rappaport, and J. Reed, “Overview
of spatial channel models for antenna array communications systems,” IEEE Personal Commun., pp. 10–22, Feb. 1998.
[26] R. Kohno, “Spatial and temporal communication theory using software antennas for wireless communications,” in Wireless Communications: TDMA Versus CDMA. Norwood, MA: Kluwer, 1997, ch. 1, pp. 293–321.
[27] Y. Ogawa and T. Ohgane, “Adaptive antennas for future mobile radio,” IEICE Trans. Fundamentals, pp. 961–967, July 1996.
[28] A. S. Tanenbaum, “Introduction to queueing theory,” in Computer Networks, 2nd ed. Englewood Cliffs, NJ: Prentice-Hall, 1989, pp. 631–641.
Jonathan Blogh received the M.Eng. degree (with distinction) in information
engineering and the Ph.D. degree in mobile communications, both from the Uni-versity of Southampton, U.K., in 1997 and 2000, respectively.
His current areas of research include the networking aspects of FDD and TDD mode third-generation mobile cellular networks.
Mr. Blogh received the Lord Lloyd of Kilgerran Memorial Prize from the Institute of Electrical Engineering, U.K., in 1997 for interest and commitment to mobile radio and RF engineering.
Peter Cherriman received the M.Eng. degree in information engineering from
the University of Southampton, U.K., in 1994, where he is currently pursuing the Ph.D. degree in mobile video networking in the Department of Electronics and Computer Science.
Currently, he is working on projects for the Mobile Virtual Centre of Excel-lence, U.K. His current areas of research include robust video coding, microcel-lular radio systems, power control, dynamic channel allocation, and multiple-ac-cess protocols.
Lajos Hanzo (M’91–SM’92) received the Masters degree (Dipl. Ing.) in
elec-tronics and the Ph.D. degree, both from the Technical University of Budapest, Hungary, in 1976 and 1983, respectively.