1
Study on Pollutants Formation under Knocking Combustion
1
Conditions using an Optical Single Cylinder SI Research Engine
2
Apostolos Karvountzis-Kontakiotis1,2,*, Hassan Vafamehr1, Alasdair Cairns3, Mark Peckham4 3
1. Brunel University London, Department of Mechanical, Aerospace & Civil Engineering, CAPF – Centre of
4
Advanced Powertrain and Fuels, Uxbridge, UB8 3PH, United Kingdom
5
2. City University London, School of Mathematics, Computer Science and Engineering, Northampton Square,
6
London EC1V 0HB, United Kingdom
7
3. Faculty of Engineering, University of Nottingham, University Park, Nottingham NG7 2RD, United Kingdom
8
4. Cambustion Ltd., 347 Cherry Hinton Road, Cambridge CB1 8DH, United Kingdom
9
* Corresponding author email: a.karvountzis@brunel.ac.uk
10
11
Abstract
12The aim of this experimental study is to investigate the pollutants formation and cyclic
13
emission variability under knocking combustion conditions. A great number of studies
14
extensively describe the phenomenon of knock and its combustion characteristics as well as
15
the effect of knock on engine performance; however the impact of knocking combustion on
16
pollutants formation and how it affects cyclic emission variability has not been previously
17
explored. In this study, an optical single cylinder SI research engine and fast response analyzers
18
were employed to experimentally correlate knocking combustion characteristics with cyclic
19
resolved emissions from cycle to cycle. High-speed natural light photography imaging and
20
simultaneous in-cylinder pressure measurements were obtained from the optical research
21
engine to interpret emissions formation under knocking combustion. The test protocol included
22
the investigation of the effect of various engine parameters such as ignition timing and mixture
23
air/fuel ratio on knocking combustion and pollutant formation. Results showed that at
24
stoichiometric conditions by advancing spark timing from MBT to knock intensity equal to 6
25
bar, instantaneous NO and HC emissions are increased by up to 60% compared to the MBT
26
operating conditions. A further increase of knock intensity at the limits of pre-ignition region
27
was found to significantly drop NO emissions. Conversely, it was found that when knocking
28
combustion occurs at lean conditions, NO emissions are enhanced as knock intensity is
29
increased.
2 31
32
Keywords:
knocking combustion, cycle resolved emissions, NO formation, optical research33
engine, cyclic emission variability
34
35
36
Highlights
37 Experimental investigation of knocking combustion and cycle resolved emissions.
38
Effect of knock index on NO formation.
39
Utilization of instantaneous flame images to interpret emissions formation.
40
Effect of knock and heavy knock conditions on cyclic emission variability.
41
42
43
44
Nomenclature
45Acronyms
ATDC After Top Dead Centre imep Indicated mean effective pressure
Bmep break mean effective pressure KI Knock Intensity
BTDC Before Top Dead Centre MBT Maximum Breaking Torque
CCV Cyclic Combustion Variability NO Nitric Oxide
CEV Cyclic Emission Variability SI Spark Ignition
COV Coefficient of Variation TDC Top Dead Centre
HC Hydrocarbons λ Air/fuel equivalence ratio
46
47
48
3
1
Introduction
50
Gasoline engine technology has entered one of the most exciting periods in its long history:
51
downsizing, hybridization and stricter emission standards determine the future of SI engines
52
[1]. Advanced engine requirements for high power density and low fuel consumption can be
53
achieved through high boost, direct injection, engine start&stop [2] and lean burn operation.
54
Implementation of this technology in SI engines increases the potential possibility that under
55
certain operating conditions auto-ignition or pre-ignition can occur [3]. Knock not only limits
56
engine thermal efficiency but it also affects the formed emissions during combustion. As
57
pollutants formation is directly linked to the combustion process, it is critical to understand the
58
effect of abnormal combustion cycles on emissions performance and variability. To this end,
59
meeting fuel economy requirements and future emission standards in high-efficiency SI
60
engines requires a well understanding of knock and its effect on engine emissions.
61
Knock is as old as SI engine itself [4] and takes its name from the metallic ‘pinging’ noise that
62
auto-ignition (spontaneous combustion) creates before the piston reaches TDC. Knock can be
63
divided into two main groups: light to medium knock and super knock. Light to medium knock
64
limits compression ratio and as a consequent the engine thermal efficiency due to the end-gas
65
auto-ignition. Auto-ignition is the fast discharge of chemical energy contained in the end-gas,
66
which is the final fraction of the air-fuel mixture that enters the cylinder but without inclusion
67
into the flame front reaction [5], [6]. On the other hand, super knock limits raising the boost
68
pressure and the engine power density due to detonation, also known as pre-ignition [7], [8].
69
Pre-ignition occurs earlier to auto-ignition and leads to a fast and violent combustion that can
70
potentially damage the engine. Apart of the great number of studies on knocking combustion,
71
the correlation between knock intensity, heat transfer, fuel chemistry, pressure oscillations and
72
oil droplets is not well understood [3]. Nowadays, the main research focuses on super knock
73
due to the high boost technology applied in high power density downsized engines, which
74
usually occurs under low speed and high load engine operating conditions.
75
Fuel and cylinder charge properties as well as engine calibration can affect combustion
76
characteristics and simultaneously affect the formed emissions. Methods for suppressing
77
engine knock and controlling emissions involve the optimization of those parameters.
78
Conventional suppression methods of engine knock include control strategies for retarding
79
spark timing [9], raising fuel octane number by using additives [10], [11] and enriching mixture
80
[12] when knock occurs. Recent studies correlated the effect of cooled EGR with the reduction
81
of knocked cycles and fuel consumption. Diana et al. presented a knock free operation of a
4
stoichiometric SI engine at full load conditions with a compression ratio of 12.5 by using
83
cooled EGR [5]. Same trend was also observed in another experimental study where it was
84
shown that the resistance to knock is strongly increased by cooled EGR [13]. It was also found
85
that utilization of EGR can significantly reduce emissions by up to 90% [5], [14], [15], while
86
HC emissions increase across the EGR range [16], [17]. Air-fuel ratio can also affect engine
87
knock limit. Although leaner mixtures benefit fuel consumption, retarded combustion is
88
required to avoid knock [6], while over-fuelling increases the knock limits of the engine [18].
89
In another study, it is reported that the EGR and the lean burn operation exhibit lower average
90
knock indexes. Due to the longer combustion duration by utilizing EGR and lean burn, heat
91
transfer is enhanced and end-gas temperature is decreased [19]. Conversely, another
92
experimental work using a single cylinder research engine that was supplied with ON 75
93
proved that lean mixtures have the earliest onset of knock, and the highest knock intensity [20].
94
Furthermore it was noted that lean mixtures are particularly sensitive to the charge heating
95
during compression. Overall, this research implies that excess air at high loads does not
96
suppress knock.
97
More than 700 research studies exist in literature on the research area of engine knock [3]. The
98
main research studies that deal with engine knock can be categorized on knock detection,
99
numerical simulation, optical diagnostics, theoretical studies, engine optimization and fuel/oil
100
properties. Although knocking combustion can significantly affect formed emissions, the effect
101
of knocking combustion on pollutants formation is at an even earlier research stage and there
102
is a significant lack of studies in this research field.
103
Pollutants formation during engine combustion is correlated both with mixture properties such
104
as air/fuel ratio, residual gas fraction and fuel properties and with the combustion type. At
105
normal combustion conditions (deflagration), NOx formation is primarily controlled by oxygen
106
availability under lean or rich conditions while within the stoichiometric window formed NOx
107
concentration is correlated with the combustion burn rate [21]. Under no knocking combustion,
108
previous studies showed that as in-cylinder peak pressure is increased, NOx emissions are
109
proportionally increased [21]–[23]. However under knocking combustion, the emissions
110
formation mechanism can significantly change. As knock intensity is increased, residence time
111
of the residual gases in the burned zone is significantly decreased and peak temperature can be
112
enhanced. On the one hand, under super knock conditions combustion duration is decreased to
113
less than 2o CA which means that combustion is almost isochoric, post-combustion residence
114
time is significantly lower but peak temperature and pressure are much higher than in normal
5
SI combustion. Such a type of combustion presents many similarities with HCCI combustion
116
that is known for the ultra-low NOx emissions and the relatively higher CO and HC emissions
117
[24]. On the other hand, under light knock conditions NOx concentration that is formed in the
118
post-flame zone during normal combustion is expected to be increased due to the high
119
temperatures of end gas auto-ignition. However, the above described trends have not been
120
explored in literature and more research is required to well understand the relationship between
121
pollutants formation and knock index.
122
A great number of research studies investigate the main mechanisms of pollutants formation,
123
described in detailed elsewhere [25]. The most well-known NOx formation mechanism is the
124
thermal one, co-called as extended Zeldovich mechanism which is responsible for the majority
125
of the formed NO in the post flame gas zone [26], [27]. Apart from the thermal mechanism,
126
the prompt NO mechanism [28] can be significant at stoichiometric and richer mixtures [29],
127
[30], the N2H mechanism becomes important at slightly rich conditions [31] and finally the
128
N2O chemical pathway appears at slightly lean conditions [26], [32]. Regarding carbon
129
monoxide, CO formation is mainly kinetically controlled by water gas shift reaction [33].
130
Finally, hydrocarbons (HC) are the consequence of incomplete combustion of hydrocarbon
131
fuel [34]. In most studies, simplified chemical mechanisms are utilized to predict pollutants
132
formation [29], [35]. Recently, Karvountzis et al. [36], [37] proposed the use of a detailed
133
chemical kinetics model to predict pollutants formation in an SI engine, which operates in the
134
post-combustion zone. The latter is the most accurate state-of-the art emission model existing
135
in literature, as the validation against experimental cycle resolved emission values for both NO
136
and CO emissions under various engine operating conditions showed errors less than 10% and
137
compared to simplified emissions models improvements were higher than 50% [38]. However
138
the accuracy of this emission model under knocking conditions has not been explored, due to
139
the lack of experimental data.
140
Although the relationships between combustion characteristics and pollutant formation under
141
normal combustion have been explored in the past, the effect of knocking combustion on
142
pollutants formation is not well understood. Few studies in the past presented an engine model
143
that can predict knock limit and NOx emissions [39], [40], [41]; however those models do not
144
present the pollutant formation under knocking combustion conditions. The only known
145
relationship is that knock results to an increase in CO and HC emissions due to incomplete
146
combustion [42]. Furthermore, there is a lack of experimental data at this research field, as
147
there are no experimental studies presenting the correlations between knock index and
6
emissions performance on a cycle to cycle base. Simultaneously, the effect of pressure
149
oscillations and hot spots (occurring during knocking combustion) on pollutants formation is
150
also unknown. In the past, fast response analyzers were successfully employed to measure
151
cyclic emission variability under normal combustion conditions [43]. Optical diagnostics have
152
been also utilized to deeper understand the end gas auto-ignition mechanism and explore the
153
detonation limits at pre-ignitive cycles [7]. However, as authors are aware, a study that employs
154
both fast response analyzers to detect emissions from cycle to cycle and optical diagnostics to
155
correlate combustion characteristics with cycle resolved emissions doesn’t not exist in
156
literature.
157
This experimental work studies the correlation between pollutants formation and knock index,
158
primarily NO and HC, under various air-fuel ratio and spark ignition timings using an optical
159
single cylinder SI engine. Fast response analyzers were employed to measure the cycle resolved
160
NO and HC emissions. Images of the visible light from combustion heat were captured through
161
an overhead window using a high speed camera. The aim of this study is to give insights
162
between the type of combustion (deflagration, end gas auto-ignition and detonation) and the
163
formed emissions and determine by which extent emissions are increased under knock. The
164
output of this study can be applicable to new engine design requirements for more efficient and
165
less pollute SI engines. To the best knowledge of the authors, this is a unique study of its kind.
166
2
Experimental Setup
1672.1 Optical Engine 168
A customized single cylinder research engine with a distinct optical arrangement was employed
169
in this study [18], [44], [45]. The basic engine characteristics of the engine are presented in
170
Table 1. The bottom-end of the engine is based on a commercial Lister-Petter TSI with a
171
combined full-bore overhead access and a semi-traditional poppet-valve valvetrain. Due to the
172
full-bore overhead optical access, the glass of the engine head was designed to withstand peak
173
combustion pressures up to 150bar. The engine incorporates a flat piston crown, two inlet ports,
174
and originally was designed with two exhaust ports. As the purpose of this study is focused on
175
knocking combustion, one of the exhaust valves was deactivated in order to assist end-gas
176
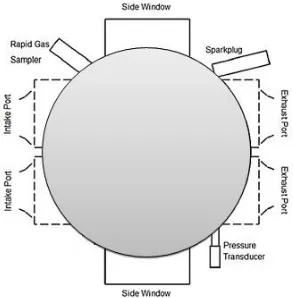
autoignition, by increasing residual gas fraction [46]. A schematic presentation of the optical
177
cylinder head is illustrated in Figure 1. The recessed side mounted poppet valves guaranteed
178
valve overlap without piston clash and to maintain a compression ratio of 8.4:1 [45]. Last but
7
not least, the research engine was coupled to an eddy-current dynamometer with a maximum
180
power absorption/supply of 10kW.
181
[image:7.595.144.437.135.433.2]182
Figure 1: Schematic presentation of the optical engine cylinder head [18].
183
Table 1: Engine characteristics of the optical single cylinder research engine.
184
Parameter (unit) Value
Number of Cylinders (-) 1
Compression Ratio (-) 8.4:1
Stroke (mm) 89
Bore (mm) 95
Displacement (cc) 631
Con-rod Length (mm) 165.16
Valve Lift (mm) 5
Inlet Valve Openings/Closing (oBTDC) 375/145
[image:7.595.172.424.510.764.2]8
The engine fuel supply was regulated by a Bosch EV6 PFI fuel injector operating at 3 bar rail
185
pressure. The PFI injector had a 2-hole pattern forming a dual plume spray pattern targeted
186
toward the intake valves. The injection timing was fixed at 400o BTDC firing under all
187
operating conditions. The fuel used in these tests is PRF75, as a result of blending isooctane
188
and n-heptane (provided by a chemical supplier) on a volumetric basis in small batches
189
immediately prior to each testing session. The chemical properties of the reference fuels are
190
provided in Table 2. The ignition system consisted of an NGK ER9EH 8mm spark plug
191
supplied by a Bosch P100T ignition coil.
[image:8.595.64.441.276.540.2]192
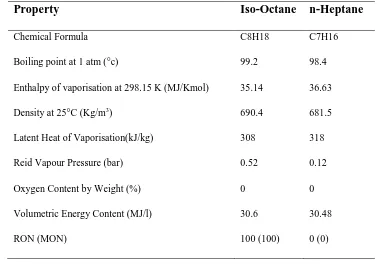
Table 2: Fuel properties
193
Property Iso-Octane n-Heptane
Chemical Formula C8H18 C7H16
Boiling point at 1 atm (°c) 99.2 98.4
Enthalpy of vaporisation at 298.15 K (MJ/Kmol) 35.14 36.63
Density at 25°C (Kg/m3) 690.4 681.5
Latent Heat of Vaporisation(kJ/kg) 308 318
Reid Vapour Pressure (bar) 0.52 0.12
Oxygen Content by Weight (%) 0 0
Volumetric Energy Content (MJ/l) 30.6 30.48
RON (MON) 100 (100) 0 (0)
194
2.2
Experimental Configuration and Measurements
195Experiments were conducted using the experimental setup schematically illustrated in Figure 196
2, while the main specifications of the relevant components are presented in Table 3. The test
197
protocol included the recording of high frequency data, low frequency data and natural light
198
photography data. The high frequency data were recorded in a National Instruments (NI) data
199
acquisition card and included the in-cylinder pressure, encoder crankangle signal, exhaust
200
temperature and exhaust NO and HC emissions recordings from the fast response analyzers.
201
The low sampling frequency data comprised ECU derived signals, including air/fuel ratio value
202
(λ sensor), ignition timing, throttle position, inlet air pressure and temperature and coolant
203
temperature. Recording also included the high frequency photography data of the combustion
9
evolution. Finally, the three (3) set of data are stored in a computer as it is illustrated in Figure 205
2.
206
[image:9.595.78.438.126.397.2]207
Figure 2: Schematic illustration of the experimental configuration.
208
209
An AVL GH14DK pressure transducer was implemented on the side of the exhaust valves to
210
measure cylinder pressure (Figure 1). It was manufactured to fit this particular handmade
211
engine cylinder head and its position was at the region where autoignition usually takes place.
212
It has to be mentioned that when knock occurs, pressure distribution across the combustion
213
chamber is not uniform and the location of the transducer can affect the recordings [47]. The
214
signal from the transducer was fed to an AVL Flexifem charge amplifier. The error in the
215
cylinder pressure measurement was less than ±1% full scale reading (FSO). The exhaust gas
216
temperature was measured with a K-type thermocouple connected to the relevant transducer,
217
with maximum error of ±0.75% of reading. The response time of the thermocouple was low
218
(0.1sec); therefore the thermocouple was utilized to measure averaged temperature per cycle
219
rather than monitoring exhaust temperature profile. The total experimental rig is presented in
220
Figure 3.
221
10 223
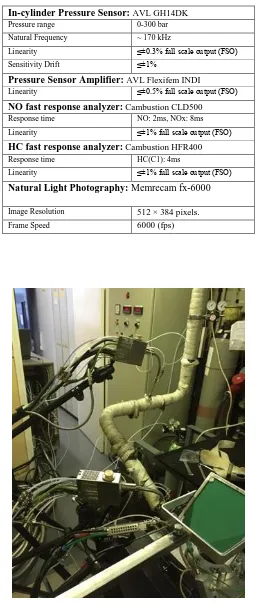
Table 3: Main specifications of measurement equipment.
224
In-cylinder Pressure Sensor:AVL GH14DK
Pressure range 0-300 bar Natural Frequency ~ 170 kHz
Linearity ≤±0.3% full scale output (FSO) Sensitivity Drift ≤±1%
Pressure Sensor Amplifier: AVL Flexifem INDI
Linearity ≤±0.5% full scale output (FSO)
NO fast response analyzer: Cambustion CLD500
Response time NO: 2ms, NOx: 8ms Linearity ≤±1% full scale output (FSO)
HC fast response analyzer: Cambustion HFR400
Response time HC(C1): 4ms
Linearity ≤±1% full scale output (FSO)
Natural Light Photography: Memrecam fx-6000
Image Resolution 512 × 384 pixels.
Frame Speed 6000 (fps) 225
226
[image:10.595.181.417.408.724.2]227
Figure 3: The experimental test rig.
11
High frequency cycle resolved exhaust emissions measurements were conducted using two fast
229
response analyzers from Cambustion Ltd. The Cambustion CLD500 analyzer was employed
230
for the cycle resolved NO emissions. From the two available sampling heads of this analyzer,
231
one was used and installed directly downstream of the exhaust valve of the cylinder, while the
232
second probe was installed downstream enough to the exhaust gases to get an average value of
233
NO emissions. The sampling response time of NO emissions was in the order of 2 ms (Table 234
3). Simultaneously, Cambustion HFR400 analyser was employed for HC measurement. The
235
only used sampling head was installed downstream of the exhaust valves and its sampling time
236
was about 4 ms. Signals from both heads (3 in total) were directed to the NI data acquisition
237
card.
238
[image:11.595.138.463.293.522.2]239
Figure 4: Schematic of experimental setup for combustion imaging
240
Images of the visible light from combustion heat were captured through an overhead window
241
as shown in Figure 4. The camera was capable of imaging at 6000 frames per second (fps) with
242
a resolution of 512 x 384 pixels. All cycles presented in this paper were imaged at 6000fps
243
with an exposure time of 167μs. The internal memory of the camera allowed for a total of
244
10,000 frames to be recorded before the data were stored in a hard drive (laptop). At 1200rpm
245
this allowed for 16 cycles to be recorded in a single test. Due to the large variation in intensity
246
of the light emission from combustion between cycles, the gain was adjusted for each cycle to
247
improve the clarity of the images.
12
The reason that in this study an optical engine has been employed is to qualitatively explain
249
the cyclic resolved emission values under various knocking conditions by utilizing optical data.
250
Realistic results from commercial engines may quantitatively change, as explained elsewhere
251
[44].
252
2.3 Engine Test Protocol 253
A fixed reference point was obtained by running the engine under normal non-knocking
part-254
load operation until the cylinder head metal temperature reached 88°C. At this temperature
255
knock was induced by resetting the spark timing. After capturing the data, the engine was
256
stopped and allowed to cool down before the process repeated. This process kept the measured
257
wall temperatures within a small range (<5oC peak-to-peak variation), which was considered
258
necessary when considering knock in a qualitative manner with an engine setup lacking water
259
cooling in the head. The thermodynamic results were averaged over three sets of 100 cycles
260
for each test condition. The sump oil temperature remained moderately low throughout testing
261
(~40°C). Table 4 shows the engine test conditions.
[image:12.595.175.423.410.596.2]262
Table 4: Engine operating conditions.
263
Parameter (unit) Value
Engine Speed (RPM) 12005
Relative AFR (λ) 10.01
Inlet Pressure (bar) 0.90.02
Inlet Air Temperature (oC) 662
Exhaust Bridge Temperature (oC)
1302
Head Temperature (oC) 881
264
2.4 Data Processing 265
An example of processing the in-cylinder pressure of two consecutive cycles with KI index
266
0.76 bar (light knock cycle) and 15.1 bar (super knock cycle) respectively versus NO
267
concentration is given with reference to Figure 5. During the valve-closed part of the current
268
cycle, the analyzer measures the NO level of the gas remained in the exhaust manifold from
269
the previous cycle. When exhaust valve opens (EVO) a portion of the (in-cylinder) gas
270
violently exits the cylinder (blow-down) and clears the exhaust manifold from the previous
13
cycle gas. However, a delay between EVO and analyzer response (point A in Figure 5) is
272
observed, attributed to the distance between the valve outlet and the sampling probe, as well as
273
to the instrument response time [23]. After the exhaust valve closes (EVC), the analyzer signal
274
exhibits a slight fluctuation (area B-C in Figure 5), indicating a variation of NO concentration
275
in the cylinder gas. The NO concentration may vary from cycle to cycle due to the combustion
276
process. During the closed part of the next cycle, the analyzer signal can be considered constant
277
(part C-D in Figure 5) and corresponds to the NO level of the current cycle. This average value
278
is taken as the NO emissions amplitude of the current cycle. Last but not least, Figure 5 also
279
shows that the level of NO (C-D area) after a light knock cycle and after a super knock cycle
280
(C’ point) can significantly vary. The deeper understanding of this observation is within the
281
aim of this study. A similar procedure was followed to detect HC concentration at each
282
combustion cycle, taking into account the variations in signal delay, due to the different
283
positioning of the sampling probes for NO and HC species. More details on the exact process
284
per pollutant can be found in open literature [21], [23], [48], [49].
285
[image:13.595.83.507.372.659.2]286
Figure 5: Schematic illustration of the fast NO signal in reference to in-cylinder pressure for two consecutive
287
cycles with KI=0.76 bar and 15.1 bar respectively.
14
3
Results and Discussion
289
3.1 Effect of Spark Ignition Timing 290
The phenomenon of knock is controllable by the spark advance as advancing or retarding the
291
spark timing can increase or decrease the knock severity or intensity respectively [47].
292
Although knock varies substantially from cycle to cycle and doesn’t occur at each combustion
293
cycle, an average combustion cycle can present the ‘mean’ picture of knock intensity. Various
294
spark timings lead to different heat release rate histories, which can be linked to end-gas
295
pressure and temperature conditions that can cause autoignition. The latter can be observed as
296
a rapid increase in the pressure trace accompanied by fluctuations which amplitude varies with
297
time.
298
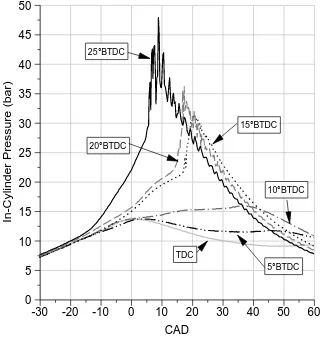
[image:14.595.136.457.305.644.2]299
Figure 6:In-cylinder pressure traces for six (6) different ignition timings. Advanced ignition leads to heavy
300
knock.
301
Figure 6 shows six (6) different combustion cycles where the range of knock intensity varies.
302
The illustrated pressure traces represent the average imep cycle of the measured 300 cycles at
303
each spark timing condition. It is observed that as ignition timing shifts from TDC to 25o
304
In
-C
y
lin
d
e
r
P
re
s
s
u
re
(
b
a
r)
0 5 10 15 20 25 30 35 40 45 50
CAD
-30 -20 -10 0 10 20 30 40 50 60
25°BTDC
20°BTDC
15°BTDC
10°BTDC
15
BTDC, the magnitude of peak combustion pressure and the amplitude of pressure fluctuations
305
are impressively increased. In fact, the peak in-cylinder pressure when ignition timing occurs
306
at TDC compared to the ignition timing occurs at 25o BTDC is more than three (3) times higher.
307
Furthermore, it is revealed that knock intensity increases exponentially as knock occurs closer
308
to top center, earlier in the combustion process.
309
[image:15.595.146.452.190.408.2]310
Figure 7: Impact of spark ignition timing on IMEP and KI under stoichiometric conditions and wide open
311
throttle conditions.
312
313
Figure 8: Impact of spark timing on NO and HC emissions, considering mean value.
314 K I (b a r) 0 2 4 6 8 10 12 Ignition [CAD]
0 5 10 15 20 25
KI IMEP IM E P ( b a r) 3.4 3.6 3.8 4.0 4.2 4.4 4.6 4.8 5.0 N O ( p p m ) 350 400 450 500 550 600 650 700 750 800 Ignition [CAD]
0 5 10 15 20 25
[image:15.595.145.453.478.699.2]16
Pressure traces substantially vary from cycle-to-cycle; therefore mean values of imep and KI
315
as well as the variability of these indexes can explain the transition from normal combustion to
316
heavy knock by advancing spark timing. Figure 7 schematically presents the relationship
317
between both KI and imep against spark timing. MBT is achieved at spark timing close to 10o
318
BTDC, where the mean value of imep is maximized and the COV of imep is minimized. Further
319
spark advance leads to higher imep variability, the mean value of imep drops and KI is
320
exponentially increased. At 15o BTDC spark timing, KI is equal to 2 bar and can be classified
321
into a medium knock case while further spark advance leads to heavy knock cycles.
322
[image:16.595.143.431.259.483.2]323
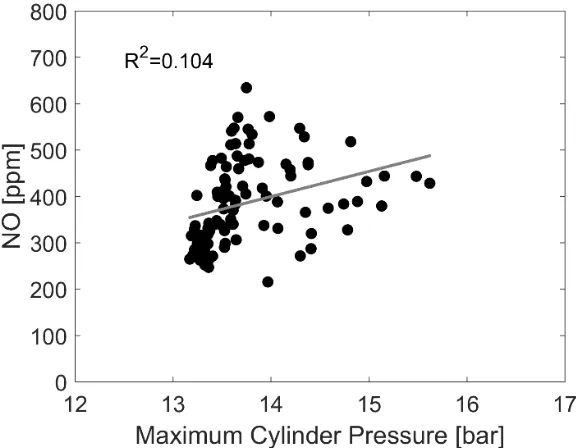
Figure 9:Relationship between maximum cylinder pressure and NO formed emissions under normal
324
combustion conditions (spark timing at 5o BTDC).
325
Cycle to cycle variability is recognized as the main reason of cyclic emission variability;
326
however the impact of knocking combustion on pollutants formation has not been previous
327
investigated extensively. The averaged and variation range of the emission values for 300
328
combustion cycles as well as the relationship between NO and HC emissions against spark
329
timing are illustrated in Figure 8. HC are increased against spark timing due to incomplete
330
combustion as KI is increased. However, under heavy knock conditions mean HC are slightly
331
decreased as pre-ignition appears and combustion characteristics change. Regarding NO, it was
332
found that engine-out NO are enhanced versus spark timing which is continued until heavy
333
knock conditions at spark timing 20o BTDC and then average formed NO is decreased.
334
Previous studies on cyclic NO variability presented that MBT is related with the maximum
335
mean NO value and the minimum COVNO value [43], while the effect of knocking combustion
17
in this relationship is not usually considered. The current tested experimental case clearly
337
presents that knock can further increase mean NO exhaust emissions by up to 36%, while
338
considering NO variability, instantaneously this increment can reach up to 60%. A further
339
analysis to better understand the deeper reason of this trend is needed and followed in this
340
study.
341
[image:17.595.151.425.195.406.2]342
Figure 10: Relationship between maximum cylinder pressure and NO formed emissions under heavy knock
343
conditions (spark timing at 25o BTDC).
344
345
In addition to NO emissions, Figure 8 presents the relationship between HC emissions and
346
spark timing. HC emissions mean value is increased as spark ignition timing is advanced apart
347
from the TDC ignition timing point, as this point seems to represent a very late combustion,
348
very slow heat release rate that declares incomplete combustion takes place. In general, HC
349
emissions present similar trend to NO emissions against spark timing. Under knocking
350
conditions (spark timing exceeds 10o BTDC), HC emissions are enhanced by up to 10% while
351
under heavy knock conditions a slight drop compared to the peak HC emissions is observed.
18 353
Figure 11: Relationship between maximum cylinder pressure and NO formation for various KI conditions
354
(contour lines) as a result of various ignition timing conditions under stoichiometric conditions.
355
Nitric oxide is mainly formed at high temperatures, through the well-known extended
356
Zeldovich thermal mechanism [26]. Peak combustion temperature and residence time at high
357
temperature conditions are the two primary reasons on nitrogen oxidation. Figure 9 represents
358
the relationship between maximum cylinder pressure and NO emissions for 100 consecutive
359
cycles under normal combustion conditions (ignition timing 5o BTDC). The trend of these
360
points is found close to linear, validating similar observations from previous studies [21], [43],
361
[50]. In fact, deviations from this linear correlation can be related with the cyclic dispersion of
362
mixture parameters such as residual gas fraction, fuel trapped mass or air-fuel ratio at each
363
combustion cycle. This linear trend clearly shows that as maximum cylinder pressure is
364
increased NO formation is enhanced. However a similar analysis of the data under heavy knock
365
conditions (ignition timing 25o BTDC) showed the opposite linear trend; higher maximum
366
cylinder pressure leads to lower NO emissions (Figure 10). Furthermore, the dispersion of the
367
points is at much higher range compared to the case of normal combustion conditions. The
368
latter is resulted from the stochastic behaviour of knocking combustion conversely to the more
369
robust normal combustion.
19 371
Figure 12: Comparison of various KI conditions.
372
NO variability is highly related to the combustion rate, as approved elsewhere [38]. Figure 11 373
illustrates the relationship between maximum cylinder pressure and NO emissions for various
374
spark timing conditions. It is observed that the area where points occur is restricted by a ‘left’
375
and ‘right’ limit that both form a triangular region. The third axis of this plot represents the
376
knock intensity which is illustrated as contour lines on the same figure. The ‘left’ limit of this
377
plot is well-matched with the KI equal to zero contour line. In fact, it describes the observed
20
trend found at Figure 9; higher maximum cylinder pressure leads to higher NO emissions under
379
normal SI combustion conditions and it is the limit of NO formation under deflagration
380
conditions. Moving to the right part of Figure 11, maximum cylinder pressure increases as
end-381
gas auto-ignition starts to occur. Under knocking combustion condition, it is observed that the
382
variation between maximum and minimum NO emissions at higher maximum cylinder
383
pressure is decreased and reaches a narrow window area at extreme peak in-cylinder pressures.
384
The latter forms the right region limit which is hard to explain from recorded thermodynamic
385
data. Therefore natural light photography data were employed to better understand this trend.
386
Set out in Figure 12 are flame images from three (3) different combustion cycles under various
387
knock intensity conditions; namely light knock, medium knock and heavy knock. It can be seen
388
that for KI=2, auto-ignition is observed at the late phase of the combustion process. Burned
389
zone occurs for long time, enough for the post-flame kinetics to form a substantial amount of
390
NO emissions. On the opposite site, at heavy knock cycles, auto-ignition occurs much earlier
391
and respectively burned zone also occurs less, NO residence time is decreased and although
392
peak temperature is higher final formed NO emissions are significantly lower to normal
393
combustion case. Summarizing, optical data present that higher knock intensity can be
394
correlated with higher in-cylinder pressure while pressure waves affect the residence time in
395
the post flame region.
396
The observation of Figure 12 explains the ‘right’ limit region on Figure 11. NO formation
397
depends on oxygen availability, peak temperature and the residence time of the mixture at high
398
temperature conditions. In stoichiometric mixtures and under knocking conditions there is a
399
competition between maximum cylinder temperature and residence time of combustion
400
products in the burned region. As KI is increased, knock occurs earlier during the combustion
401
process which means that residence time can potentially decrease although peak temperature
402
and pressure are significantly enhanced. The latter affects the kinetic rate of NO formation and
403
lead to lower emissions. In this study was found that combustion cycles with KI higher than 6
404
present a drop on NO emissions.
405
3.2 Effect of Air/Fuel Equivalence Ratio 406
Combustion evolution and knock onset are affected by mixture composition and oxygen
407
availability, while fluctuations of air/fuel ratio is an important source of CCV [51]. Pollutants
408
formation is also expected to be affected by the nature of the combustion and the oxygen
409
availability.
21
The effect of oxygen availability on knock onset and pressure evolution is illustrated on Figure 411
13 that shows the in-cylinder pressure traces for three different mixtures: slightly rich, slightly
412
lean and (almost) stoichiometric. The three (3) cycles correspond to identical ignition timing
413
(20o BTDC), engine load (imep~4.4 bar) but different knock intensity conditions. It is observed
414
that slightly rich mixture presents a faster burn rate and reaches end-gas auto-ignition limit
415
closer to TDC, as due to the smaller cylinder volume of the unburned region, the unburned
416
temperature and pressure are relatively high at this crank angle. On the other hand, slightly lean
417
mixture is characterized by a slower burn rate and compared to the stoichiometric combustion
418
cycle, the onset of knock at lean conditions appears with 5o CA delay.
419
[image:21.595.160.432.275.528.2]420
Figure 13: In-cylinder pressure traces for three (3) different air/fuel equivalence ratios and similar ignition
421
timings (TDC-20o) and imep. Equivalence ratio significantly affects knock onset and peak in-cylinder pressure.
422
The knock resistance of lean mixtures has been investigated in the past by Gruden and Hahn
423
[52]. In their study, a production engine was converted to a lean burn engine. Researchers
424
explored the effect of many parameters on engine economy including: high compression ratio,
425
optimization of ignition timing and layout of the combustion chamber shape with intensive
426
charge turbulence. They found that compression ratio can be increased with lean operation,
427
implying that lean mixtures are more knock resistant. However, the operating conditions under
428
which this trend is valid is not clearly stated. Considering the results of Figure 13, a possible
429
In
-C
y
lin
d
e
r
P
re
s
s
u
re
(
b
a
r)
5 10 15 20 25 30 35 40 45
CAD
-20 -10 0 10 20 30 40
22
reason could be the slower burn rate that leads to auto-ignition when piston expands and
430
consequently end gas temperature and pressure are relatively low.
431
In order to better understand the effect of air/fuel equivalence ratio on knock intensity and NO
432
emissions, the 20o BTDC ignition point was selected from stoichiometric data previously
433
presented and experiments were performed for various air/fuel equivalence ratios. Figure 14 434
shows that maximum KI is observed at close to stoichiometric conditions, while under slightly
435
lean conditions KI drops impressively. Conversely to previous studies where it was found that
436
lean mixtures increase the COV of imep and cyclic combustion variability is much higher,
437
knocking combustion lean mixtures reduce cyclic variability as KI drops. The effect of air/fuel
438
equivalence ratio on NO formation under knocking combustion is also explored. It was found
439
that maximum NO emissions are enhanced under lean conditions due to the excess of oxygen
440
and the peak temperature conditions that occur under slightly lean conditions. Compared to
441
normal combustion lean operating (λ~1.1) conditions, it was found that NO can be up to 3
442
times higher under autoignition conditions.
443
[image:22.595.144.454.388.597.2]444
Figure 14: Effect of air/fuel ratio (λ) on average knock intensity and NO emissions for similar ignition
445
timings (TDC-20) and engine load (imep~4.4 bar).
446
Cyclic combustion variability consists of both stochastic and deterministic phenomena [22].
447
Fluctuations of the gas mixture motion and turbulence and variation of the quantity and spatial
448
distribution of the fuel are related with the stochastic aspect of cyclic dispersion. Leaner and
449
more dilute mixture conditions are related to the deterministic aspect of cyclic variability [53]
450 K I (b a r) 0.0 1.0 2.0 3.0 4.0 5.0 6.0 7.0 8.0 Lambda
0.85 0.90 0.95 1.00 1.05 1.10 1.15
23
and can also affect the amplitude of knock intensity under knocking conditions. The latter is
451
further discussed in this study.
452
[image:23.595.150.432.131.341.2]453
Figure 15: KI return map for ignition timing TDC-20 and stoichiometric air/fuel ratio conditions.
454
The return map is identified as an easy and fast way to characterize the nature of the variability
455
of any index and it includes the plot of the current value against the previous or next cycle
456
value of the same index. A boomerang-shaped pattern declares the deterministic aspect of
457
variability while a noisy spot point shows the stochastic feature of the variability.
458
[image:23.595.149.438.486.685.2]459
Figure 16:KI return map for ignition timing TDC-20 and slightly rich air/fuel ratio conditions.
460
Figure 15 and Figure 16 show the KI return map for stoichiometric and rich operating
461
conditions respectively. It is observed that under stoichiometric conditions KI presents a
24
boomerang-shaped pattern (Figure 15), while the scatter of data under rich conditions has been
463
decreased in an almost noisy spot (Figure 16). This strong indication proves the deterministic
464
character of knock intensity can significantly be reduced under rich conditions. The reason can
465
be the well-known cooling effect of rich mixtures, that decreases the end-gas temperature and
466
pressure and finally the knock intensity is reduced. It has to be noted that the small impact of
467
mixture air/fuel equivalence ratio on average engine load (imep), which differs by 2% between
468
the stoichiometric and rich mixtures, slightly affects the residual gas fraction, which is a strong
469
deterministic combustion parameter.
470
[image:24.595.127.445.261.488.2]471
Figure 17: Relationship between maximum cylinder pressure and NO formation for various KI conditions
472
(contour lines) as a result of various ignition timing conditions under slightly lean conditions (λ~1.1).
473
474
Nitric oxide formation is related with peak combustion temperature, mixture residence time at
475
high temperature and oxygen availability [43]. A recent study proved that under normal
476
combustion conditions, as a result of cyclic emission variability, fast burn rate cycles present
477
peak formed NO emissions under slightly lean conditions while slow burn rate cycles present
478
peak NO emissions closer to equivalent air/fuel ratio at unity [21].
25 480
Figure 18:Relationship between maximum cylinder pressure and NO formation for various KI conditions
481
(contour lines) as a result of various ignition timing conditions under slightly rich conditions (λ~0.9).
482
Under knocking combustion conditions, where peak temperatures are observed, oxygen
483
availability seems to be the most important parameter for NO formation. Figure 17 illustrates
484
the relationship between maximum in-cylinder pressure and NO formation for slight lean
485
mixtures and various KI conditions, which are presented as contour lines in the plot. Similar to
486
stoichiometric conditions presented before, the scatter area of the data form a triangular. The
487
left limit matches with the KI=0 isoline; under normal combustion conditions NO is
488
proportional to maximum in-cylinder pressure. Compared to stoichiometric conditions, the rate
489
is much faster due to the excess of oxygen.
490
Although the ‘left’ limit at Figure 17 is similar to the trend found at Figure 11, the ‘right’ limit 491
line is significantly different to stoichiometric conditions. The only parameter that alters
492
between those figures is oxygen availability. The competitive relationship between peak
493
temperature and residence time that was found under stoichiometric conditions is not appeared
494
under slightly lean conditions. The excess oxygen enhances post flame NO kinetics which are
495
further benefit from higher peak temperatures in high knock intensity combustion cycles. The
496
general trend shows that under high KI values, NO emissions are clearly increased with the
497
scatter of the data being also decreased, which means that the average value of NO follows an
498
important increment.
26
On the opposite site, Figure 18 presents the relationship between maximum in-cylinder
500
pressure and NO formation for slight rich mixtures and various KI conditions. The trends are
501
identical to the previous discussed under stoichiometric conditions at Figure 11, presenting the
502
competition between residence time and peak temperature for various KI conditions.
503
4
Conclusions
504This study explores pollutants formation under knocking combustion conditions using an
505
optical single cylinder SI engine. A novel experimental setup has been utilized including fast
506
response analyzers for NO and HC emissions, natural light photography and in-cylinder
507
pressure recordings. The effect of two engine operating parameters where explored such as
508
spark ignition timing and air/fuel equivalence ratio.
509
The effect of ignition timing on pollutants formation under various knock index conditions has
510
been explored. It was found that as spark timing is advanced and knock intensity is increased,
511
both NO and HC emissions are enhanced. Up to knock intensity equal to 6 bar and under
512
stoichiometric conditions, it was found that instantaneous NO emissions are increased by up to
513
60% compared to the MBT operating conditions. A further increase of knock intensity at the
514
limits of pre-ignition region was found to significantly drop NO emissions. Simultaneously HC
515
emissions were found to increase at the region of light and medium knock where the peak of
516
HC emissions was observed, while at heavier knock region HC emissions drop.
517
The effect of air/fuel equivalence ratio on pollutants formation under knocking combustion has
518
been also investigated in this study. It was found that leaner mixtures present the onset of knock
519
later compared to richer mixtures due to the slower deflagration rate. When knock occurs, the
520
formed NO in lean mixtures are higher than in stoichiometric or rich mixtures due to the oxygen
521
availability. Last but not least, it was found that under lean conditions NO emissions are
522
enhanced as knock intensity is increased while under stoichiometric or slightly rich operating
523
conditions it was found that NO are decreased for knock intensity higher than 6 bar.
524
525
526
Acknowledgement
527The authors would like to thank the personnel of the Centre of Advanced Powertrain and Fuels
528
(CAPF) at Brunel University London for their support in the experimental part of this work.
27 530
531
532
References
533
[1] T. Johnson and A. Joshi, “Review of Vehicle Engine Efficiency and Emissions,” in
534
SAE Technical Paper, 2018-01-0329, 2018.
535
[2] G. C. Koltsakis, Z. Samaras, A. Karvountzis-Kontakiotis, T. Zacharopoulou, and O.
536
Haralampous, “Implications of Engine Start-Stop on After-Treatment Operation,” SAE 537
Int. J. Engines, vol. 4, no. 1, 2011.
538
[3] Z. Wang, H. Liu, and R. D. Reitz, “Knocking combustion in spark-ignition engines,”
539
Prog. Energy Combust. Sci., vol. 61, pp. 78–112, 2017.
540
[4] G. G. Zhu, C. F. Daniels, and J. Winkelman, “MBT Timing Detection and its
Closed-541
Loop Control Using In-Cylinder,” in SAE Technical Paper, 2003, no. 2003-01-3266.
542
[5] S. Diana, V. Giglio, B. Iorio, and G. Police, “A Strategy to Improve the Efficiency of
543
Stoichiometric Spark Ignition Engines,” in SAE Technical Paper, 1996.
544
[6] M. D. Gerty and J. B. Heywood, “An Investigation of Gasoline Engine Knock Limited
545
Performance and the Effects of Hydrogen Enhancement,” SAE Tech. Pap., no. 2006-1–
546
228, pp. 1–21, 2006.
547
[7] Z. Wang, Y. Qi, X. He, J. Wang, S. Shuai, and C. K. Law, “Analysis of pre-ignition to
548
super-knock: Hotspot-induced deflagration to detonation,” Fuel, vol. 144, pp. 222–
549
227, 2015.
550
[8] G. T. Kalghatgi and D. Bradley, “Pre-ignition and ‘super-knock’ in turbo-charged
551
spark-ignition engines,” Int. J. Engine Res., vol. 13, no. 4, pp. 399–414, Feb. 2012.
552
[9] X. Zhen et al., “The engine knock analysis – An overview,” Appl. Energy, vol. 92, pp.
553
628–636, 2012.
554
28
compression ratio and leaburn heavy-duty spark-ignition engine fuelled with
n-556
butane and liquefied methane gas blend,” Energy, 2018.
557
[11] J. H. Mack, V. H. Rapp, M. Broeckelmann, T. S. Lee, and R. W. Dibble,
558
“Investigation of biofuels from microorganism metabolism for use as anti-knock
559
additives,” Fuel, vol. 117, pp. 939–943, 2014.
560
[12] H. Vafamehr, A. Cairns, O. Sampson, and M. M. Koupaie, “The competing chemical
561
and physical effects of transient fuel enrichment on heavy knock in an optical spark
562
ignition engine,” Appl. Energy, vol. 179, pp. 687–697, 2016.
563
[13] S. Diana, V. Giglio, B. Iorio, and G. Police, “Evaluation of the Effect of EGR on
564
Engine Knock,” SAE Tech. Pap., no. 724, p. 982479, 1998.
565
[14] K. Kumano and S. Yamaoka, “Analysis of knocking suppression effect of cooled EGR
566
in turbo-charged gasoline engine,” SAE Tech. Pap., no. 2014-01-1217, 2014.
567
[15] D. Song et al., “Low Pressure Cooled EGR for Improved Fuel Economy on a 568
Turbocharged PFI Gasoline Engine,” SAE Tech. Pap. 2014-01-1240, 2014.
569
[16] T. Alger, T. Chauvet, and Z. Dimitrova, “Synergies between High EGR Operation and
570
GDI Systems,” SAE Int. J. Engines, vol. 1, no. 1, pp. 2008-01–0134, 2008.
571
[17] A. Cairns, H. Blaxill, and G. Irlam, “Exhaust Gas Recirculation for Improved Part and
572
Full Load Fuel Economy in a Turbocharged Gasoline Engine,” SAE Tech. Pap., no.
573
724, 2006.
574
[18] H. Vafamehr, A. Cairns, and M. Moslemin Koupaie, “The Competing Chemical and
575
Physical Effects of Transient Fuel Enrichment during Heavy Knock in an Optical SI
576
Engine Using Ethanol Blends,” SAE Tech. Pap., vol. 2017–March, no. March, 2017.
577
[19] B. Grandin and H.-E. Ångström, “Replacing Fuel Enrichment in a Turbo Charged SI
578
Engine: Lean Burn or Cooled EGR,” SAE Tech. Pap., vol. 1999-01-35, no. 724, 1999.
579
[20] B. Grandin, I. Denbratt, J. Bood, and C. Brackmann, “Heat Release in the End-Gas
580
Prior to Knock in Lean, Rich and Stoichiometric Mixtures With and Without EGR,”
581
SAE Tech. Pap., vol. 2002-1–2, 2002.
29
[21] A. Karvountzis-Kontakiotis, L. Ntziachristos, Z. Samaras, A. Dimaratos, and M.
583
Peckham, “Experimental Investigation of Cyclic Variability on Combustion and
584
Emissions of a High-Speed SI Engine,” SAE Tech. Pap., vol. 2015–April, no. April,
585
2015.
586
[22] A. Karvountzis-Kontakiotis, A. Dimaratos, L. Ntziachristos, and Z. Samaras,
587
“Exploring the stochastic and deterministic aspects of cyclic emission variability on a
588
high speed spark-ignition engine,” Energy, vol. 118, 2017.
589
[23] J. K. Ball, M. J. Bowe, R. Stong, and N. Collings, “Validation of a Cyclic NO
590
Formation Model with Fast NO Measurements,” in SAE Technical Paper, 2001, vol.
591
2001-01-10.
592
[24] N. P. Komninos and D. T. Hountalas, “Improvement and validation of a multi-zone
593
model for HCCI engine combustion concerning performance and emissions,” Energy 594
Convers. Manag., vol. 49, no. 10, pp. 2530–2537, 2008.
595
[25] A. Karvountzis-Kontakiotis, “Impact of the Cycle-to-Cycle Variation of an Internal
596
Combustion Engine to Gaseous Pollutants Emissions,” PhD Thesis, Aristotle
597
University of Thessaloniki, 2015.
598
[26] G. A. Lavoie, J. B. Heywood, and J. C. Keck, “Experimental and Theoretical Study of
599
Nitric Oxide Formation in Internal Combustion Engines,” Combust. Sci. Technol., vol.
600
1, no. 4, pp. 313–326, Feb. 1970.
601
[27] C. T. Bowman, “Kinetics of pollutant formation and destruction in combustion,” Prog. 602
Energy Combust. Sci., vol. 1, no. 1, pp. 33–45, 1975.
603
[28] C. P. Fenimore, “Formation of nitric oxide in premixed hydrocarbon flames,” Symp. 604
Combust., vol. 13, no. 1, pp. 373–380, 1971.
605
[29] J. A. Miller and C. T. Bowman, “Mechanism and modeling of nitrogen chemistry in
606
combustion,” Prog. Energy Combust. Sci., vol. 15, no. 4, pp. 287–338, 1989.
607
[30] F. BACHMAIER, K. H. EBERIUS, and T. H. JUST, “The Formation of Nitric Oxide
608
and the Detection of HCN in Premixed Hydrocarbon-Air Flames at 1 Atmosphere,”
609
Combust. Sci. Technol., vol. 7, no. 2, pp. 77–84, Apr. 1973.
30
[31] J. W. Bozzelli and A. M. Dean, “O + NNH: A possible new route for NOX formation
611
in flames,” Int. J. Chem. Kinet., vol. 27, no. 11, pp. 1097–1109, 1995.
612
[32] S. Javoy, R. Mevel, and C. E. Paillard, “A study of N2O decomposition rate constant
613
at high temperature: Application to the reduction of nitrous oxide by hydrogen,” Int. J. 614
Chem. Kinet., vol. 41, no. 5, pp. 357–375, 2009.
615
[33] G. D’Errico, G. Ferrari, A. Onorati, and T. Cerri, “Modeling the Pollutant Emissions
616
from a S.I. Engine,” SAE Tech. Pap., vol. 2002-01–00, 2002.
617
[34] G. Merker, C. Schwarz, G. Stiesch, and F. Otto, Simulation of combustion and 618
pollutant formation for engine-development. Springer-Verlag Berlin Heidelberg, 2006.
619
[35] M. Rublewski and J. Heywood, “Modeling NO Formation in Spark Ignition Engines
620
with a Layered Adiabatic Core and Combustion Inefficiency Routine,” SAE Tech. 621
Pap., vol. 2001-01-10, 2001.
622
[36] A. T. Karvountzis-Kontakiotis and L. Ntziachristos, “A detailed chemical mechanism
623
to predict NO Cycle-to-cycle Variation in homogeneous engine combustion,” in IFAC 624
Proceedings Volumes (IFAC-PapersOnline), 2012.
625
[37] A. Karvountzis-Kontakiotis and L. Ntziachristos, “Investigation of cycle-to-cycle
626
variability of NO in homogeneous combustion,” Oil Gas Sci. Technol., vol. 70, no. 1,
627
2015.
628
[38] A. Karvountzis-Kontakiotis and L. Ntziachristos, “Improvement of NO and CO
629
predictions for a homogeneous combustion SI engine using a novel emissions model,”
630
Appl. Energy, vol. 162, 2016.
631
[39] W. E. Holly, T. Lauer, H. A. Schuemie, and S. Murakami, “Prediction of the knocking
632
combustion and NOx formation for fuel gases with different methane numbers,” Int. J. 633
Engine Res., vol. 17, no. 1, pp. 35–43, Dec. 2015.
634
[40] S. Richard, S. Bougrine, G. Font, F.-A. Lafossas, and F. Le Berr, “On the Reduction of
635
a 3D CFD Combustion Model to Build a Physical 0D Model for Simulating Heat
636
Release, Knock and Pollutants in SI Engines,” Oil Gas Sci. Technol. - Rev. IFP, vol.
637
64, no. 3, pp. 223–242, 2009.
31
[41] C. D. Rakopoulos and C. N. Michos, “Development and validation of a multi-zone
639
combustion model for performance and nitric oxide formation in syngas fueled spark
640
ignition engine,” Energy Convers. Manag., vol. 49, no. 10, pp. 2924–2938, 2008.
641
[42] Y. Zhuang, Y. Qian, and G. Hong, “The effect of ethanol direct injection on knock
642
mitigation in a gasoline port injection engine,” Fuel, vol. 210, pp. 187–197, 2017.
643
[43] A. Karvountzis-Kontakiotis, A. Dimaratos, L. Ntziachristos, and Z. Samaras,
644
“Exploring the stochastic and deterministic aspects of cyclic emission variability on a
645
high speed spark-ignition engine,” Energy, vol. 118, pp. 68–76, 2017.
646
[44] H. Zhao, Laser Diagnostics and Optical Measurement Techniques in Internal 647
Combustion Engines. SAE International, 2012.
648
[45] S. Dingle, A. Cairns, H. Zhao, and J. Williams, “Lubricant Induced Pre-Ignition in an
649
Optical SI Engine,” SAE Tech. Pap., vol. 2014-01-12, 2014.
650
[46] T. Goto, R. Isobe, M. Yamakawa, and M. Nishida, “The New Mazda Gasoline Engine
651
Skyactiv-G,” ATZ Auto-Technol, vol. 11:40–7, 2011.
652
[47] J. Heywood, Internal Combustion Engine Fundamentals. New York: McGraw-Hill,
653
1988.
654
[48] M. Peckham, A. Finch, and B. Campbell, “Analysis of Transient HC, CO, NOx and
655
CO2 Emissions from a GDI Engine using Fast Response Gas Analyzers,” SAE Int. J. 656
Engines, vol. 4, no. 1, 2011.
657
[49] K. S. J. Reavell, N. Collings, M. Peckham, and T. Hands, “Simultaneous Fast
658
Response NO and HC Measurements from a Spark Ignition Engine,” SAE Tech. Pap.,
659
vol. 971610, no. 412, 1997.
660
[50] J. K. Ball, R. R. Raine, and C. R. Stone, “Combustion analysis and cycle-by-cycle
661
variations in spark ignition engine combustion Part 2: a new parameter for
662
completeness of combustion and its use in modelling cycle-by-cycle variations in
663
combustion,” Proc. Inst. Mech. Eng. Part D J. Automob. Eng., vol. 212, no. 6, pp.
664
507–523, 2005.
665
[51] G. Grünefeld, V. Beushausen, P. Andresen, and W. Hentschel, “A Major Origin of
32
Cyclic Energy Conversion Variations in SI Engines: Cycle-by-Cycle Variations of the
667
Equivalence Ratio and Residual Gas of the Initial Charge,” SAE Tech. Pap., vol.
668
941880, 1994.
669
[52] D. Gruden and R. Hahn, “Performance, exhaust emissions and fuel consumption of an
670
IC engine operating with lean mixtures,” in IMechE Conference on Fuel Economy and 671
Emissions of Lean Burn Engines, C111/79, 1979, pp. 177–184.
672
[53] C. E. A. Finney, B. C. Kaul, C. S. Daw, R. M. Wagner, K. D. Edwards, and J. B.
673
Green, “Invited Review: A review of deterministic effects in cyclic variability of
674
internal combustion engines,” Int. J. Engine Res., vol. 16, no. 3, pp. 366–378, Feb.
675
2015.
676