DOI:10.1051/0004-6361/201628623 c
ESO 2016
Astronomy
&
Astrophysics
Brown dwarf disks with ALMA:
Evidence for truncated dust disks in Ophiuchus
L. Testi
1,2,3,4, A. Natta
5,3, A. Scholz
6, M. Tazzari
1,2, L. Ricci
7, and I. de Gregorio Monsalvo
1,81 ESO/European Southern Observatory, Karl-Schwarzschild-Strasse 2, 85748 Garching bei München, Germany e-mail:ltesti@eso.org
2 Excellence Cluster “Universe”, Boltzmann str. 2, 85748 Garching bei Muenchen, Germany 3 INAF/Osservatorio Astrofisico of Arcetri, Largo E. Fermi, 5, 50125 Firenze, Italy
4 Gothenburg Center for Advance Studies in Science and Technology, Department of Mathematical Sciences, Chalmers University of Technology and University of Gothenburg, 412 96 Gothenburg, Sweden
5 School of Cosmic Physics, Dublin Institute for Advanced Studies, 31 Fitzwilliams Place, Dublin 2, Ireland
6 SUPA, School of Physics and Astronomy, University of St. Andrews, North Haugh, St. Andrews, Fife KY16 9SS, UK 7 Harvard-Smithsonian Center for Astrophysics, 60 Garden Street, Cambridge, MA 02138, USA
8 Joint ALMA Observatory (JAO), Alonso de Cordova, 3107 Vitacura -Santiago de Chile, Chile
Received 1 April 2016/Accepted 6 June 2016
ABSTRACT
Context.The study of the properties of disks around young brown dwarfs can provide important clues on the formation of these very low-mass objects and on the possibility of forming planetary systems around them. The presence of warm dusty disks around brown dwarfs is well known, based on near- and mid-infrared studies.
Aims.High angular resolution observations of the cold outer disk are limited; we used ALMA to attempt a first survey of young brown dwarfs in theρOph star-forming region.
Methods. All 17 young brown dwarfs in our sample were observed at 890µm in the continuum at∼000.5 angular resolution. The
sensitivity of our observations was chosen to detect∼0.5M⊕of dust.
Results.We detect continuum emission in 11 disks (∼65% of the total), and the estimated mass of dust in the detected disks ranges from∼0.5 to∼6M⊕. These disk masses imply that planet formation around brown dwarfs may be relatively rare and that the
supra-Jupiter mass companions found around some brown dwarfs are probably the result of a binary system formation. We find evidence that the two brightest disks inρOph have sharp outer edges atR.25 AU, in contrast to disks around Taurus brown dwarfs. This difference may suggest that the different environment inρOph may lead to significant differences in disk properties. A comparison of theMdisk/M∗ratio for brown dwarf and solar-mass systems also shows a possible deficit of mass in brown dwarfs, which could
support the evidence for dynamical truncation of disks in the substellar regime. These findings are still tentative and need to be put on firmer grounds by studying the gaseous disks around brown dwarfs and by performing a more systematic and unbiased survey of the disk population around the more massive stars.
Key words. protoplanetary disks – brown dwarfs – stars: formation – submillimeter: planetary systems
1. Introduction
After decades since the discovery of the first young brown dwarf (BDs; Rebolo et al. 1995)and their disks(Comeron et al. 1998; Natta & Testi 2001; Natta et al. 2002), the formation mecha-nism of very low-mass objects (below ∼0.1 M) is still con-troversial. Possibilites range from the collapse of a single low-mass core (Hennebelle & Chabrier 2009), as for the more massive T Tauri stars (TTS), to ejection of low-mass protostel-lar seeds from multiple stelprotostel-lar systems before accretion termi-nates(Reipurth & Clarke 2001; Bate 2004, 2009)or from frag-menting circumstellar disks(Stamatellos & Whitworth 2009). A solar-mass core in the vicinity of an OB star may be photo-eroded to become a very low-mass object by the time of collapse (Hester et al. 1996; Whitworth & Zinnecker 2004). A variety of formation channels may in fact co-exist and their relative impor-tance may change as a function of mass and the environment. All the formation models account for the presence of circumstellar accretion disks around young BDs, but the current generation of numerical models is still unable to reliably predict how much
mass is retained in the small disks around BDs when they are ejected. A solid expectation is that the ratio of the disk mass over the mass of the central object should drop significantly if the ejection process becomes an important formation channel (Stamatellos & Herczeg 2015). A reliable observational estimate of the (possible) variation of this ratio with the mass of the cen-tral object would be a critical test that models would have to compare against.
Table 1.Sample.
Name α δ ST Teff AV L∗ M∗ Ref. Other Names
(2000) (2000) [K] [mag] [L] [M]
SONYC-RhoOph-8 16:26:18.58 −24.29.51.8 M7 2900 18.8 0.1 0.1 2 CFHTWIR-Oph16 ISO-Oph023 16:26:18.81 −24.26.10.8 M7 2900 9.7 0.04 0.07 1 CRBR 2317.3-1925 ISO-Oph030 16:26:21.53 −24.26.01.4 M7 2900 4.5 0.07 0.1 1 GY92-5
ISO-Oph032 16:26:21.90 −24.44.40.09 M6.5 2935 0.6 0.03 0.07 1 GY92-3 ISO-Oph033 16:26:22.26 −24.24.07.55 M8 2700 7.7 0.005 0.03 1 GY92-11
ISO-Oph035 16:26:22.96 −24:28:46.1 M6 3000 10.7 0.06 0.1 2 GY15, SONYC-RhoOph-5 CRBR 2322.3-1143 16:26:23.81 −24:18:29.0 M6.5 2935 8.6 0.01 0.07 2
ISO-Oph042 16:26:27.80 −24.26.42.22 M5 3100 6.2 0.03 0.1 3 GY92-37 GY92-202 16:27:05.98 −24:28:36.3 M7 2900 13.0 0.02 0.06 2
ISO-Oph102 16:27:06.58 −24.41.49.28 M5 3125 2.2 0.047 0.15 1 GY92-204
ISO-Oph138 16:27:26.22 −24.19.23.46 M7.75 2753 16.4 0.1 0.05 2 SONYC-RhoOph-10, CFHTWIR-Oph78 GY92-264 16:27:26.57 −24.25.54.77 M8 2700 2.2 0.023 0.03 4
ISO-Oph160 16:27:37.42 −24.17.55.34 M7.5 2800 6.1 0.03 0.06 1
ISO-Oph164 16:27:38.63 −24:38:39.19 M8 2700 5.1 0.05 0.05 1 GY310, ROXN62 GY92-320 16:27:40.84 −24:29:00.8 M7.75 2753 2.4 0.007 0.04 2 CFHTWIR-Oph 96 ISO-Oph176 16:27:46.29 −24:31:41.2 M7.5 2800 6.9 0.06 0.06 1 GY92-350
ISO-Oph193 16:28:12.7 −24.11.36.08 M6 3000 7.4 0.07 0.11 1 B162812-241138
References.References to stellar parameters: 1: Manara et al. (2015); 2: data from Alves de Oliveira et al. (2012) and references therein (see text); 3: data from Muzic et al. (2012) (see text); 4: Liu et al. (2015).
models of grain growth(Pinilla et al. 2013) in low-mass disks encounter very serious difficulties; this challenges current views of how and when grain growth may occur. Payne & Lodato (2007)estimate that the disks around BDs need to be relatively massive, at least a few Jupiter masses, to enable efficient terres-trial planet formation.
Measuring the mass distribution of disks around a signifi-cant sample of young BDs is thus essential to shed light on the BD formation mechanisms and to assess their potential to form planetary systems. In this paper we present the first ALMA ob-servations of an unbiased sample of very low-mass objects in the very young star-forming regionρOph.
2. The sample
The sample includes 17 spectrally confirmed ρ Oph BDs with infrared excess, which indicates the presence of a cir-cumstellar disk. The sample includes about half of all the substellar objects with infrared excess confirmed to date in
ρ Oph (Natta et al. 2002; Testi et al. 2002; Geers et al. 2011; Alves de Oliveira et al. 2012; Muži´c et al. 2012) At the time of the proposal (July 2012, Cycle 1), they were all the spectroscop-ically confirmed Class II BDs inρOph. No selection based on
Herschelfluxes or pre-existing (sub)mm observations was
ap-plied. It should be noted that an object inρOph is considered a BD if it has spectral type of M6 or later. Nonetheless, given the difficulties in estimating spectral types in highly extincted ob-jects, some objects may or may not be included in the published BD samples, depending on the adopted spectral type determina-tion. Recently, the stellar parameters of a subset (eight objects) of our sample have been re-determined using X-Shooter spectra byManara et al. (2015), who also provide a detailed discussion of the uncertainties. In two cases, the spectral type has been re-vised to M5, which is just above the BDs threshold. We kept the objects in our analysis, even if strictly speaking they do not meet our original selection criterion.
In spite of the continuing effort to identify and classify new objects, it is important to stress that we are always dealing with
extinction-limited samples, and not with samples complete down to a given mass sensitivity. Moreover, as mentioned above, the determination of photospheric parameters ofρOph objects (for any mass) is very uncertain because of the large extinction, young ages, and uncertainties in the evolutionary tracks (see Manara et al. 2015).
Table1summarizes the adopted values of the stellar parame-ters for our sample objects. For those not inManara et al. (2015), we estimated the luminosity from the spectral type, extinction, andJmagnitude provided byAlves de Oliveira et al. (2012)and Muži´c et al. (2012), the effective temperature using the spectral type-temperature scale of Luhman et al. (2003), and the mass by comparison withBaraffe et al. (2008)tracks. The objects range in luminosity between ∼0.01 and 0.1 L and between ∼0.03 and 0.1Min mass.
3. Observations and results
ALMA observed our sources on April 25 and 26, 2014 with 35 and 36 antennas, respectively. We used the ALMA Band 7 receivers tuned to a frequency of ∼338 GHz, the total ef-fective bandwidth usable for continuum was approximately 6 GHz and the 13CO(3−2) line was covered in one of the spectral windows of the correlator. Titan was used as flux calibrator, while J1626−2951 and J1625−2527 were used as complex gain calibrators in both sessions. The passband cali-brator was J1733−1304 for the first session and J1517−2422 for the second session. Standard calibration was performed by the ESO ALMA Regional Centre, the flux density scale is expected to be accurate within 5%. The total time on source for our targets was three minutes for the majority of the sources; the on-source time was six minutes for six ob-jects: SONYC-RhoOph-8, ISO-Oph032, ISO-Oph138, GY92-264, ISO-Oph164, and GY92-320.
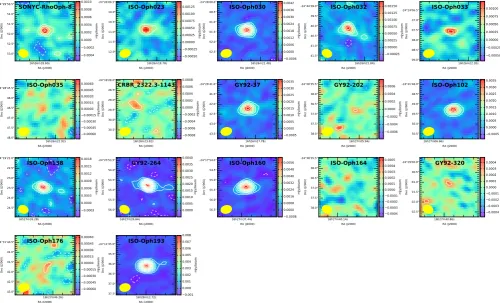
Fig. 1.ALMA Band 7 images of all the observed sources, as labelled in each panel; each panel is 300×
300
in size. The synthesized beam full width at half maximum is shown in the lower left corner of each panel; the typical size is 000.000.4. In each panel, contour levels are plot at−3σ(dashed),
and every 3σfrom 3σto the maximum.
maximum of the synthesized beam is approximately 000.5×000.4 for all maps.13CO(3−2) emission was not detected in any of the sources.
The total fluxes reported in Col. 3 of Table2 for the de-tected sources are computed using the CASA taskuvmodelfit: we fitted Gaussian sources to the visibilities of all de-tected sources except for the three fainter ones, for which we used a point source. The flux upper limits for the non-detected sources correspond to 98% confidence levels and are computed as three times the rms level above the measured flux (assumed null when negative) at the nominal position of the object (see Barenfeld et al. 2016). For three objects the Gaussian fits im-ply a deconvolved source size with a major axis greater or equal than∼0.2 arcsec (see Col. 4 of Table2).
4. Disk properties
4.1. Disk masses
We determine the mass of dust in the disk from the 890µm flux using the approximation that the emission is optically thin and isothermal at temperatureT,
Fν= 1
D2 κνBν(T)Mdust, (1)
where D is the distance and κν the opacity at the frequency of the observation. This expression has been extensively used in the literature and provides reliable estimates of the product
Mdust ×κν from sub-mm and mm fluxes if the emission is
op-tically thin. This is indeed the case for all the BDs studied in
detail so far (seeRicci et al. 2012,2013,2014and Sect. 4.2). In the following, we adopt a dust opacityκ890µm=2 cm2/g, as in
Ricci et al. (2014), and a temperature that depends on the stel-lar luminosity asT = 25 (L∗/L)0.25 K (TAin the following),
as suggested byAndrews et al. (2013)in their study of more lu-minous objects (L∗∼ 0.1−100 L). Recently, the choice of the temperature appropriate to recover the dust mass from a single-wavelength (sub)mm flux in lower-luminosity objects was dis-cussed byvan der Plas et al.(2016) andDaemgen et al.(2016). Our motivations for choosingTAand the uncertainties onMdust
due to the uncertainty onT in Eq. (1) (less than a factor 2 in all our objects) are summarized in AppendixA.
Of the 17ρOph BDs observed with ALMA, 11 have a mea-sured dust mass of 0.5–6M⊕and 6 have upper limits of<∼1M⊕. Assuming a gas-to-dust mass ratio of 100, the total disk mass (gas+dust) is Mdisk ∼ 1.5−9×10⁻⁴ M. We do not find more massive disks in our sample and the ratio of the disk-to-star mass is above∼1% only in 4 objects. Our results are more accurate, but they are in broad agreement with the disk masses derived by Alves de Oliveira et al. (2013)from an HerschelPACS survey of BDs inρOph. For 12 objects, they were able to determine the disk properties by fitting the observed SEDs with parametric disk models. The mass range they derive is of 0.1−30M⊕. In par-ticular, when the choice of the mm opacity, which is usually not constrained by theHerscheldata, is taken into account, masses for 5 of the 6 objects in common agree within a factor of about
Table 2.Alma data and disk mass.
Name Fpeak Ftot Sizea Mdustb Mdiskc
[mJy/beam] [mJy] [arcsec] [M⊕] [10−3 M] SONYC-RhoOph-8 1.00±0.08 1.0 <0.2 0.5 0.15
ISO-Oph023 1.30±0.16 1.5 <0.2 1.1 0.33
ISO-Oph030 4.20±0.15 4.8 <0.2 2.7 0.80
ISO-Oph032 1.62±0.1 1.80 <0.2 1.4 0.42
ISO-Oph033 1.2±0.18 1.3: <0.2 2.6 0.77
ISO-Oph035 – <0.9 – <0.5 <0.15
CRBR 2322.3-1143 – <0.6 – <0.9 <0.27
ISO-Oph042 3.61±0.19 4.2 ∼0.25 3.5 1.0
GY92-202 – <0.5 – <0.5 <0.15
ISO-Oph102 3.66±0.19 3.8 <0.2 2.5 0.75
ISO-Oph138 1.96±0.085 2.0 <0.2 1.0 0.30
GY92-264 3.96±0.09 4.1 <0.2 4.4 1.3
ISO-Oph160 6.13±0.20 7.60 ∼0.3 6.3 1.9
ISO-Oph164 – <0.8 – <0.5 <0.15
GY92-320 – <0.4 – <0.7 <0.21
ISO-Oph176 – <0.5 – <0.3 <0.09
ISO-Oph193 7.82±0.20 8.7 ∼0.2 4.8 1.43
Notes.(a)Deconvolved major axis; unresolved objects have size<0.2 arcsec.(b)Dust mass from theF
890µm,κ890µm=2 cm2/g; see text for details. (c)Total (gas+dust) disk mass computed fromM
dustassuming a gas=to-dust mass ratio of 100.
4.2. Disk sizes and surface density profile
Table 2 gives in Col. 4 the deconvolved major axis computed assuming a Gaussian source. Of the 11 detected objects, 8 are not resolved with deconvolved radii.24 AU for the adopted distance
D=122 pc. Three objects, Oph042, Oph160, and ISO-Oph193, are marginally resolved.
ISO-Oph160 and ISO-Oph193 are detected with a high signal-to-noise ratio (≥30), hence we attempted a more careful analysis of the disk structure. Following Tazzari et al. (2016), we performed a fit to the visibilities using a simple two-layer disk model with two different prescriptions for the distribution of the surface density: a power law distribution with a sharp outer radius or an exponential taper, in the following we refer to these two models as truncated power law and exponentially tapered.
In the truncated power law case,Σ(R) follows a power law of exponentpout to a radiusRoutas follows:
Σ(R)= Σ0
R R0
!−p
· (2)
For the exponentially tapered, we adopted the parametrization of Guilloteau et al. (2011), i.e.
Σ(R)= Σ0
R R0
!−γ exp
− R
Rc
!2−γ
, (3)
which is a solution of the self-similar evolution of viscous accre-tion disks (where viscosity increases asRγ), and is equivalent to other commonly used parametrizations(e.g. Isella et al. 2009). The functional form ofΣ(R) is defined by three parameters:R0
andpor, equivalently,Rcandγ, andΣ0= Σ(R0=10 AU), which
is the normalization factor that scales with the disk mass. In all cases we adopt an inner radius of 0.1 AU, as the results do not depend on its exact value.
OnceΣ and the stellar parameters are fixed, the disk tem-perature and the surface brightness at 890µm are computed us-ing the two-layer radiation transfer model(Chiang & Goldreich 1997; Dullemond et al. 2001; Chiang et al. 2001)with flare re-duced by a factor 3 to match the typical values of the far-infrared excess observed in BDs(Daemgen et al. 2016). The dust opac-ity is calculated using Mie theory assuming the same dust com-position throughout the disk, given by the following fractional abundances adapted fromPollack et al. (1994): 5.4% astronomi-cal silicates, 20.6% carbonaceaous material, 44% water ice, and 30% vacuum(see Trotta et al. 2013, for details). Furthermore, we assume a power law grain size distributionn(a) ∝ a−q for
amin ≤a≤amax, whereais the grain size. In order to model the
fact that we expect larger grains in the disk midplane than on the surface(see Testi et al. 2014), we use different prescriptions for the grains in the disk surface (amin =10 nm,amax =1µm, and
q =3.5) and for the midplane (amin =10 nm,amax = 1.4 cm,
andq = 3). The midplane dust opacity isκ890 = 2 cm2/g. The
dust-to-gas mass ratio is fixed to 10−2.
The method uses a Bayesian approach and implements an affine-invariant Markov Chain Monte Carlo (MCMC) ensemble sampler(see Tazzari et al. 2016, for a full description). For each model we compute the 890µm synthetic image and we sample its Fourier transform at the (u, v) plane location of the observa-tions. We estimate the Bayesian probability using exp(−χ2) as
likelihood with flat priors. In this scheme there are five free pa-rameters, namely the disk mass Mdisk, the two parameters that
defineΣ(Rc,γfor the exponentially tapered profile,Rout,pfor
the truncated power law), the inclination, and position angle of the disk on the sky. Two additional nuisance parameters are used for the disk centre position on the sky.
In Figs.2−4and in Table3, we show the results of the fits for our two disks. The probability distributions shown in Fig.2 il-lustrate the range of the parameters {Rc,γ} and {Rout,p} derived
-2 -1 0 1 2
γ
0 100 200 300
Rc
ISO-Oph160
-2 -1 0 1 2 3 4
p
0 100 200 300
Rou
t
ISO-Oph160
-2 -1 0 1 2
γ
0 100 200 300
Rc
ISO-Oph193
-2 -1 0 1 2 3 4
p
0 100 200 300
Rou
t
[image:5.595.41.286.79.320.2]ISO-Oph193
Fig. 2.Two-dimensional distributions of the model parameters {Rc,γ} (left column) and {Rout,p} (right column) for the fits of the disks in ISO-Oph160 (top row) and ISO-Oph193 (bottom row). The different shaded areas correspond to the 1, 2, and 3σconfidence levels (from light to dark blue). The yellow star indicates the values of the parameters for the best-fit models shown in Figs.3and4.
Table 3. Results of the model fits for the parameter sets {Rc,γ} and {Rout,p}; see Sect.4.2and AppendixBfor details.
Name Rc γ Rout p
[AU] [AU]
ISO-Oph160 24+2
−3 −1.4+ 0.9
−0.2 22.0+ 12
−0.4 −1.0+ 1.1
−0.4
ISO-Oph193 23+−113 −0.34+−00..78 22+−162 −0.64+−10..502
2M0444+2512 49+48
−11 1.4+ 0.5
−0.1 153+ 100
−40 2.0+ 0.3
−0.2
CIDA 1 82+8
−15 0.9+ 0.1
−0.1 136+ 17
−45 1.35+ 0.09
−0.13
CFHT Tau4 >90 1.0+−00..32 >90 1.0+−00..61
Notes.The 1σconfidence range for each parameter is also shown.
two models, one for the truncated power lawΣ(R) and one for the exponentially tapered, which are selected as those with the lowestχ2. The parameters of these models are indicated with a yellow star in Fig.2; the minimum normalized χ2 range is
be-tween 1.00 and 1.38. In Fig. 4 we show the observed ALMA images for the two sources (same as Fig.1), the model images and the residual images computed from the simulated visibilities for the models indicated with a yellow star in Fig.2and plotted in Fig.3. In Table3we report the numerical values and uncer-tainties of (Rc,γ) and (Rout,p) for the sources analysed in this
paper.
The modelling results suggest that the disks are compact (R . 25 AU), which is also consistent with the small decon-volved sizes (Table2). The values ofγandpare≤0 and≤−0.5, respectively. This implies that the derived profiles ofΣfor ISO-Oph160 and ISO-Oph193 are consistent with a rather flat inner
0
2
4
6
8
10
Re(V) (Jy)
ISO-Oph160
0
100 200 300 400 500 600
uv-distance (k
λ
)
-3.0
0.0
3.0
Im(V) (Jy)
0
2
4
6
8
10
Re(V) (Jy)
ISO-Oph193
0
100 200 300 400 500 600
uv-distance (k
λ
)
-3.0
0.0
3.0
[image:5.595.332.524.82.468.2]Im(V) (Jy)
Fig. 3.Real (top subpanel) and imaginary (bottom subpanel) visibilities as a function of baseline length for ISO-Oph160 (top figure) and ISO-Oph193 (bottom figure). The ALMA points were binned to increase the signal-to-noise ratio. The curves show the best-fitting models: the truncated power lawΣmodel as a solid blue line and the exponentially tapered model as a red dashed line.
region forR<∼20−25 and a very steep cutoff. They also con-firm that the (sub)mm emission is optically thin at all radii. All other disks in our sample are too faint to run this analysis and their small apparent sizes (Table2) may either be the result of small and sharply truncated disks, as for Oph160 and ISO-Oph193, or compatible with a decline ofΣand a larger outer ra-dius, as our limited surface brightness sensitivity does not allow us to distinguish between these two cases(see e.g. the discussion in Natta & Testi 2008).
[image:5.595.38.290.433.572.2]Fig. 4.Comparison between observations and best-fit models for ISO-Oph160 (left column) and ISO-Oph193 (right column). From top to bot-tom: observed, model and residual images for the best fit with Σ(R) parametrized as a truncated power law; model and residual images for the best fit with the exponentially taperedΣ(R). The size of each panel is 300
as in Fig.1.
5. Discussion
5.1. BD disk masses and potential for planet formation
[image:6.595.306.556.77.255.2]Figure5compares the values for disk masses of BDs that we ob-tained inρOph with disk masses of BDs in the literature derived from (sub)mm fluxes: Upper Sco (van der Plas et al. 2016)and in Taurus (see figure caption for references). For consistency, we recomputed all disk masses using Eq. (1) with the appro-priateTAfor each object andκ890µm =2 cm2/g. The values of
Fig. 5. Disk masses as function of the central object mass M∗. Red
dots and arrows are for theρOph sample discussed in this paper. The black squares report the disk masses for BDs in Taurus from theF890µm detections: open, single-dish measurements fromAndrews & Williams (2005); Broekhoven-Fiene et al. (2014); Mohanty et al. (2013); filled, from ALMA measurements byRicci et al. (2014). Blue triangles show the values for the 7 BDs in Upper Sco observed with ALMA by
van der Plas et al. (2016). For all objects, disk masses have been com-puted as inρOph, assumingT =25 (L∗/L)0.25K,κ890µm=2.0 cm2/g.
Mdustin theρOph and Upper Sco objects cover a similar range,
while several objects in Taurus haveMdust∼10 M⊕. Most Tau-rus BDs have been observed with single-dish telescopes and, in principle, the large fluxes could be the result of diffuse emission contamination. However, when both single dish and interfero-metric fluxes are available, they do not differ significantly (see e.g. Andrews & Williams 2007; Ricci et al. 2012, 2014).
The largest ratiosMdisk/M∗ are similar in the three regions, i.e. between 0.01 and 0.1. However, contrary to Taurus and U Sco, ρOph has a large number of BD disks with Mdisk/M∗ <∼
0.1. This may appear as a surprising result, given thatρ Oph should be the youngest of these regions. This difference is likely a selection effect, which is similar to what was already noted by Natta et al. (2006)for the mass accretion rate distribution. While ourρOph sample is unbiased with no pre-selection that could favour more massive disks, this is not the case of the Upper Sco sample(van der Plas et al. 2016).
Overall, the low dust masses shown in Fig.5agree with the estimates of disk masses derived fromHerschelfluxes for a num-ber of BDs in various star-forming regions(Harvey et al. 2012; Alves de Oliveira et al. 2013; Liu et al. 2015a,b). With the bulk of the disk population containing about one Earth mass of solids, the ability of these disks to form planets is obviously question-able. The study byPayne & Lodato (2007)suggests that disks containing a fraction of a Jupiter mass of material (including gas and dust) and surface density profiles that are shallower than Σ∝R−1are very unlikely to form planets at all. If we assume a
Fig. 6.Dust mass vs. stellar mass forρOph BDs (red) and TTS (blue). The dashed green lines show the dust mass in a disk with 10%, 1%, 0.1% the stellar mass, computed assuming a gas-to-dust mass ratio of 100.
companions(e.g. Chauvin et al. 2004; Joergens & Müller 2007; Todorov et al. 2010; Han et al. 2013)cannot be really considered to be formed in protoplanetary disks with the properties that we observe, and are most likely the result of a binary system forma-tion in the substellar regime.
5.2. Comparison between BDs and TTS disk masses
In Fig. 6 we show the disk mass for theρOph BDs together with the disk mass for the TTS in the same region as a func-tion of the mass of the central object. To compute the disk masses for the TTS sources, we used the 850 µm fluxes from Andrews & Williams (2007), calculated the appropriateTA for
each object, and applied Eq. (1) with the same value ofκ890µm
as for the BDs. This ensures that the same method has been used to compute the masses across the whole range, the choice of us-ing the same dust opacity for all sources is justified by the lack of evidence for a systematic difference in the dust properties in disks as a function of stellar mass in ρOph and in other star-forming regions(Ricci et al. 2010, 2012; Testi et al. 2014).
Figure6shows that the dust masses in disks around BDs ad TTS roughly scale as the mass of the central object. If we cor-rect for a gas-to-dust ratio of 100 by mass, then the disk contains approximately 1% of the mass of the system with a large scatter at any given mass of about one order of magnitude. A number of caveats are in order. Most importantly, the stellar parameters of theρOph TTS are very uncertain, as no systematic study of TTS comparable to that carried out byManara et al. (2015)for the BDs is available. We estimated L∗ and M∗ from the spec-tral types of McClure et al. (2010), assuming that all the stars lie on a 1 Myr isocrone as determined using the theoretical evo-lutionary tracks ofBaraffe et al. (1998). Although this does not affect the classification as TTS, which is based on the spectral type, it affects the exact location on the diagrams and the esti-mate of the disk-to-star mass ratio. Secondly, the sample of BDs and TTS that have good sub-mm measurements is largely incom-plete. The completeness of the BDs sample in this study has been addressed in Sect.2; the TTS sample limitations are described in Andrews & Williams (2007). In this paper we proceed with the analysis under the assumption that the samples are representative of the properties of the full populations, but this is an assump-tion that needs to be put on firmer ground with future optical
0.0 0.2 0.4 0.6 0.8 1.0
C
um
ul
at
iv
e
di
st
rib
ut
io
n
4.0 3.5 3.0 2.5 2.0 1.5 1.0
Log10(Mdisk/M?)
0 1 2 3 4 5 6
N(M
disk
/M?
)
Fig. 7.Cumulative distributions (top) and histogram of theMdisk/M? values forρOph BDs (red), the full TTS sample (cyan), and the subset with 0.2≤M?/M≤1.0 (green).
and near-infrared spectroscopic studies of the central stars and ALMA surveys of the full populations.
In Fig.6there is an apparent paucity of BD disks in the re-gion 1−10% of the mass of the central object compared with TTs. To quantitatively estimate whether there is a real discrep-ancy between the two samples, we analysed the cumulative dis-tributions of the ratioMdisk/M?for BDs and TTS. In Fig.7we
show (in the bottom panel) the distributions of the ratioMdisk/M?
for the fullAndrews & Williams (2007)sample (cyan filled his-togram), a subset of that sample with 0.2≤M?/M≤1.0 (green histogram), and for our BDs sample (red histogram). The top panel of Fig.7shows the cumulative distributions for the same samples. The TTS sample contains objects with central mass in the range from∼0.2Mto∼5M. We performed the Anderson-Darling test1 between these two samples and find∼1.6%
prob-ability that the two are drawn from the same parent distribution (for the purpose of this test we treated upper limits as measure-ments). The major caveat to bear in mind is the fact that the samples may not be fully representative of the full populations and that the methods for deriving the disk and stellar masses in the two samples are not fully identical. Future detailed charac-terization of, in particular, the TTS population (both the disk and photospheric properties) will allow us to provide a definitive an-swer as to whether the possible difference we see here is real.
5.3. Comparison with Taurus BD disks structure
[image:7.595.319.543.83.333.2]results on BD disks sizes reported byRicci et al. (2014)for disks in Taurus. To provide a proper comparison, we re-analysed the three BD disks in Taurus using the method outlined in Sect.4.2. In Table3we show the comparison between the values of {Rc,
γ} and {Rout,p}, which are derived by the two families of
mod-els, for theρOph and Taurus BDs (the figures with the model results for Taurus are reported in AppendixB). We confirm and extend the results of the previous study. The truncated power law parameters from our reanalysis are consistent with previous re-sults and, in addition, the exponentially tapered models are also consistent with a decreasingΣ(R) and a smooth outer disk edge. This seems to suggest the possibility of an important difference between the two most massive BD disks inρOph and those in Taurus. The Taurus disks have a structure very similar to those of more massive TTS, while theρOph BDs have smaller disks with a sharper outer edge. The dust mass in the disks does not seem to be very different,∼4.8−6.3M⊕in Oph and∼2,∼10, and∼15M⊕ for CFHT Tau4, 2M0444+2512 and CIDA 1, respectively.
Both the formation of BDs as ejected embryos (Reipurth & Clarke 2001) and dynamical interactions in a dense star-forming region would predict that disks may be truncated to small radii at some point of the early evolution of the system (Bate 2009, 2012). In all cases it is expected that the gaseous component of the disk viscously re-expands on timescales shorter than ∼1 Myr or a new outer disk could be accreted from the cloud (Bate 2012; Scicluna et al. 2014). At face value, our numbers are consistent with the results of Bate (2012)models; these models show that the distribution of disk sizes in young dense clusters may be rather small (<∼10 AU for 50% of the disks), but with a significant tail that extends to R>∼100 AU. The low density and/or slightly older age of Taurus may naturally explain the larger radii for 2M0444+2512, CIDA 1, and CFHT Tau4.
According toStamatellos & Whitworth (2009), BDs formed in the disk of a solar-mass star have disks with masses of<∼few
MJand radii of 20−50 AU with a small fraction of larger disks.
There is no correlation between the BD disk properties and those of the parental star. These disks are likely stripped by the follow-ing ejection, and the distribution of properties of the survivfollow-ing disks is not clearly predicted by models. It is possible that both theρOph and the Taurus BDs can be explained by ejection sce-narios. Lacking large observational samples and more detailed theoretical models that describe the properties and evolution of disks after ejection, we cannot really constraint in detail the BDs formation scenario.
Dynamical truncation of the disk radius on timescales longer than the viscous lifetime may be caused by the presence of a companion, which may truncate the circumstellar disk at a ra-dius of∼0.3–0.5 of the binary separation and effectively prevent its viscous expansion(Artymowicz & Lubow 1994). There are no reported companions for ISO-Oph160 and ISO-Oph193, but none of the current infrared surveys would be sensitive to close (∼000.5−100.0), planetary-mass companions. A dedicated measure-ment would be in order before ruling out this possibility. As a plausibility argument, we note that in our survey we do not find any large and massive disks inρOph that resemble those found in Taurus, and we expect that our unbiased search would have not missed these large, smooth disks.
A sharp edge in the dusty disk, as observed at millime-tre wavelengths, can also be the result of a very different pro-cess, namely grain evolution. As grains grow, fragment and drift, the large grains, that are responsible for the observed mm emission, decouple from the gas, and concentrate more to-wards the star. This effect, which is predicted by global disk
evolution models, is also measured in large protoplanetary disks around TTS and Herbig Ae/Be stars(e.g. Birnstiel et al. 2010; Pérez et al. 2012; Tazzari et al. 2016; Testi et al. 2014). Birnstiel & Andrews (2014)have shown that as a result of this process, the large grains surface density, as probed by millime-tre observations, shows a sharp decrease at a radius significantly smaller than that of the gaseous disk. The edge of the dusty disk, however, also tends to get smoother with time (on vis-cous timescales). Similar results are also found when photoe-vaporation is taken into account(Gorti et al. 2015). Although in this case the difference in size between the gaseous and dusty disk is reduced, the mm-size grains have a sharper outer cutoff than the gas. There is plenty of evidence of grain evolution in BD disks(Apai et al. 2004; Ricci et al. 2012, 2014). In particu-lar, the ISO-Oph102, 2M0444+2512, CIDA 1, and CFHT Tau4, observed with ALMA at two wavelengths byRicci et al. (2012, 2014)have mm spectral indexes∼2−2.4, and an exponent of the mm dust opacity lawβ∼0.2 that is typical of very large grains. Unfortunately, at present we have no information for the sam-ple of theρOph BDs at other wavelengths, and we do not know if ISO-Oph160 and ISO-Oph193, in particular, have evidence of evolved, large grains. The onlyρOph object for which this information is available is ISO-Oph102, which shows evidence of evolved grainsRicci et al. (2012)and a very compact contin-uum (deconvolved half-major axis<12 AU) and CO(J =3−2) emission (∼15 AU), which is consistent with the results for the two resolved objects. The Taurus BDs discussed in this paper all have evolved their grains; their dusty disks are large, have smooth edges, and are surrounded by extended gaseous disks, as TTS. If dust evolution occurs in bothρOph and Taurus BD disks, then the evolutionary stage or path of the two groups must be different, possibly owing to very different ages, initial disk structures, and/or environmental effects. However, this remains to be proved. On one side, the number of objects studied so far is very small and needs to be significantly increased. On the other, the difference between the two groups is significant at a 2.5σ level only, and ALMA observations with better resolution and sensitivity are in order.
6. Conclusions and summary
Our millimetre observations of disks in ρ Oph BDs provides the first large, homogeneous, and well-characterized sample in a young star-forming region. The sample is unbiased, as it con-tained all the spectroscopically confirmed Class II BDs at the time of the proposal, with no selection that could favour more massive disks. We detected 11/17 (∼65%) objects; the disk masses are∼0.5−6.3M⊕. For the remaining 6, we set 98% confi-dence level upper limits at∼0.3−0.9M⊕. There may be evidence for BDs to have typical values ofMdisk/M∗that are smaller than in TTS, which possibly supports the idea of a different formation path, but the biases and limited accuracy of the data for the TTS sample do not allow us to reach a firm conclusion. In all cases the emission from the BD disks inρOph appears to be compact with deconvolved major axis<∼20 AU. In most cases, however, we are limited by sensitivity in our ability to detect a possible emission from a declining dust surface density in the outer disk. Two objects are resolved, and we performed a detailed analysis to derive their surface density profile. Both objects have a flat surface density and a sharp cutoffat about<∼25 AU.
BDs are most likely the result of binary formation rather than bona fide planets formed in protoplanetary disks.
The difference between theρOph BDs studied here with re-spect to the Taurus BDs studied by Ricci et al. (2014), which have only slightly more massive disks (by factor<3), is striking. The Taurus BD disks are much larger and have a rather smooth edge (see Table3) that is very similar to TTS disks. It is possi-ble that theρOph environment is responsible, either by giving origin to disks with very different properties or because close en-counters between disk systems are much more frequent than in the more diffuse region Taurus. The possibilities that the Taurus BDs had the time to viscously spread-out their disks, or that the twoρOph BDs are close binaries cannot be ruled out with the current observational constraints.
Dust evolution (i.e. grain growth) has been confirmed both in the Taurus BDs and in ISO-Oph102, which is one of the BDs in our sample. The combination of growth, fragmentation, and drift can create dust disks that are much smaller than the gaseous disks with relatively sharp edges. However, it is difficult to ac-count for the difference with the Taurus BDs via dust evolution alone.
The results we found with this continuum survey are tanta-lizing, but clearly need to be put on firmer ground with future ALMA observations. On the one hand, it would be important to compare, with adequate signal to noise and angular resolution, the gaseous and dusty disks for the BDs with and without ev-idence for disk truncation discussed in Sect.4.2. On the other hand, it is also necessary to put on firm grounds and for other star-forming regions the possible difference in theMdisk/M?
dis-tributions of TTS and BDs discussed in Sect. 5.3. ALMA is now starting to provide extensive surveys of the protoplanetary disks populations around TTS in various star-forming regions (Ansdell et al. 2016; Barenfeld et al. 2016; Pascucci et al. 2016), and these offer a prime opportunity for a full extension to the substellar domain.
Acknowledgements. We thank Til Birnstiel for insightful discussions on the effect of grain growth on the measured outer edges of disks and Carlo Manara for the relentless efforts to overcome the difficulties in estimat-ing correctly the photospheric parameters of young BDs. This paper makes use of the following ALMA data: ADS/JAO.ALMA#2012.1.00037.S and ADS/JAO.ALMA#2011.0.00259.S. ALMA is a partnership of ESO (represent-ing its member states), NSF (USA) and NINS (Japan), together with NRC (Canada), NSC and ASIAA (Taiwan), and KASI (Republic of Korea), in coop-eration with the Republic of Chile. The Joint ALMA Observatory is operated by ESO, AUI/NRAO and NAOJ. A.N. acknowledges funding from Science Foun-dation Ireland (Grant 13/ERC/I2907). This work was partly supported by the Gothenburg Centre for Advanced Studies in Science and Technology as part of the GoCAS programOrigins of Habitable Planetsand by the Italian Ministero dell’Istruzione, Università e Ricerca through the grant Progetti Premiali 2012-iALMA (CUP C52I13000140001).
References
Alves de Oliveira, C., Moraux, E., Bouvier, J., & Bouy, H. 2012,A&A, 539, A151
Alves de Oliveira, C., Ábrahám, P., Marton, G., et al. 2013,A&A, 559, A126
Andrews, S. M., & Williams, J. P. 2005,ApJ, 631, 1134
Andrews, S. M., & Williams, J. P. 2007,ApJ, 671, 1800
Andrews, S. M., Rosenfeld, K. A., Kraus, A. L., & Wilner, D. J. 2013,ApJ, 771, 129
Ansdell, M., Williams, J. P., van der Marel, N., et al. 2016,ApJ, 828, 46
Apai, D., Pascucci, I., Sterzik, M. F., et al. 2004,A&A, 426, L53
Apai, D., Pascucci, I., Bouwman, J., et al. 2005,Science, 310, 834
Artymowicz, P., & Lubow, S. H. 1994,ApJ, 421, 651
Banzatti, A., Testi, L., Isella, A., et al. 2011,A&A, 525, A12
Baraffe, I., Chabrier, G., Allard, F., & Hauschildt, P. H. 1998,A&A, 337, 403
Baraffe, I., Chabrier, G., & Barman, T. 2008,A&A, 482, 315
Barenfeld, S. A., Carpenter, J. M., Ricci, L., & Isella, A. 2016, ApJ, 827, 142 Bate, M. R. 2004,Ap&SS, 292, 297
Bate, M. R. 2009,MNRAS, 392, 590
Bate, M. R. 2012,MNRAS, 419, 3115
Birnstiel, T., & Andrews, S. M. 2014,ApJ, 780, 153
Birnstiel, T., Dullemond, C. P., & Brauer, F. 2010,A&A, 513, A79
Broekhoven-Fiene, H., Matthews, B., Duchêne, G., et al. 2014,ApJ, 789, 155
Chauvin, G., Lagrange, A.-M., Dumas, C., et al. 2004,A&A, 425, L29
Chiang, E. I., & Goldreich, P. 1997,ApJ, 490, 368
Chiang, E. I., Joung, M. K., Creech-Eakman, M. J., et al. 2001,ApJ, 547, 1077
Comeron, F., Rieke, G. H., Claes, P., Torra, J., & Laureijs, R. J. 1998,A&A, 335, 522
Daemgen, S., Natta, A., Scholz, A., et al. 2016, A&A, in press, DOI: 10.1051/0004-6361/201628431
Dullemond, C. P., Dominik, C., & Natta, A. 2001,ApJ, 560, 957
Geers, V., Scholz, A., Jayawardhana, R., et al. 2011,ApJ, 726, 23
Gorti, U., Hollenbach, D., & Dullemond, C. P. 2015,ApJ, 804, 29
Guilloteau, S., Dutrey, A., Piétu, V., & Boehler, Y. 2011,A&A, 529, A105
Han, C., Jung, Y. K., Udalski, A., et al. 2013,ApJ, 778, 38
Harvey, P. M., Henning, T., Liu, Y., et al. 2012,ApJ, 755, 67
Hennebelle, P., & Chabrier, G. 2009,ApJ, 702, 1428
Hester, J. J., Scowen, P. A., Sankrit, R., et al. 1996,AJ, 111, 2349
Isella, A., Carpenter, J. M., & Sargent, A. I. 2009,ApJ, 701, 260
Joergens, V., & Müller, A. 2007,ApJ, 666, L113
Liu, Y., Herczeg, G. J., Gong, M., et al. 2015a,A&A, 573, A63
Liu, Y., Joergens, V., Bayo, A., Nielbock, M., & Wang, H. 2015b,A&A, 582, A22
Manara, C. F., Testi, L., Natta, A., & Alcalá, J. M. 2015,A&A, 579, A66
McClure, M. K., Furlan, E., Manoj, P., et al. 2010,ApJS, 188, 75
Mohanty, S., Greaves, J., Mortlock, D., et al. 2013,ApJ, 773, 168
Muži´c, K., Scholz, A., Geers, V., Jayawardhana, R., & Tamura, M. 2012,ApJ, 744, 134
Natta, A., & Testi, L. 2001,A&A, 376, L22
Natta, A., & Testi, L. 2008,Ap&SS, 313, 113
Natta, A., Testi, L., Comerón, F., et al. 2002,A&A, 393, 597
Natta, A., Testi, L., & Randich, S. 2006,A&A, 452, 245
Pascucci, I., Testi, L., Herczeg, G., et al. 2016, ApJ, in press [arXiv:1608.03621]
Payne, M. J., & Lodato, G. 2007,MNRAS, 381, 1597
Pérez, L. M., Carpenter, J. M., Chandler, C. J., et al. 2012,ApJ, 760, L17
Pinilla, P., Birnstiel, T., Benisty, M., et al. 2013,A&A, 554, A95
Pollack, J. B., Hollenbach, D., Beckwith, S., et al. 1994,ApJ, 421, 615
Rebolo, R., Zapatero Osorio, M. R., & Martín, E. L. 1995,Nature, 377, 129
Reipurth, B., & Clarke, C. 2001,AJ, 122, 432
Ricci, L., Testi, L., Natta, A., & Brooks, K. J. 2010,A&A, 521, A66
Ricci, L., Testi, L., Natta, A., Scholz, A., & de Gregorio-Monsalvo, I. 2012,ApJ, 761, L20
Ricci, L., Isella, A., Carpenter, J. M., & Testi, L. 2013,ApJ, 764, L27
Ricci, L., Testi, L., Natta, A., et al. 2014,ApJ, 791, 20
Scholz, F.-W., & Stephens, M. A. 1987,82, 918
Scicluna, P., Rosotti, G., Dale, J. E., & Testi, L. 2014,A&A, 566, L3
Stamatellos, D., & Herczeg, G. J. 2015,MNRAS, 449, 3432
Stamatellos, D., & Whitworth, A. P. 2009,MNRAS, 392, 413
Sterzik, M. F., Pascucci, I., Apai, D., van der Bliek, N., & Dullemond, C. P. 2004,
A&A, 427, 245
Tazzari, M., Testi, L., Ercolano, B., et al. 2016,A&A, 588, A53
Testi, L., Natta, A., Oliva, E., et al. 2002,ApJ, 571, L155
Testi, L., Birnstiel, T., Ricci, L., et al. 2014,Protostars and Planets VI, 339
Todorov, K., Luhman, K. L., & McLeod, K. K. 2010,ApJ, 714, L84
Trotta, F., Testi, L., Natta, A., Isella, A., & Ricci, L. 2013,A&A, 558, A64
Udalski, A., Jung, Y. K., Han, C., et al. 2015,ApJ, 812, 47
van der Plas, G., Ménard, F., Ward-Duong, K., et al. 2016,ApJ, 819, 102
Fig. A.1.Dust mass vs stellar mass forρOph BDs (red) and TTS (blue). Thetop panel shows the results obtained by computing dust masses from Eq. (1) withT =20 K for all objects. Themid panelwhen adopt-ing the scaladopt-ing law ofTwithL∗suggested byvan der Plas et al. (2016).
Thebottom paneladopting the scaling law of Andrews et al. (2013), as in Sect. 4.1. The dashed green lines show the dust mass in a disk with 10%, 1%, 0.1% the stellar mass, computed assuming a gas-to-dust mass ratio of 100.
Appendix A: Temperature
TheAndrews et al. (2013)scaling law was derived from a grid of disk radiation transfer models over a rangeL∗∼0.1−100 L. The choice of the value of T appropriate to recover the dust
mass from the observed (sub)mm flux for very low-mass TTs and BDs was recently discussed byDaemgen et al. (2016), who show that, in addition toL∗, the value depends strongly on the degree of disk flaring, and, to a lesser degree, on the disk mass it-self and other disk parameters. Using the ratio of the far-infrared flux to theJ-band flux, which is a good proxy for the stellar lu-minosity, these authors find that most objects withHerschel far-infrared measurements have ratios that are much lower than the values predicted by fully flared disk models. This is also true also for the BDs in our sample with measuredHerschelfluxes. Based on the analysis ofDaemgen et al. (2016), we conclude that the most appropriate value of the disk averaged temperature for the estimate of the disk mass from the millimetre flux is likely to be a few degrees lower thanTA. The error on the disk mass
com-puted with temperatureTA, however, is of order±20%, with a
systematic trend of underestimating the dust mass in BDs and overestimating it in low-luminosity TTS .
Very recently,van der Plas et al. (2016)have proposed a dif-ferent scaling law ofT withL∗(TvdP =22 (L∗/L)0.16), using a sample of eight BDs and very low-mass TTS in U Sco with mea-sured ALMA fluxes. They derive the best disk mass from fitting the SEDs at all wavelengths and compare it with the results ob-tained from the (sub)mm flux only, usingTAand their improved
prescription. They find that, on average, the masses derived us-ingTAare a factor∼3 larger than the result of the SED fits; the
discrepancy is significantly reduced whenTvdPis used. In
prac-tice, for our sample the difference inMdustderived using the two
temperature prescriptions is not large; this difference is typically within a factor 1.5 for the majority of objects and∼2 for the two lowest luminosity objects, ISO-Oph033 and GY92-320. Given the large number of free parameters and uncertainties, and for an easier comparison with literature results for TTS, in this paper we have usedTAto compute dust masses with the caveat that the
dust mass in the lowest luminosity objects may be overestimated by a factor of up to 2.
Even if the uncertainty on individual measurements is not very large, the choice ofT in Eq. (1) may introduce a system-atic trend in the disk mass–stellar mass relation, discussed in Sect. 5.2, because in star-forming regionsM∗is roughly corre-lated withL∗. In this context, the choice ofTAto compute dust
masses is the most conservative, i.e. this choice minimizes any existing trend of Mdust with M∗. Fig.A.1shows the results for a constant value ofT =20 K, and usingTvdp. ForT = const.,
Mdust is∝F890µm. One can see that in both cases the difference
between the BDs and the TTS is larger than forT =TA.
Appendix B: Model fits to the structure of Taurus BD disks
In this Appendix we present the results of the reanalysis of the Taurus BD disks ALMA 890µm observations fromRicci et al. (2014). We applied the procedure and parameters as described in Sect.4.2to derive comparable results to our modelling of theρ Oph BDs. The results for the truncated power law fits are consis-tent with the results presented inRicci et al. (2014), in addition, we also performed the fits with the exponentially taperedΣ(R). The lower values ofRcfor the exponentially tapered, as
com-pared with Rout in the truncated power law case, is consistent
with the values ofγin the range 1−1.5. The model results are shown in graphical form in Figs.B.1andB.2, where we show the two-parameter probability distributions for the pairs {Rc,γ}
and {Rout,p} (Fig.B.1), and the comparison between the ALMA
-2
-1
0
1
2
γ
0
100
200
300
Rc
2M0444
-2 -1 0 1 2 3 4
p
0
100
200
300
Rou
t
2M0444
-2
-1
0
1
2
γ
0
100
200
300
Rc
CIDA 1
-2 -1 0 1 2 3 4
p
0
100
200
300
Rou
t
CIDA 1
-2
-1
0
1
2
γ
0
100
200
300
Rc
CFHT Tau4
-2 -1 0 1 2 3 4
p
0
100
200
300
Rou
t
[image:11.595.39.286.80.451.2]CFHT Tau 4
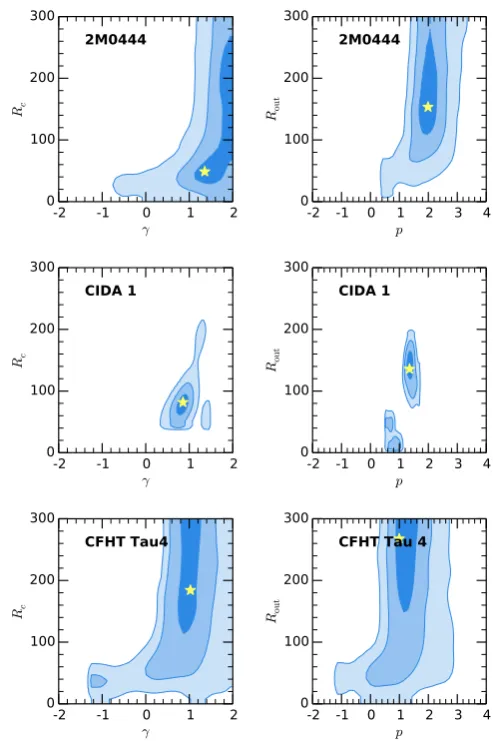
Fig. B.1.Two-dimensional distributions of the model parameters {Rc,
γ} (left column) and {Rout, p} (right column) for the model fits of the disks in 2M0444+2512 (top row), CIDA 1 (middle row), and CFHT Tau4 (bottom row). The different shaded areas correspond to the 1, 2 and 3σconfidence levels (from light to dark blue), as in Fig.2. The yellow stars mark the parameter values for the models plotted in Fig.B.2.