TARGET SIZE GUIDELINES
FOR INTERACTIVE DISPLAYS ON THE FLIGHT DECK
Huseyin Avsar, Joel Fischer, Tom Rodden
The University of Nottingham, United Kingdom
Abstract
The avionics industry is seeking to understand the challenges and benefits of touchscreens on flight decks. This paper presents an investigation of interactive displays on the flight deck focusing on the impact of target size, placement and vibration on performance. A study was undertaken with search and rescue (SAR) crew members in an operational setting in helicopters. Results are essential to understand how to design effective touchscreen interfaces for the flight deck.
Results show that device placement, vibration and target size have significant effects on targeting accuracy. However, increasing target size eliminates the negative effects of placement and vibration in most cases. The findings suggest that 15 mm targets are sufficiently large for non-safety critical Electronic Flight Bag (EFB) applications. For interaction with fixed displays where pilots have to extend their arms, and for safety critical tasks it is recommended to use interactive elements of about 20 mm size.
Introduction
Digital devices have long since started to replace analogue input devices on the flight deck. Considerable changes have consolidated the number of inputs (e.g. buttons, switches and knobs) and outputs (e.g. displays). More recently, suppliers for cockpit equipment have started to explore opportunities for the integration of touchscreens in and around the cockpit. From the manufacturer’s perspective, the key advantage of touchscreens is that they are adaptable to any configuration by changing the underlying software, and they do not require removing and reconfiguring physical input devices [1]. These technologies could lead to a point where physical input devices completely disappear from the flight deck and interactions with the aircraft system occur exclusively through interactive displays [2].
Touchscreens entered the cockpit environment through portable electronic devices (PED). The usage was similar to an electronic flight bag (EFB). Pilots
were able to make performance calculations, create flight plans and utilise various formats of charts and checklists [3]. From an air carrier’s point of view, the benefits were reduced operational costs and crew workload [4].
Leading avionics manufacturers such as Honeywell [5] and Thales [6] have shown increasing interest in integrating touchscreens into the cockpit. Touchscreens for all types of aircraft are appearing, but requirements differ for each application. Use in safety-critical applications places a high demand on the operator to input data accurately. For example, SAR operations involve challenging conditions in which the operator has to enter data while being exposed to strong vibrations. Pilots are likely to encounter stronger turbulences that could impede the usability of touchscreens in helicopters, especially when operating at lower altitudes. Two-thirds of fatal accidents are caused by human error [7], which makes designing a usable interface more important.
This work addresses the challenge how to design these touchscreens so that they are effective and ultimately usable by pilots. Previous studies have found that the biggest drawbacks of soft buttons (i.e. interactive elements) compared to their physical counterparts are unwanted and accidental touches [8] and absence of tactile feedback [9]. The size of interactive elements (e.g. buttons), called ‘target size’, has a significant impact on these errors.
Related Work
Mobile device suppliers like Apple [10], Google [11], and Microsoft [12] have their own recommendations for target sizes, which are in general a compromise between acceptable error rate and available screen area [13]. In academia, target sizes have been tested in many different conditions. Independent variables that have been studied include activity (walking [14] or standing [15]), mobility (mobile devices [14] or fixed devices [15]), usage (one handed thumb [16] or both hands [17]), feedback modality (auditory and haptic [18]), target population (older adults [19]) and task (alphanumeric text entry [17], numeric text entry [15] and tapping task [13]). The majority of the experiments compared larger targets versus smaller targets and investigated if spacing between targets would have a significant effect on the overall performance. Common results show that larger targets result in better accuracy than smaller targets, and that “small” spacing between the targets does not have a significant impact.
Schedlbauer [20] evaluated the performance and accuracy of data input on keypads by using a fixed experimental apparatus, where the task was to type 10 digit GPS coordinates. His results showed that a key size of 15 mm appears to be sufficiently large to provide acceptable accuracy (error rate: 1.9%). This value was confirmed by Tsang et. al [21] who performed a similar experiment and defined 15 mm targets as a cut-off point where target sizes below end up with higher error rates. Another finding was that there is no further improvement for key sizes beyond 20 mm. This outcome is supported by Colle and Hiszem [15], who could not find a significant difference between key size of 20 and 25 mm.
Henze and colleagues [13] developed a tapping task game for smartphones. This was an unsupervised experiment, which found that targets below 15 mm had an increased error rate. The error rate increased to over 40% for targets smaller than 8 mm. Leitao and Silva [19], published interface design guidelines for older people. Participants performed tapping and swiping tasks on a handheld device. In their study, 14 mm could be considered as a break-even point since there was no significant difference for larger targets.
Another study [14] with mobile devices found that walking degrades the error rate significantly. While standing, users performing a two-dimensional tapping task made on average 6.77% fewer errors. The
largest tested target size was 9.5 mm (error rate 16%). The authors claim that increasing the target size by 40% would compensate for the negative effects of walking. Bergstrom-Lehtovirta et al. [22] performed target selection while walking on a treadmill, and conclude that all types of walking, regardless of speed, causes a noticeable decrease in accuracy.
For applications in vehicles or with the potential use of gloves, the Department of Defense (DOD) [23] recommended target sizes between 10 mm and 25 mm. The Federal Aviation Administration (FAA) advised designers to demonstrate that integration of touchscreens should not result in unacceptable levels of workload and error rates [24]. There was no explicit guidance on minimum target size or acceptable error rate under high-vibration conditions that are particularly likely in helicopter operations.
The flight deck is an environment, in which errors need to be minimized. However, there is little research about the impact of dynamic (e.g. vibrating, turbulent) environments. During a flight, pilots could face particular difficulties operating touchscreen devices when the display is moving or vibrating independently from the body. Recently, Dodd et al. [1] published research performed in a flight simulator, and found that turbulence has a significant effect on error rates. Their experimental design suggests that this research was focused on commercial aircraft (above 8000 feet, at an airspeed of approximately 250 knots). Since general aviation aircraft and helicopters are smaller, lighter and operating at lower altitudes, pilots are likely to feel higher vibrations/turbulences. Thus, results from a commercial aircraft setting may not be transferrable.
The purpose of this research is to establish design guidelines and recommendations for target sizes on fixed and mobile touchscreens on a helicopter flight deck.
Key hypotheses driving this work are:
Vibration, placement and target size have a significant negative effect on error rates.
Increasing target size will minimize the negative effects of vibration and placement.
Approach
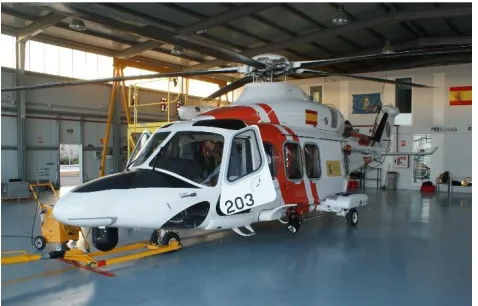
The research was carried out in a Search and Rescue (SAR) setting. Our site of study was the Spanish Maritime Safety Agency, also known as SASEMAR, between April and May 2015. SASEMAR has eight identical Agusta Westland AW139 Helicopters (Figure 1) distributed along the Spanish coast. Data was collected during 12 training flights in four different bases (Reus, Valencia, Almeria and Jerez). The crew conducted the experiments at their own discretion, in periods of downtime from their primary activities.
Crews operate on 12-hour shift. Apart from scheduled training and patrol flights, crews do not know when and where they are going. Because of the nature of rescue missions, response time is critical. Once a distress call is received, the crew is ready to take off within 15 minutes. In the air (1500-2000 feet above ground level), the crew flies with maximum cruise speed (120-130 knots) to the target location. Targets could be small and moving objects such as a person over board or small watercraft. Helicopters may have to operate in challenging areas (sea or cliffs) and weather conditions.
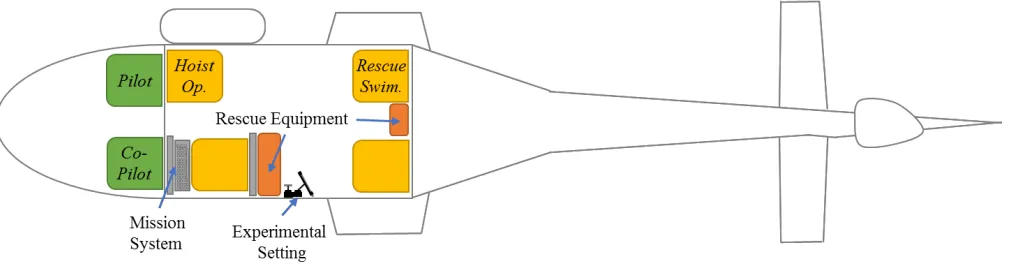
[image:3.612.59.298.511.664.2]During training flights, the crew is simulating possible scenarios. Variables for such operations are search required or not required, target type, rescue procedure, and rescue equipment used. For each training flight, two or three possible scenarios will be trained. This kind of training flight takes on average 2:15 hours. There are four crew members: pilot, co-pilot, hoist operator and rescue swimmer. Each crew member has separate responsibilities, and they are interacting with each other continually.
Figure 1. SASEMAR AW139.
In real rescue missions, the pilot is usually the on-scene coordinator (OSC), who coordinates all other units.
Detailed information about SAR operations are available in the IAMSAR (International Aeronautical and Maritime Search and Rescue) Manual [25].
Method
We adopted a mixed methods approach. A series of experiments (described below) were undertaken in a lab setting prior to moving to more open-ended field investigation in a real-world setting. Initial experimental results showed significant differences in targeting accuracy and movement time for using touchscreens in a static environment compared to a dynamic (vibrating) environment. This motivated the transfer of experiments into a real-world setting to achieve ecologically valid results.
Participants
The target population are pilots. However, for safety reasons pilots could not directly participate in field trials. Participants were hoist operators and rescue swimmers. 14 male crew members conducted the experiment. Their age ranged from 27 to 52 years old (M=35.6, SD=11.8). Two of the participants were left-handed. The number of years on duty ranged from 3 to 25 years (M=9.6, SD=8.6). 13 Participants used a touch-enabled device (smartphone or tablet) and rated their touchscreen skills on a 10-point scale. (10 means very good) (M=7.9, SD=0.9).
Apparatus
In initial research aimed at learning about the features, content and functionality that pilots would like to see in an electronic flight bag (EFB), we asked what kind of tablet device they would prefer to use within the cockpit.
Results from pilot trials showed that an 8-inch tablet would be sufficiently large to display flight related information. Three pilots already used an iPad Mini as an EFB. Thus, an Apple iPad Mini (7.9” with capacitive touchscreen) was used for the entire experiment.
the range is 19.613m/s2. Minimum delay is 0.01
seconds.
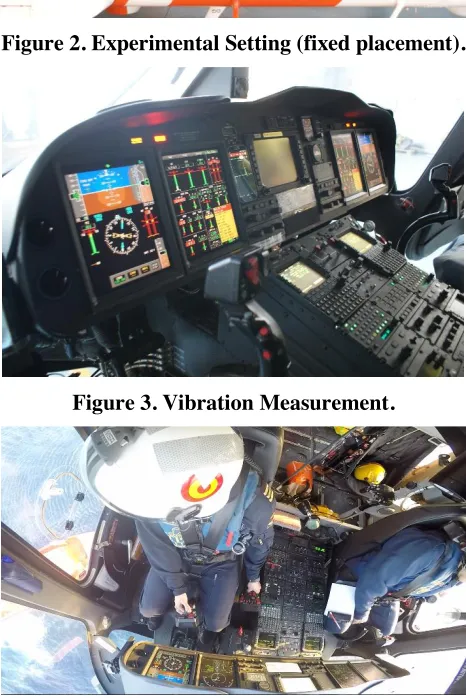
Experiments were performed with two different device placements (mobile and fixed). In the mobile condition, participants hold the device while performing the experiment. In the fixed condition (Figure 2), the tablet is attached to a suction cup holder mounted on the window. The distance from the seating position is 65 cm, which is approximately the same distance as that between pilots and the main instrument panel. Some double-sided tape was affixed to the window in order to stabilize the tablet in its position and to absorb its vibrations.
Experimental Design
A 2x3x4 within-subjects design with repeated measures was used for the experiment.
Independent variables in this experiment were placement (2 levels - fixed and mobile), vibration (3 levels – cruise, transition and hover) and target size (4 levels – 5 mm, 10 mm, 15 mm and 20 mm). The minimum target size (5 mm) was determined using Google’s Design Guidelines. The largest target size (20 mm) was adopted from previous work, in which authors achieved almost 100% accuracy. The target was displayed randomly, and the position and size of the target was recorded.
Recorded dependent variables were movement time, touch position, distance and error rate. There was no minimum quantity of data that participants had to generate during a flight.
Vibration Measurement
An application called “Physics Toolbox Accelerometer” [26] was used to record vibrations within the aircraft. Measurements were taken in three different locations. The first measurements were collected at the point where the experiment was conducted with fixed device placement. These measurements were compared with another measurement on the dashboard (Figure 3). The smartphone was attached between the Multi-Function Display and Central Display Unit. When the placement was mobile, participants held the device in their hand with the aim to see whether the human body is able to compensate a certain amount of vibration. 50 measurements were recorded per second.
Flight Recording
[image:4.612.318.554.156.317.2]Another research objective aimed at understanding how pilots interact with the cockpit system; thus, video recordings were made. The camera was positioned at an angle from which it was able to capture the pedestal, dashboard and the outside view from the pilot’s side (see Figure 4).
Figure 2. Experimental Setting (fixed placement).
Figure 3. Vibration Measurement.
[image:4.612.319.552.310.659.2]These recordings were used to double-check in which flight mode (cruise, transition, or hover) the aircraft was in.
Flight Protocol
During the flights, the investigator was on board, controlling the order of the experiment and recording events that occurred at specific times.
Events include briefing, initiated checklist, engine start, taxi, take-off, landing, transition to cruise and hover, cruise, approach target, type of target, type of training, rescue swimmer preparation start, hover, door open, relative position to the target, dummy and rescue man down and up events; used equipment, changes in speed and altitude, how participants held the device when it was mobile, and change from mobile to fixed placement were all recorded.
Task Design
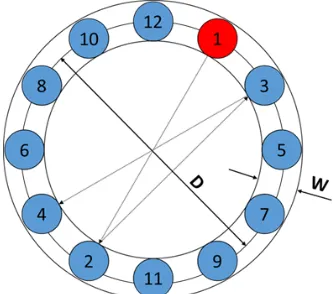
The ISO 9241-9 [27] recommended task design for input devices evaluation is illustrated in
Figure 5. In this multi-directional tapping task targets are arranged around a circle. The task is to tap all targets in a consecutive order. Taps outside of the circle are recorded as an error. The distance (D) and the width (W) changes after the trial is completed.
This task design was tried out in the lab. Initial results showed that participants tended to hover their finger over the next target before clicking the current target with the other hand. This kind of predictability would bias the movement time measurements compared to realistic operational use.
Restricting participants to use only one hand would have conflicted with the goal of seeing how participants use the device in a real world situation. It was not intended to compare results with prior work that applied the ISO task design. It was decided to create a task in which the size and the distance of the targets changed dynamically after each target.
A tapping task (land-on touch strategy) was created using JavaScript (Figure 6). The task was to tap targets (displayed as red circles) sequentially. The app recorded performance data in a .csv file.
Data recording occurs as follows: the first target is displayed and the user taps the target. The position of the target and the actual touch position are recorded. The current target disappears and the next target is
displayed, the user taps the next target. Again, the actual target and touch position are recorded. Using time stamps the duration between two targets (movement time in milliseconds) is calculated and stored. In addition, the distance between targets is recorded. Touching outside the target is recorded as an error. The target remains until the user touches the target. The number of errors per task are recorded. The mean errors are calculated by dividing the number of errors by the number of tasks. This paper covers error rate and vibration analyses.
Procedure
The aims and objectives were explained to participants. Each participant was notified that the aim was to investigate the impact of vibration and turbulence to targeting accuracy and movement time on touch-enabled devices. Participants were asked to be as accurate as possible, while performing the task at a normal pace.
[image:5.612.359.527.339.486.2]Figure 5. ISO-9241 Input Device Evaluation Task.
[image:5.612.317.553.496.675.2]The experiment started with a baseline determination, replicating previous work. Participants conducted some trials on the ground to practice.
Figure 7 illustrates the default positions of each crew member during take-off. The investigator sat on the seat from which the experiment would be conducted in the fixed placement condition.
In the following sections, possible time frames are described, in which crew members were able to perform the experiment. To avoid fatigue effects, the investigator asked participants to stop after 5 minutes. Participants took their gloves off during the experiment. Some hoist operators had gloves without index finger, thus they were able to conduct the experiments while wearing gloves.
Before take-off, the screen of the tablet was cleaned. The experiment started in the mobile placement condition. After take off the rescue swimmer started with the tapping targets activity. After approximately 5 minutes, the rescue swimmer handed over the tablet to the hoist operator and he continued the experiment. The pilot notified the persons in the rear cabin approximately 10 minutes before reaching the target. The rescue swimmer started with preparations. The investigator gave the hoist operator a signal when the transition to hover was attempted (around 80 knots). Once the aircraft was in hover, pilots required on average 3 minutes to position the aircraft close to the target. The hoist operator handed over the tablet to the rescue swimmer. The rescue swimmer continued with the experiments. The hoist operator opened the door and spoke with the pilot to make fine adjustments for the position of the aircraft. It was also possible for the hoist operator to take full control over the aircraft and position the
aircraft by using his controller. At this stage, the experiment was done in the mobile condition for all flight modes (cruise, transition and hover).
After the first training was completed and the door was closed, the investigator attached the tablet device to the fixture. From that point, the experiments were conducted using the fixed placement. Participants were requested not to fasten seatbelts to save time. However, participants were asked not to lean towards the display. The helicopter flew away from the target and circled. The investigator swapped his seat with the hoist operator. Once the helicopter approached the target (when transitioning occurred), the hoist operator started with the taps. The hoist operator finished the task once the helicopter was ready for opening doors. He swapped his seat with the rescue swimmer who continued with the task. The rescue swimmer stopped once his duty started.
Once the second training was completed, the hoist operator closed the door and the helicopter took off and turned for the third scenario if there was one, otherwise, the crew returned to base. During this transit flight, the crew would perform the experiment again. Approximately 10 minutes before landing, the investigator gave the hoist operator a signal to start the experiments; after 5 minutes, he swapped with the rescue swimmer who performed the experiments until landing.
[image:6.612.57.562.529.661.2]Data was recorded in nine flights as mentioned above. At this point, it was noticed that more data had been collected in the mobile condition than with the fixed placement. Thus, during the last three flights the experiment was conducted only in the fixed condition.
Results
Vibrations
The application recorded the acceleration in x, y, and z directions with a timestamp. The magnitude of the vibration was calculated by using Equation 1.
𝑀 = √𝑥2+ 𝑦2+ 𝑧2
Equation 1
At least 15 measurements are recorded per second. The flight protocol and recordings were used to determine the timeframes for specific flight modes.
The data was annotated with a key value describing the flight mode. The key value is the same as described in the next section. Timelines are added to visualize flight modes. (Note: transition phases are the timeframes between cruise and hover)
Figure 8 shows vibrations recorded during a flight in Valencia. The smartphone was attached to another suction cup holder, which is mounted behind the fixed device placement (see Figure 7). For this particular flight, the mean vibration for cruise was around 5 m/s2, for transition 12 m/s2 and for hover 7
[image:7.612.59.559.225.660.2]m/s2.
Figure 8. Vibration Measurement in Fix Position
Figure 9. Vibration Measurement on the Dashboard
However, this does not mean that vibrations always lead to the same values. The airspeed is a significant factor during cruise that can cause high vibrations. During this flight, the cruise speed was always below 120 knots. During a different flight in Reus, the cruise speed was sometimes over 130 knots and the smartphone measured a mean vibration of 6 m/s2.
Depending on the weather and location, vibrations during hover could be as small as 4 m/s2.
The magnitude of vibrations during transition phases depend on how fast the pilot transitions through the critical speed where the vibrations are highest. Thus, the measurements reflect when the pilot decreased speed during a transition down phase more slowly. In this transition phase, vibrations of more than 15 m/s2
were measured.
The data shown in Figure 9 was recorded on the main instrument panel during a night flight in Almeria. Vibrations for cruise were around 3 m/s2, hover were
2.5 m/s2 and transitions were 5 m/s2. The second
recording in this setting had similar values.
The last Figure 10 is a collection of different vibration measurements, which were taken on the hand of participants, to see whether the human body is able to compensate vibrations. Results show that the majority of measurement for cruise and hover were below 2 m/s2 where the average was around 1.5 m/s2.
During transition phases, vibrations increased to 3 m/s2. There are fluctuations in the measurement,
which are likely caused by hand movement.
All measurements were imported to IBM SPSS to test the groups for statistical significance. ANOVA revealed for all cases that the levels of vibration (cruise, hover and transition) are significantly different from each other. An ANOVA for mobile measurement was not performed because of few and intermittent measurements.
Error Rates
Data Sorting296 data sets (comprised of 14,504 data points) were imported from the app. Each task received a key value describing the placement, vibration and target size. The key value consists of four digits (see Figure 11). The first digit describes the placement (1-fixed, 2-mobile), the second digit describes the vibration (1-cruise, 2-transition, 3-hover) and the last two digits
describe the target size. For example, 1115 means that the task was performed with a fixed placement, during cruise and the target size was 15 mm.
Data received their key value by using the flight protocol. These values were double-checked with vibration measurements and video recordings. Tables 1 through 5 present the mean and standard deviation on task error rate in percent versus several different conditioning factors. A probability value (p) of 0.05 was chosen as a cut-off level for statistical significance.
[image:8.612.322.554.304.486.2]Statistical analyses were performed using IBM SPSS. The present analyses starts at the top level where all independent variables were considered separately. In the next level, the data was examined for significant interaction (multiple effects) between independent variables. The last step evaluated significant differences between each condition.
Figure 11. Independent Variables. I-III correspond to different levels of analysis.
Placement
the assumption of equality of variances. The scores for the fixed placement were significantly higher than for the mobile condition (see Table 1).
Vibration
There was a significant effect of vibration on error rates at the p<.05 level. Least significant error (LSD) and Bonferroni post-hoc test compared effects pairwise. Results showed that all combinations are significantly different from each other (see Table 2).
Target Size
[image:9.612.315.556.228.668.2]There was a significant effect of target size on error rates at the p<0.05 level. LSD and Bonferroni found a significant difference for pairwise combinations apart from the combination of target sizes 15 mm and 20 mm (see Table 3).
Table 1. T-Test for Placements.
ID Placement M (%) SD (%)
1 Fix 20 57
2 Mobile 15 45
t(13407)=6.74; p = <0.01 (two tailed)
Table 2. ANOVA for Vibrations.
ID Vibration M (%) SD (%)
1 Cruise 15 47
2 Transition 23 61
3 Hover 17 50
F(2,14403)=32.84, p=0.000
Table 3. ANOVA for Target Sizes.
ID Target M (%) SD (%)
5 5 mm 47 79
10 10 mm 10 32
15 15 mm 3 19
20 20 mm 1 12
F(3,14402)=777.24, p=000
Univariate Analysis of Variance (Level II)
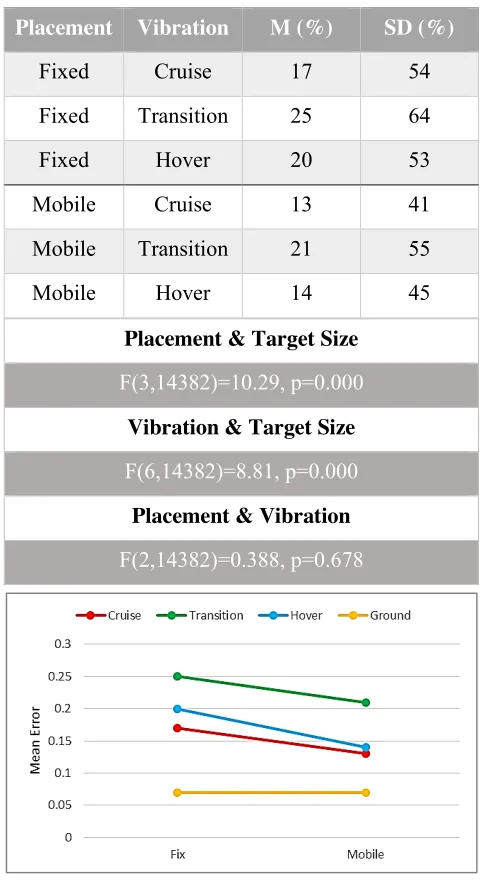
A univariate analysis of variance revealed significant interaction effects between placement and target size and also vibration and target size. There was no significant interaction between placement and vibration (Table 4). This suggests that the impact of placement and vibration depends on the size of the targets.
Figure 12 shows the error rates by vibration and placement. It is noticeable that participants made fewer errors when the device was mobile.
Table 4. Uni. ANOVA for Independent Variables.
Placement Vibration M (%) SD (%)
Fixed Cruise 17 54
Fixed Transition 25 64
Fixed Hover 20 53
Mobile Cruise 13 41
Mobile Transition 21 55
Mobile Hover 14 45
Placement & Target Size
F(3,14382)=10.29, p=0.000
Vibration & Target Size
F(6,14382)=8.81, p=0.000
Placement & Vibration
[image:9.612.63.501.268.693.2]F(2,14382)=0.388, p=0.678
[image:9.612.58.296.290.701.2]All Conditions ANOVA (Level III)
In the following Figure 13 and Figure 14, error rates for each placement condition are plotted by target size. Mean Errors and their standard deviations for all conditions are shown in Table 5.
The largest difference in error rates occurred in the mobile condition for a 5 mm target size. The difference between cruise and transition was 20% (for the fixed placement this value is 19%). This margin decreases for all vibrations with increasing target size. The largest difference for placement was also found at 5 mm target. The difference for all vibrations were around 12-13%. Like before, increasing the target size reduces the effect of the placement.
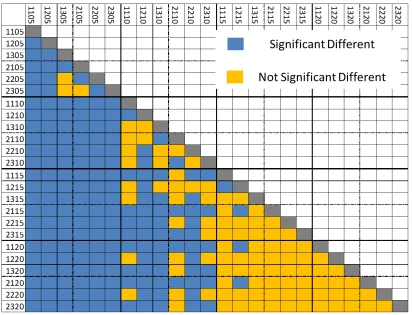
LSD and Bonferonni post-hoc analyses compared all conditions pairwise for significant difference. The results are visualized in a 24x24 matrix on Figure 15.
Figure 13. Errors by Target Size for the Fixed Placement Condition.
Figure 14. Errors by Target Size for the Mobile Placement Condition.
Table 5. M and SD for all conditions
ID M (%) SD (%)
1105 48 86
1110 9 31
1115 3 17
1120 1 9
1205 67 98
1210 14 42
1215 8 30
1220 3 18
1305 53 80
1310 13 38
1315 5 23
1320 2 14
2105 35 64
2110 7 26
2115 2 13
2120 1 8
2205 55 83
2210 11 32
2215 3 18
2220 2 13
2305 40 74
2310 8 28
2315 2 16
As shown in Figure 15, 5 mm target sizes were significantly different to all other target sizes. However, there were a few pairs which were not significantly different (1305/2205, 1305/2305 and 2105/2305); amounting to 2% of the comparisons in which 5 mm targets were involved.
Comparing 10 mm targets with the same level and larger target sizes reveal more cases that are not significantly different. 24% of the pairwise comparisons in which 10 mm targets were involved showed no significant difference.
The first level of analysis with all factors considered independently showed no significant difference for 15 mm and 20 mm targets. Considering all conditions separately as shown in Figure 15 showed that the error rate for 15 mm targets during the transition phase with a fixed placement (1215) differed significantly from 15 and 20 mm targets during cruise for both conditions (1115, 1120, 2115 and 2120). 58% of the comparisons in which 15 mm targets were involved showed no significant difference.
Comparing conditions that have 20 mm targets involved did not show any significant difference.
Discussion
Usage and Handling
Interaction in the fixed placement condition was performed with one hand. Participants always used their preferred hand. They were encouraged to take a break when feeling fatigue in their arms. Eight participants were observed to tend to hold on to the device from the side or above. To avoid bias participants were asked not to hold on to the device. However, the observation suggests that people tend to hold on to the screen to stabilize their hands. This could be factored in when designing the hardware as well as the software interface. For example, the display could be designed in such a way that it enables pilots to stabilize their hands from all directions (from behind included) and interactive elements should be placed along the sides.
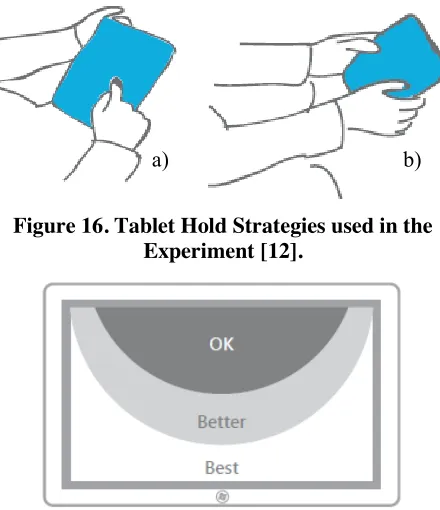
[image:11.612.101.513.54.369.2]Figure 16. Tablet Hold Strategies used in the Experiment [12].
Figure 17. Recommended Interactions Areas for Two Hands Holding, Thumbs Interaction [12]. their non-dominant hand and performed the experiments with their preferred hand’s index finger (see Figure 16a). In two cases, participants switched from two-handed thumb to one handed index finger grip.
It was observed that participants that used both hands had difficulties touching the target at the centre of the tablet. Participants had to readjust their grip frequently. This is a known drawback of this hold strategy. Figure 17 shows recommended interaction areas for two-handed holding. Post interviews revealed that participants prefer to use the tablet device in the mobile condition. In contrast, the fixed placement was described as more fatiguing.
On Vibration
It was expected that vibrations measured in the fixed condition would be more intense than those on the main instrument panel, which is installed on a system, which absorbs a certain amount of vibrations. By contrast, in the fixed placement condition the smartphone and tablet were attached to the window via a suction cup fixture, which transferred the entire airframe vibration to the devices without absorption.
Interviews with pilots showed that there are times, especially during winter months, in which they
have to operate in challenging weather conditions. In these times, pilots are exposed to higher vibrations and turbulences. Thus, experiments conducted with higher vibrations resulting from the fixed placement may be considered to emulate a certain amount of realism.
The analysis of vibration measurements gathered in the mobile condition showed that the human body is able to absorb a certain amount of vibration. The peak value was measured as expected during transition phases. In other flight modes, which cover the majority of the flight, vibrations did not increase beyond 3 m/s2.
Observations showed that pilots performed more ‘manual’ actions during hover compared to cruise. During hover, the wind is pushing the aircraft away from its position and the pilot has to steer manually to keep the aircraft at the desired position. This causes additional unexpected movements in the aircraft. Another factor, which could impede the accuracy, is the downwash wind that blows into the door during hover.
Error Rates
New cockpit designs have fixed as well as mobile touchscreens integrated. Pilots have to extend their arms towards the dashboard to interact with the aircraft systems. The study presented here confirms that without support this increases the likelihood to make more errors in a vibrating environment.
In the mobile setting the user was able to pull the device inside his “zone of convenient reach [28]”, causing the device to vibrate similarly to the human body, ‘absorbing’ a certain amount of vibration, which is not the case in the fixed condition. Results confirmed the hypotheses that participant were likely to make more errors in the fixed condition than in the mobile condition.
Independent variables were tested systematically, starting broadly at the top level and gradually going into more detail. In the first set of analysis significant difference for all variables were found. Only target sizes between 15 mm and 20 mm were not significantly different. Detailed analyses showed that there are few cases where significant difference between 15 and 20 mm exist.
In the second level of analysis, interactions between independent variables were calculated, which
showed that, two of three possible combinations have significant interaction effects.
The last level of analysis considered each possible case (24) separately and in pairwise comparisons. The provided matrix shows that the effects of placement and vibration disappear with increasing target size.
Target sizes beyond 20 mm were not tested, however helicopters are able to absorb higher vibrations. Keeping previous works in mind it is unlikely that targets bigger than 20 mm would lead to significant improvement. Therefore, it is recommended to use 20 mm targets for fixed devices for which pilots have to extend their arms to reach, and for safety critical tasks. The expected error rate for 20 mm targets during transition phase with a fixed placement (worst case) is 3 %.
Airlines are increasingly interested in the integration of portable touchscreen devices into the cockpit. In 2011, FAA has authorized use of the Apple iPad as EFB [29]. Currently, many Airlines are in the transition phase to a paperless cockpit. American Airlines (AA) was the first major commercial carrier that completed their EFB program. The software, used by AA, has the following features [30]:
Enroute charts and airport diagrams (Displays own-ship position)
Arrival, departure and approach procedures Change notifications (terminal and enroute)
As seen above, mobile devices are (currently) not used for safety critical task. Thus, 15 mm targets for mobile devices may be sufficiently large. The expected error rate for 15 mm targets during transition when the device is held rather than fixed is 3%.
As mentioned in the literature review an acceptable error rate for this application area has not been established. However, it is expected that authorities will establish guidance for acceptable error rates for different tasks (safety critical and non-safety critical tasks). If designers require a higher accuracy, it is not recommended to increase the target size beyond the recommended values. Instead, adding an additional safety layer with message box saying: “Do you want to proceed?” would make the interface more error proof (redundant).
To give another example, “shutting down engines” may be classified as a safety critical task,
accidental shutting down must be avoided. The interaction may be designed to minimise the error probability in the following way. To shut the engines off, the pilot would need to navigate to a menu item, select and touch the ‘off’ button, upon which the system would prompt the pilot to confirm if they want to shut down the engines. In total, the pilot would have to take three steps within the system to shut down the engine. If we assume all interactive elements have the recommended size, the error rate is at worst 3% per layer. Adding three layers will reduce the probability of shutting down the engines by accident to 0.0027% (0.03x0.03x0.03=0.000027). However, alternatively certain safety-critical actions may only be supported by traditional physical switches.
Future Work
The scope of this paper covered error rates, vibration analyses and usage. During the experiments additional data was recorded, which will enable further analyses. The approach differed significantly from the recommended ISO standard, however movement analyses and throughput calculations could give us a better understanding of the impact of various variables.
It was expected that there is a significant difference between the mobile and the fixed placement conditions. One question for future work is how does the distance between user and display impact the performance? The ISO standard could be used to determine optimal display position within the cockpit. As mentioned during the introduction, each application area has its own special requirements. Another effect, which could degrade the accuracy, is the G-Force that occurs during steep turns. This is another issue, which particularly fighter pilots may have to face. An initial lab trial could show whether additional G-Force has a significant effect.
Conclusion
degrading factors by selecting an appropriate target size. It was demonstrated that using touch-enabled devices that are fixed in place in vibrating environments produces significantly higher error rates than when the device can be held by the user.
References
[1] S. Dodd, J. Lancaster, A. Miranda, S. Grothe, B. DeMers and B. Rogers, “Touch screens on the flight deck: the impact of touch target size, touch technology and turbulance on pilot performance,” in Proceedings of the Human Factors and Ergonomics Society 58th Annual Meeting, Chicago, 2014.
[2] S. Bonelli and L. Napoletano, “Flying with complexity; bringing touch screens into the cockpit,” Alicia, Rom, 2013.
[3] D. Barstow, “The aviation iPad revolution,” Aviation Management Association, Springfield, 2012.
[4] American Airlines, “American airlines completes electronic flight bag
implementation,” 24 6 2013. [Online]. Available:
www.hub.aa.com/en/nr/pressrelease/american -airlines-completes-electronic-flight-bag-implementation. [Accessed 13 12 2013].
[5] Honeywell, “Honeywell brings modern touch to gulfstream cockpit,” Honeywell, 31 10 2014. [Online]. Available:
https://aerospace.honeywell.com/news/honey well-brings-modern-touch-to-gulfstream-cockpit. [Accessed 1 6 2015].
[6] Thales, “Thales unveils avionics 2020 for helicopters,” Thales, 25 02 2014. [Online]. Available:
https://www.thalesgroup.com/en/worldwide/a
erospace/press-release/thales-unveils-avionics-2020-helicopters. [Accessed 6 6 2015].
[7] Civil Aviation Authority (CAA), “CAP 708 - Aviation safety review,” TSO, West Sussex, 2008.
[8] A. Degani, E. Palmer and K. Bauersfeld, “Soft controls for hard displays: still a challenge,” in 36th Annual meeting of the human factors society, Santa Monica, 1992.
[9] S. Kaminani, “Human computer interaction issues with touch screen interfaces in the flight deck,” in Digital Avionics Systems Conference (DASC), Seattle, 2011.
[10] Apple Inc., “iOS Human Interaface Guidlines (iOS 8),” Cupertino, 2014.
[11] Google, “Android Interface Design Guidlines (Android 5.0),” 2014.
[12] Microsoft, “Touch interactions for Windows,” 2014.
[13] N. Henze, E. Rukzio and S. Boll, “100,000,000 Taps: Analyses and inprovement of touch performance in the large,” in MobileHCI, Stockholm, 2011.
[14] B. Schildbach and E. Rukzio, “Investigating selection and reading performance on a mobile phone while walking,” in HCI Mobile, Lisbon, 2010.
[15] H. A. Colle and K. J. Hiszem, “Standing at a kiosk: Effects of key size and spacing on touch screen numeric keypad performance and user preference,” Ergonomics, vol. 47, no. 13, pp. 1406-1423, 2007.
[16] B. K. Perry and J. P. Hourcade, “Evaluating one hand thumb tapping on mobile touchscreen devices,” in Graphics Interface Conference, Windsor, 2008.
[18] S. C. Lee and S. Zhai, “The perofrmance of touch screen soft buttons,” in CHI, Boston, 2009.
[19] R. Leitao and P. A. Silva, “Target and spacing sizes for smartphone user interfaces for older adults: Design patterns based on an evaluation with users,” in Conference on Pattern Languages of Programs, Arizona, 2012.
[20] M. Schedlbauer, “Effects of key size and spacing on the completion time and accuracy of input tasks on soft keypads using trackball and touch input,” in Human Factors & Ergonomics Society 51st Annual Meeting, Baltimore, 2007.
[21] S. N. Tsang, A. H. Chan and K. Chen, “A study on touch screen numeric keypads: effects of key size and key layout.,” in International MultiConference of Engineers and Computer Scientists , Hong Kong, 2013.
[22] J. Bergstrom-Lehtovirta, A. Oulasvirta and S. Brewster, “The effects of walking speed on target acquisition on a touchscreen interface,” in Proceedings of the International Conference on Human Computer Interaction with Mobile Devices and Services. ACM, 2011.
[23] Department of Defense, “Design Criteria Standard (MIL-STD-1472G),” 2012.
[24] Federal Aviaton Administrations (FAA), “Controls for flight deck systems AC(20 -175),” 2011.
[25] IAMSAR, International Aeronautical and Maritime Search and Rescue (IAMSAR) Manual, 2013.
[26] C. Vieyra and R. Vieyra, “Physics Toolbox Apps,” Vieyra Software, 1 1 2015. [Online]. Available: http://www.vieyrasoftware.net/. [Accessed 17 6 2015].
[27] International Standard Organisation, “ISO 9241-9 Ergonomic requirements for office work with visual display terminals,” ISO, 2007.
[28] S. Pheasant, Bodyspace - anthropometry, ergonomics and the design of the work, 2nd ed., London: Taylor & Francis, 1996.
[29] K. Murphy, “The Paperless Cockpit,” The New York Times, p. B6, 4 7 2011.
[30] C. Pschierer, T. Thompson, R. Ellerbrock and S. Haffner, “From Captain Jeppesen's little black book to the iPad and beyond,” in Digital Avionics Systems Conference (DASC), IEEE/AIAA 31st, Williamsburg, 2012.
Acknowledgments
I would like to thank the Spanish Maritime Safety Agency and INAER for opening their facilities. Especially, Nestor Perales Gomez who organized my visits, flights and approved required permissions. I would like to thank GE Aviation Systems Ltd., which is the industrial partner of my EPSRC ICase (EP/K504506/1) PhD Program.
Email Addresses
Huseyin Avsar - [email protected]