Revised manuscript. July 9, 2015
Anharmonic phonon decay in cubic GaN
R. Cuscó and N. Domènech-Amador
Institut Jaume Almera (ICTJA–CSIC), Consejo Superior
de Investigaciones Científicas, 08028 Barcelona
S. Novikov and C. T. Foxon
School of Physics and Astronomy, University of Nottingham, Nottingham NG7 2RD, UK
L. Artús
Institut Jaume Almera (ICTJA–CSIC), Consejo Superior
de Investigaciones Científicas, 0028 Barcelona
Abstract
We present a Raman scattering study of optical phonons in zincblende (cubic) GaN for temperatures
ranging from 80 to 750 K. The experiments were performed on high quality, cubic GaN films grown by
molecular beam epitaxy on GaAs (001) substrates. The observed temperature dependence of the optical
phonon frequencies and linewidths is analyzed in the framework of anharmonic decay theory, and
pos-sible decay channels are discussed in the light of density-functional theory calculations. The LO mode
relaxation is found to occur via asymmetric decay into acoustic phonons, with an appreciable
contribu-tion of higher order processes. The TO mode linewidth shows a weak temperature dependence and its
frequency downshift is primarily determined by the lattice thermal expansion. The LO phonon lifetime
is derived from the observed Raman linewidth and an excellent agreement with previous theoretical
predictions is found.
I. INTRODUCTION
The group-III nitride semiconductors with the zincblende structure are attracting much interest as promising candidates to overcome the built-in piezoelectric fields and sponta-neous polarization effects that limit the efficiency of light emitting devices based on wurtzite heterostructures with (0001) orientation.1,2 Because of their symmetry, cubic III-nitride het-erostructures grown in a (001) direction are not affected by quantum confined Stark effect. The absence of built-in fields is expected to yield a superior stability of the emission wavelength with increasing current and to increase the radiative efficiency in the well. The zincblende polytype of GaN, with a bandgap 0.2 eV lower than that of the wurtzite phase3and higher hole mobility,4is being considered as an alternative to the growth along non-polar axes of wurtzite to address the droop problem in green light-emitting diodes.2The lower bandgap of the cubic form requires less In alloying to reach the green emission region, and, because of the absence of polarization fields, wider wells can be used where the carrier density is lower and hence the Auger non-radiative recombination rate5is reduced.
nonra-diative Auger processes. As already mentioned, these processes may severely limit the internal quantum efficiency of InGaN laser diodes at high drive currents.5
A general theoretical overview of optical phonon anharmonic decay is given in Ref. 8 for a range of cubic and hexagonal semiconductors. The analysis is based on the Debye model for acoustic branches, and assumes linearly dispersive optical branches. It is clear from this analy-sis that, due to the large phonon gap in GaN, the relaxation of optical modes proceeds through the Ridley channel (asymmetric decay into one optical and one acoustic mode).9The predic-tion of phonon lifetimes for c-GaN based on this model could not be compared with measure-ments because of the lack of experimental data. Phonon lifetimes and decay channels can be studied by means of temperature-dependent Raman-scattering experiments.10Raman scatter-ing studies of the decay of zone-center phonons have been carried out on several wurtzite-type semiconductors11–13and, more specifically, studies of wurtzite-type GaN have been extensively reported.14–18The analysis of the temperature dependence of the phonon linewidths is gener-ally carried out by fitting a simplified theory of anharmonic decay in which, to the lowest order, the frequency shift and the broadening of the phonon line shapes is proportional to the sum of Bose-Einstein factors associated with the phonon decay products. In some cases,14,16the data is modeled using the simple Klemens channel (symmetric decay into acoustic phonons of the same energy),19which is clearly inconsistent with the large phonon gap in GaN.
In a previous work,13we analyzed the anharmonic decay of the optical phonons in InN using the full Cowley’s model,20 in which the anharmonic renormalization of the phonon frequen-cies and lifetimes is evaluated from the complex phonon self-energy. The phonon linewidth is given by the imaginary part of the self-energy, which is proportional to the two-phonon den-sity of states (2PDOS), whereas the real part of the self-energy yields the anharmonic frequency shift. Therefore, linewidth and frequency shift are not separate magnitudes that can be fitted by independent parameters but they are connected through the Kramers-Krönig relations.
tem-perature dependence of the Raman spectra. Similarly to theE2highmode of the wurtzite phase,18
the TO mode of the c-GaN exhibits a weak temperature dependence and its frequency down-shift is mainly governed by the lattice expansion.
II. EXPERIMENT
A 600-nm thick c-GaN layer with the zincblende structure was grown on a semi-insulating (001) GaAs substrate by plasma-assisted molecular beam epitaxy (PA-MBE) in a MOD-GENII system using As2as a surfactant to initiate the growth of the cubic phase material. To improve
the quality of the c-GaN layer, a GaAs buffer layer was grown on the GaAs substrate. Zincblende GaN layers were grown at temperatures∼680◦C under Ga rich PA-MBE conditions. The growth
of the metastable polytype of GaN was initiated by epitaxy on cubic (001) GaAs substrates and by supplying an additional As2flux.21
The Raman scattering experiments were carried out in backscattering configuration from a (001) face. The Raman spectra were excited with the 532-nm line of a diode-pumped Nd:YAG solid-state laser. The scattered light was analyzed using a Jobin-Yvon T64000 triple spectrome-ter equipped with a LN2-cooled charge coupled device (CCD) detector. Raman spectra were
ob-tained in the subtractive configuration of the spectrometer with 100µm slits, corresponding to a spectral slitwidth of∼2.2 cm−1. The intrinsic phonon linewidths were obtained from the full
width at half maximum (FWHM) of the Raman peaks using the Voigt profile approximation.13
The sample temperature was varied between 80 and 390 K using a LN2 cryostat. In this
500 550
In
te
n
si
ty
(a
rb
.
u
n
it
s)
Raman shift (cm−1) 120 K
300 K 670 K
[image:5.595.199.420.67.395.2]700 750
FIG. 1. Raman spectra (filled circles) of the c-GaN layer in the TO and LO frequency ranges obtained at
three different temperatures. The solid lines are Lorentzian line-shape fits to separate the contributions
of second-order bands and the residualEhigh2 mode of wurtzite-GaN inclusions.
III. RAMAN SPECTRA OF c-GaN
Figure 1 shows thez(x y) ¯zRaman spectra of c-GaN recorded at three different temperatures. The spectra are dominated by the symmetry allowed LO mode. The LO frequency decreases from 740 cm−1at 120 K to 725 cm−1at 670 K. A weak shoulder can be seen on the low energy
in-tensity decrease of the low energy mode relative to the LO mode as the temperature is lowered is well described by the phonon occupation ratio [1+n(TA(L))][1+n(TO(L))]/[1+n(LO(Γ))],
wheren(ω) is the Bose-Einstein occupation factor for the modeω, which supports the assign-ment of this feature to a second order TA(L)+TO(L) combination mode.
Although the TO mode is symmetry forbidden in backscattering from a (001) face, a weak Raman signal from the TO mode appears in the spectra. Since the c-GaN layer is transparent for the excitation laser beam, a measurable TO signal arises from the forward scattering compo-nent induced by the laser beam that is reflected at the GaN/substrate interface.23As can be seen in Fig. 1, the Raman spectra around the TO phonon frequency of c-GaN contains the contribu-tions of several Raman bands. Their relative contribucontribu-tions are illustrated by the Lorentzian line shape fits displayed as continuous lines in Fig. 1. In addition to the dominant TO peak (green line), a weak narrow peak can be observed on its high energy side. The frequency of this fea-ture corresponds to theE2highfrequency of the hexagonal GaN and indicates the presence of a very small amount of hexagonal inclusions in the c-GaN layer. A broad band is also observed at about 12 cm−1below the TO frequency (orange line). Since the relative intensity of this band
decreases as the temperature is lowered, we attribute it to second-order scattering. Consistent with the observation of this band, ourab-initiocalculations reveal a maximum of the 2PDOS at
∼15 cm−1below the TO frequency that is associated with TA(X)+LA(X) combination modes.
IV. RESULTS AND DISCUSSION
A. Lattice dynamics:ab-initiocalculations
The accurate modeling of anharmonic decay processes requires a good knowledge of the lat-tice dynamics. In this section we presentab-initiocalculations based on perturbation density-functional theory (PDFT) that give access to the phonon dispersion, phonon density of states (PDOS) and material parameters such as the bulk modulus and the mode Grüneisen param-eter. These results will be key elements for the detailed analysis of the anharmonic phonon decay presented in Sec. IV B
Frequency (cm -1) 0 100 200 300 400 500 600 700
Γ X Γ L X W L
PDOS TA(L) TA(X) TA(W ) LA(W ) LA(L), LA(X) TO(Γ) TO(L)
TO(X) TO(W ) LO(Γ) LO(L)LO(X)
0 0.05 0.1 0.15
0 200 400 600 800 1000 1200 1400
P D O S (s ta te s / c m − 1)
[image:7.595.136.478.77.369.2]ω(cm−1)
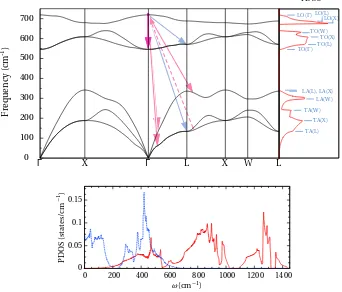
FIG. 2. Upper panel: phonon dispersion and phonon density of states in c-GaN as obtained from DFT
calculations. The arrows indicate the main decay channels for the zone-center LO mode discussed in
the text. Blue arrows indicate the three-phonon decay process considered and magenta arrows indicate
two possible four-phonon decay processes. Lower panel: two-phonon sum (solid line) and difference
(dotted line) density of states.
performed using a 6×6×6 Monkhorst-Pack grid with an energy cutoff of 80 Ha. A full structural relaxation of the c-GaN lattice yields a lattice parameter ofa=4.499 Å, in good agreement with the valuea=4.501 Å reported from x-ray measurements in bulk freestanding c-GaN.21The lat-tice parameter of c-GaN is substantially smaller than that of the GaAs substrate (5.65 Å). How-ever, due to the occurrence of a coincidence-lattice mismatch (paGaAs−q aGaN)/paGaAswhich is negligible forp=4,q=5, the large misfit between lattice parameters can be accommodated by an array of pure edge dislocations with a period of 5 GaN lattice planes and thus the resid-ual lattice misfit in the heterostructure is drastically reduced.25 Therefore, in agreement with previous studies,26we assume that there is no built-in strain in the c-GaN layers.
TABLE I. Phonon frequencies at the principal high symmetry points as obtained by DFT calculations.
Symmetry point Phonon frequency (cm
−1)
TO LO TA LA
Γ 545.9 719.1 0.0 0.0
X 609.0 679.9 188.3 341.4
L 570.8 688.3 133.9 335.9
W
620.1
673.4 206.2 297.1
630.5 240.1
mode Grüneisen parameters of c-GaN,γ=(B/ω)(∂ω/∂P), whereB = −V(∂V/∂P)−1is the bulk
modulus. From the DFT calculations, we obtainB =195.4, andγLO=1.455 andγTO=1.222. These values are in excellent agreement with the experimental values reported by Goñiet al.26
For the calculation of phonon frequencies, the dynamical matrix was obtained on a mesh ofk-points using the perturbation theory linear-response approach,27which allows the
inter-polation to arbitrary wave vectors for the calculation of phonon dispersion and PDOS. Figure 2 shows the phonon dispersion of c-GaN along the principal symmetry directions and the corre-sponding PDOS. Due to the large difference in the masses of Ga and N atoms, there is a large gap of ∼200 cm−1 between the optical branches, which pertain to predominantly
nitrogen-like vibrations, and the acoustical branches, which consist of mainly gallium-nitrogen-like vibrations. The PDOS exhibits maxima that correspond to van Hove singularities in the phonon disper-sion. These are labeled in the PDOS plot displayed in Fig. 2 and will be used to identify the most likely decay channels for the optical modes of c-GaN. It should be noted that because of the limitations of the LDA calculations (underestimation of the bandgap and overestimation of the dielectric constant) the calculated LO frequency (719.1 cm−1) is 22 cm−1lower than the
experimental value measured at 80 K. This discrepancy stems from the overestimation of the dielectric constant by the DFT calculations, which yield a value ofε∞=6.078, noticeably higher
than the reported experimental valueεexp∞ =5.31.3Since the LO–TO splitting is given by
ω2LO−ω2TO= 4πZ
∗2
V0µε∞
, (1)
whereZ∗is the effective Born charge,V0is the unit cell volume, andµis the reduced mass, the
for this effect by evaluating Eq. (1) usingεexp∞ . Then we obtainωLO=740.8 cm−1, which is quite
close the LO frequency we measured at 80 K. Accordingly, the analysis of the anharmonic decay channels and the corresponding shift and broadening of the Raman peaks will be performed using consistently the results of the DFT calculations, bearing in mind that the comparison with the experimental frequencies will be effected by means of a rigid shift of the temperature-dependent frequency curves. The phonon frequencies obtained from DFT calculations at the principal high symmetry points are summarized in Table I.
In Fig. 2 (lower panel) we display the 2PDOS corresponding to the sum and phonon dif-ferences that will be used in Sec. IV B to evaluate the effects of decay into combinations of two zone-edge phonons in Cowley’s anharmonicity model. The 2PDOS for sums is about four times higher around the LO frequency than around the TO frequency, whereas the 2PDOS for differ-ences is vanishing around the LO frequency. The 2PDOS for sums exhibits steep slopes at the TO and LO frequencies which, as we discuss in Sec. IV B, introduce a frequency dependence in the anharmonicity corrections that must be taken into account in the line-shape modeling.
B. Theoretical model for anharmonic decay
The anharmonic coupling between the eigenstates of the harmonic lattice Hamiltonian (barephonons) leading to a finite lifetime and frequency renormalization of the phonons was described in the perturbation theory framework by Cowley.20Cowley’s theory was successfully applied to analyze phonon decay in several temperature-dependent Raman scattering studies of Si, Ge, and α-Sn,10 InN,13 and has revealed subtle effects in the temperature behavior of Raman scattering of compound semiconductors as AlAs28and ZnO.12,29
The anharmonic theory has been discussed at length in the literature.10,20,30We present here just an overview of the most relevant points that will be used later in the analysis of our data. To the lowest order in perturbation theory, the imaginary part of the phonon self-energy can be written as
Γ(ω)= |V3+|2[1+n(ω+1)+n(ω+2)]ρ+(ω)+ |V3−|2[n(ω−2)−n(ω−1)]ρ−(ω), (2)
conserved in the phonon decay process. The effective cubic anharmonic potentials are related to the third-order derivatives of the total energy and to the harmonic frequencies and eigen-vectors. All these quantities can be evaluated using PDFT by computing the linear response to atomic displacements from the equilibrium position. Indeed, fullab initiocalculations of phonon linewidths were reported on III-V semiconductors.31 These PDFT calculations deal only with the third-order derivatives of the total energy as obtained from the 2n+1 theorem (lowest-order anharmonicity correction). Furthermore, for the LO modes the contribution to the anharmonic dynamical tensor due to the electron density response to an electric field and the corresponding nonanalytic wave-function response are neglected. While a good agreement with experimental data is generally found at low temperatures, significant deviations may oc-cur at higher temperatures because of the increasing importance of higher-order corrections. In view of the computational complexity of the fullab initioapproach and its intrinsic limita-tions, to analyze our temperature-dependent data we have adopted a semi-empirical approach similar to that used by Serranoet al.,29in which the effective anharmonic potentials are consid-ered as adjustable parameters while PDFT is employed to obtain the phonon frequencies and density of states.
Higher order terms (quartic anharmonicity) involving four-phonon processes were ana-lyzed by Balkanski et al.30 and found to be relevant to explain the superlinear temperature dependence of the optical phonon broadening in Si, particularly at higher temperatures. Al-though temperature dependence fits based on the occupation factors indicate the importance of higher order terms in many cases,11,15,16,18the general expressions for the higher order terms are however difficult to evaluate and therefore it is not trivial to extend Cowley’s theory to higher order. In our previous anharmonicity study on InN,13we restricted ourselves to the higher or-der decay channels involving the decay into a zone-center phonon (ω1) and a pair of opposite wave-vector phonons at zone-edge (ω2,ω3) in an attempt to take into account higher
anhar-monic terms in Cowley’s formalism. Under these constraints, the quartic anharanhar-monicity con-tribution reduces to13
Γ(4)(ω)∝ |V˜4+|2{[n(ω+1)+1][n(ω+2)+1][n(ω+3)+1]
−n(ω+1)n(ω+2)n(ω+3)}ρ+(ω−ω+1)
+|V˜4−|2{[n(ω−1)+1][n(ω−2)+1]n(ω−3)
where ˜V4+, ˜V4−areeffectiveanharmonic potentials to be considered as empirical adjustable pa-rameters. Once the 2PDOS is known and the main decay channels have been identified, Eqs. (2) and (3) allow us to evaluate the phonon line-width broadening (imaginary part of the phonon self-energy). Since the real and imaginary parts of the phonon self-energy are related by the Kramers-Krönig relations, the anharmonic frequency shift is obtained as
∆(ω)= −2
πP
Z∞
0
ω′
ω′2−ω2Γ(ω ′)
dω′. (4)
In addition to the anharmonic shift, the actual temperature dependence of the phonon fre-quency contains also an important contribution from the thermal expansion of the lattice, which can be estimated from the linear thermal expansion coefficient α(T) and the mode Grüneisen parameterγas
ω(T)=ω(80 K)−3ω0γ
ZT
80 α(T ′
)d T′, (5)
For the linear thermal expansion of c-GaN, we considerα≈ 13(2αa+αc), whereαa andαc are
the linear thermal expansion coefficients of hexagonal GaN reported by Roderet al.32Given the similar thermal expansion of GaN and GaAs (the respective thermal expansion coefficients dif-fer by less than∼20% at the growth temperature)32,33and the stress relaxation at the GaN/GaAs interface we neglect the effects of differential thermal expansion, although a small residual compressive strain might be present in the c-GaN layer.
To obtain the phonon frequency and FWHM curves vs. T the Raman line shape is calcu-lated taking into account the self-energy corrections10,13 and the peak frequency and FWHM are determined for each temperature. The temperature dependence of the phonon line width can then be fitted to the Raman data to obtain the anharmonic potentialsV3+,V3−, ˜V4+, and ˜V4−. These potentials determine not only the broadening of the phonon line, but also the anhar-monic frequency shift which is given by the real part of the phonon self-energy.
C. Phonon decay of the LO mode
6 8 10 12 14 16 18
ΓL
O
(c
m
−
1 )
(a)
720 724 728 732 736 740
100 200 300 400 500 600 700 800
ω
L
O
(c
m
−
1 )
T (K) (b)
FIG. 3. (a) Temperature dependence of the LO phonon line width (filled circles). The solid line is a fit
of the anharmonicity model including three- and four-phonon processes. The dashed line has been
ob-tained by considering only the three-phonon processes. (b) Temperature dependence of the LO phonon
frequency (filled circles). The frequency shift due to the thermal lattice expansion is indicated by the
dashed line. The calculated temperature dependence taking into account both the thermal expansion
and the anharmonic renormalization of the phonon frequency is plotted as a solid line.
of temperature. Error bars have been set according to the frequency separation between con-secutive pixels in the CCD detector. The experimental data show a superlinear increase of the FWHM as temperature is increased which cannot be accounted for solely by the above asym-metric Ridley channel. In this case, the lower energy phonon decay product [TA(L)] has an energy lower thankBT for most of the temperature range and therefore its occupation factor
dominates and yields a nearly linear temperature dependence. This behavior is illustrated by the dashed line in Fig. 3(a), which depicts the temperature dependence of the FWHM taking into account only the Ridley channel and the background contributionΓ0. Therefore, further
[image:12.595.187.421.71.364.2]we consider four-phonon processes involving the decay into the zone-center TO phonon and sums or differences of acoustic phonons. Two such processes verifying energy conservation can be readily identified by inspection of the phonon dispersion, and they are depicted by ma-genta arrows in Fig. 2. First, a process leading to the asymmetric creation of acoustic modes: LO(Γ)→TO(Γ)+LA(Γ−L)+TA(Γ−L), where the frequencies of the TA and LA modes are∼58 and∼116 cm−1, respectively. An analogous decay channel involving the TA and LA acoustic
branches for points along theΓ–X line also exists. Second, a process involving upconversion of TA modes (indicated by the dashed arrow in Fig. 2): LO(Γ)→TO(Γ)+LA( ˆL)−TA( ˆL), where
ˆ
L denotes points close to theL point along theL–X (orL–W) lines that verify energy conser-vation. Taking into account these decay channels, Eqs. (2) and (3) of the anharmonicity model have been fitted to the experimental data using the anharmonicity potentials as fitting param-eters. An additive contributionΓ0has been included to account for scattering with defects and
impurities. A good fit to the data, plotted as a solid line in Fig. 3(a), is obtained for|V3+|2=10 cm−2, |V˜
4+|2=17 cm−2,|V˜4−|2=22 cm−2, andΓ0=6.3 cm−1. The background contribution Γ0 is significantly larger than the values typically obtained for InN (Ref. 13) or wurtzite-GaN
(Ref. 15 and 18). Depending on the sample quality and the range of temperatures fitted, widely varying results for theΓ0value were found for the A1(LO) mode of wurtzite-GaN. A study of a
2.2µm thick metalorganic vapor phase epitaxy sample in the temperature range of 85 to 760 K yielded a background linewidth contribution ofΓ0=2.3 cm−1,15whereas later studies
per-formed on high quality hydride vapor epitaxy layers with thickness∼80µm in the temperature range of 20 to 235 K foundΓ0=0.9 cm−1.18Much higher values for the background linewidth
contribution (Γ0=5.7 cm−1) were reported for AlN.15The growth of the zinc-blende metastable
polytype of GaN is challenging and the resulting material usually contains a significant density of stacking faults and wurtzite-type inclusions. The presence of a higher density of defects in the c-GaN layers limits the phonon coherence length and results in subtantially broadened phonon line shapes. Such a broadening depends on the sample quality and noticeable varia-tions were found in preliminary measurements performed on several c-GaN samples obtained in different MBE runs. The sample with the smallestA1(LO) FWHM was selected to perform
the temperature dependent measurements presented in this work.
As can be seen in Fig. 3 (b), the LO phonon exhibits a frequency downshift of 19 cm−1when
2 4 6 8 10 12
ΓT
O
(c
m
−
1 )
(a)
545 550 555
100 200 300 400 500 600 700 800
ω
T
O
(c
m
−
1 )
T (K)
(b)
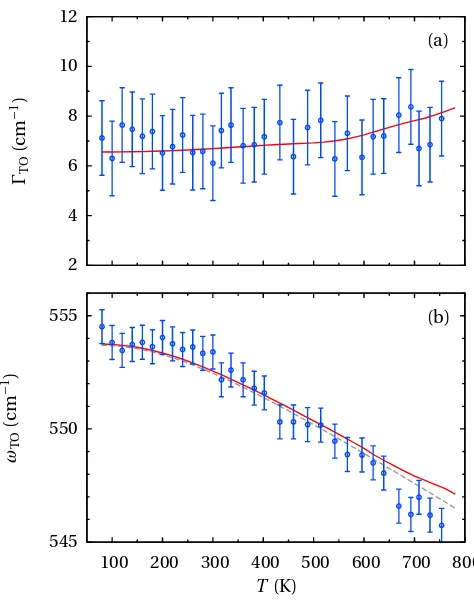
FIG. 4. (a) Temperature dependence of the TO phonon line width (filled circles). The solid line is a fit
of the anharmonicity model taking into account the asymmetric decay channel into acoustic phonons
of the LA and upper TA branches aroundW. (b) Temperature dependence of the TO phonon frequency
(filled circles). The frequency shft predicted by the model calculations (solid line) is basically accounted
for by the thermal lattice expansion, indicated by the dashed line.
[image:14.595.185.422.68.368.2]D. Phonon decay of the TO mode
As already discussed in Sec. III, a sizable signal from the TO mode is also observed in the backscattering measurements on the (001) oriented c-GaN layers. However, since it overlaps second-order bands and the residualE2highsignal from wurtzite inclusions, an accurate deter-mination of the TO line-shape parameters is difficult. As shown in Fig. 1, a four-Lorentzian line-shape fit was performed in the TO spectral region to extract the peak frequency and the FWHM of the TO Raman peak. The results are plotted in Fig. 4, where larger error bars have been included to account for the uncertainties introduced by the fitting procedure. The FWHM data shows some scatter around 7 cm−1but there is no clear trend with increasing temperature,
which suggests that anharmonic renormalization effects are notably weak for this mode. This is confirmed by the relatively small downshift of the TO frequency over the tempeature range studied, which, as can be seen in Fig. 4(b), can be entirely accounted for by the thermal expan-sion contribution (dashed line).
According to the phonon dispersion of c-GaN (see Fig. 2), the most likely channel for TO phonon decay is the asymmetric decay into two acoustic phonons: TO(Γ)→LA(W)+TA+(
W), where TA+(W) stands for the upper transverse acoustic branch at
W. A fit to the FWHM Ra-man data, displayed as a solid line in Fig. 4(a), yields|V3+|2=6 cm−2andΓ
0=6.5 cm−1. The
background contributionΓ0agrees well with the value obtained for the LO model. A very weak
temperature dependence was also reported for theE2high mode in wurtzite GaN,18 which cor-responds to the zone-folded TO(L) mode of the zincblende phase, and it was attributed to a higher-order decay mechanism. In contrast, a three-phonon decay channel exists for the TO mode of c-GaN. Then, the weak temperature dependence of the TO mode of c-GaN is explained instead by the combined effect of a relatively weak anharmonic coupling potential, the fact that as can be seen in Fig. 2(b) the 2PDOS is very low around the TO frequency, and the unavailabil-ity of relevant higher-order decay channels.
E. LO phonon lifetime
0 1 2 3 4 5
0 100 200 300 400 500 600 700 800
τA
(p
s)
[image:16.595.185.427.67.232.2]T(K)
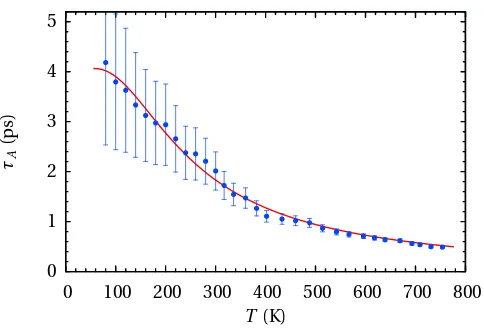
FIG. 5. LO phonon lifetimes at 80 K and room temperature as determined from the linewidth analysis of
the Raman spectra. The solid line is a guide to the eye obtained from the occupation factors in Eqs. (2)
and (3).
spectroscopy. The phonon lifetime is related to the Raman linewidth through the energy-time uncertainty relationτ−1=Γ/ħ, where ħ =5.309×10⁻¹² cm−1s is Plank’s constant. The finite
phonon linewidth measured in Raman experiments is determined both by the anharmonic decay into other phonons with a characteristic timeτAand by the perturbation of the
transla-tional symmetry of the lattice due to defects and impurities. The latter yields a temperature-independent background contributionΓ0 to the Raman FWHM that was determined in the
model fits to the temperature-dependent FWHM data. If we associate a characteristic time
τB = ħ/Γ0to this broadening mechanism, we may separate the anharmonic and background
contributions to the phonon lifetime as
1
τ=
1
τA
+ 1
τB
. (6)
The relaxation timeτAdescribes the intrinsic phonon-lifetime limiting processes arising from
anharmonic phonon decay and is therefore characteristic of the material and determined by its lattice dynamics. In contrast, the relaxation timeτBdescribes phonon dephasing due to
anharmonic decay time shows a sizable increase at lower temperatures, where a substantial fraction of the Raman linewidth is given by the background termΓ0. Given the small value of
the anharmonic component of the FWHM, the error bars onτAare increasingly large at lower
temperatures. However, the central values show a regular trend that follows closely the solid line calculated by using the occupation factors appearing in Eqs. (2) and (3). This fact leads us to think that the anharmonic lifetime values determined from the Raman measurements are fairly accurate even at lower temperatures. We obtain 4.2 and 2.0 ps at low temperature and room temperature, respectively. These values are in excellent agreement with the values theo-retically predicted by Barman and Srivastava.8The room-temperature LO phonon lifetime we find for c-GaN is higher than the values around 0.9 ps reported for theA1(LO) mode of wurtzite GaN.18,34 The values of the anharmonic lifetimes are relevant for the buildup of a nonther-mal phonon population and therefore for determining the hot-carrier relaxation dynamics by electron-phonon interaction. Given the relatively high values of anharmonic phonon lifetimes in c-GaN, hot-phonon effects may be expected to be significant in this material.
V. SUMMARY AND CONCLUSIONS
In this work we have carried out Raman scattering measurements on zincblende GaN over a temperature range from 80 to 750 K. Anharmonic phonon decay modeling of the Raman line shapes has been performed by evaluating the complex phonon self-energy taking into account the phonon dispersion and phonon density of states obtained from DFT calculations. The most likely decay channels have been identified from the phonon dispersion and PDOS obtained from the calculations.
The LO phonon FWHM displays a superlinear temperature dependence that can only be ex-plained by considering higher order processes in addition to the Ridley channel LO→TO(L)+
TA(L). With the aid of the calculated phonon dispersion, several four-phonon decay channels have been identified. The contribution of these higher order processes is found to be more im-portant than for the case of the wurtzite GaN. The LO frequency downshift with temperature is well accounted for by the combined effect of the thermal lattice expansion and the anhar-monic renormalization of the phonon frequency. The TO mode, for which a three-phonon de-cay channel TO(Γ)→LA(W)+TA+(W) exists, displays a weak temperature dependence and its
a small anharmonic coupling for this mode.
The LO phonon lifetime has been evaluated from the temperature dependent FWHM data, and it has been found to be in excellent agreement with previous theoretical estimations. The characteristic phonon decay rate in the c-GaN layers studied contains a substantial background contribution arising from scattering by lattice defects which is significantly higher than for the wurtzite GaN. However, the anharmonic phonon decay rate is lower than in wurtzite GaN.
ACKNOWLEDGMENTS
N. D. acknowledges financial support from the FPU program of the Spanish Ministry of Ed-ucation.
1 S. Li, J. Schörmann, D. J. As, and K. Lischka, Appl. Phys. Lett.90, 071903 (2007).
2 C. J. M. Stark, T. Detchprohm, S. C. Lee, Y.-B. Jiang, S. R. J. Brueck, and C. Wetzel, Appl. Phys. Lett.103,
232107 (2013).
3 M. Feneberg, M. Röppischer, C. Cobet, N. Esser, J. Schörmann, T. Schupp, D. J. As, F. Hörich, J. Bläsing,
A. Krost, et al., Phys. Rev. B85, 155207 (2012).
4 D. J. As, D. Schikora, A. Greiner, M. Löbbers, J. Mimkes, and K. Lischka, Phys. Rev. B54, R11118 (1996).
5 K. T. Delaney, P. Rinke, and C. G. Van de Walle, Appl. Phys. Lett.94, 191109 (2009).
6 S. Hess, R. Taylor, E. O’Sullivan, J. Ryan, N. Cain, V. Roberts, and J. Roberts, Phys. Status Solidi B216,
51 (1999).
7 A. A. Balandin and D. L. Nika, Mater. Today15, 266 (2012).
8 S. Barman and G. P. Srivastava, Phys. Rev. B69, 235208 (2004).
9 B. K. Ridley, J. Phys. Condens. Matter8, L511 (1996).
10 J. Menéndez and M. Cardona, Phys. Rev. B29, 2051 (1984).
11 J. W. Pomeroy, M. Kuball, H. Lu, W. J. Schaff, X. Wang, and A. Yoshikawa, Appl. Phys. Lett.86, 223501
(2005).
12 R. Cuscó, E. Alarcón-Lladó, J. Ibáñez, L. Artús, J. Jiménez, B. Wang, and M. J. Callahan, Phys. Rev. B
13 N. Domènech-Amador, R. Cuscó, L. Artús, T. Yamaguchi, and Y. Nanishi, Phys. Rev. B83, 245203
(2011).
14 M. S. Liu, L. A. Bursill, S. Prawer, K. W. Nugent, Y. Z. Tong, and G. Y. Zhang, Appl. Phys. Lett.74, 3125
(1999).
15 A. Link, K. Bitzer, W. Limmer, R. Sauer, C. Kirchner, V. Schwegler, M. Kamp, D. G. Ebling, and K. W.
Benz, J. Appl. Phys.86, 6256 (1999).
16 W. S. Li, Z. X. Shen, Z. C. Feng, and S. J. Chua, J. Appl. Phys.87, 3332 (2000).
17 X.-B. Chen, J. Huso, J. L. Morrison, L. Bergman, and A. P. Purdy, J. Appl. Phys.98, 026106 (2005).
18 D. Y. Song, S. A. Nikishin, M. Holtz, V. Soukhoveev, A. Usikov, and V. Dmitriev, J. Appl. Phys.101,
053535 (2007).
19 P. G. Klemens, Phys. Rev.148, 845 (1966).
20 R. A. Cowley, Rep. Prog. Phys31, 123 (1968).
21 S. V. Novikov, N. Zainal, A. V. Akimov, C. R. Staddon, A. J. Kent, and C. T. Foxon, J. Vac. Sci. Technol. B
28, C3B1 (2010).
22 G. Mirjalili, T. Parker, S. Farjami Shayesteh, M. Bülbül, S. Smith, T. Cheng, and C. Foxon, Phys. Rev. B
57, 4656 (1998).
23 H. Siegle, L. Eckey, A. Hoffmann, C. Thomsen, B. Meyer, D. Schikora, M. Hankeln, and K. Lischka,
Solid State Comm.96, 943 (1995).
24 ABINIT is a common project of the Université Catholique de Louvain, Corning Incorporated, and
other contributors (http://www.abinit.org). X. Gonze, J.-M. Beuken, R. Caracas, F. Detraux, M. Fuchs,
G.-M. Rignanese, L. Sindic, M. Verstraete, G. Zerah, F. Jollet, et al., Comput. Mater. Sci.25, 478 (2002).
25 M. A. Herman, W. Richter, and H. Sitter,Epitaxy: Physical Principles and Technical Implementation.
Springer Series on Materials Science(Springer-Verlag Berlin-Heidelberg, 2004).
26 A. Goñi, H. Siegle, K. Syassen, C. Thomsen, and J.-M. Wagner, Phys. Rev. B64, 035205 (2001).
27 X. Gonze and C. Lee, Phys. Rev. B55, 10355 (1997).
28 M. Canonico, C. Poweleit, J. Menéndez, A. Debernardi, S. R. Johnson, and Y.-H. Zhang, Phys. Rev. Lett.
88(2002).
29 J. Serrano, F. J. Manjón, A. H. Romero, F. Widulle, R. Lauck, and M. Cardona, Phys. Rev. Lett.90(2003).
30 M. Balkanski, R. F. Wallis, and E. Haro, Phys. Rev. B28, 1928 (1983).
31 A. Debernardi, Phys. Rev. B57, 12847 (1998).
33 J. S. Blakemore, J. Appl. Phys.53, R123 (1982).