1
Quantification of aluminium induced changes in wheat root architecture by X-ray
1
micro-computed tomography
2
Boris Lazarevića, Craig J. Sturrockb, Milan Poljaka, and Sacha J. Mooneyb 3
aDepartment of Plant Nutrition, Faculty of Agriculture, University of Zagreb, Svetošimunska 4
cesta 25, 10000 Zagreb, Republic of Croatia;
5
bSchool of Biosciences, The University of Nottingham, Sutton Bonington, Leicestershire 6
LE12 5RD U.K.
7
Key words: Root system architecture, Aluminium toxicity, Triticum aestivum L., x-ray Micro
8
Computed Tomography
9
×
10
11
12
13
14
15
16
17
18
19
20
21
22
23
24
2
Abstract
26
Root architectural traits are of fundamental importance for plant performance especially under
27
unfavourable soil conditions. This study examined the effect of aluminium (Al) toxicity in
28
different growing media (nutrient solutions and soil) on root architecture of two wheat
29
(Triticum aestivum L.) cultivars with different Al tolerances.
30
Seedlings were grown in acid and limed soil and in two contrasting nutrient solutions. Root
31
systems of soil grown plants were scanned using x-ray Micro Computed Tomography (µCT)
32
while that of nutrient solution grown plants were assesses using WinRhizo, 3 and 5 days after
33
planting (DAP), respectively.
34
Al caused significant reduction of all examined root traits (number of seminal roots; root
35
length; length of the longest seminal root; root surface area; and root volume). Growth in acid
36
soil caused significant reduction in root length, length of the longest seminal root and root
37
surface area at 5 DAP. Soil grown plants produced larger root system compared to plants
38
grown in nutrient solutions. Al toxicity induced differences of root traits were also found
39
between different nutrient solutions.
40
Beside the well-known reduction of root length, Al toxicity had a profound effect on other
41
root architectural traits. x-ray µCT has revealed root architectural changes under specific
42
conditions of acid, Al toxic soil. Differences obtained in Al induced effects on root
43
architecture between different nutrient solutions as well as between different growing systems
44
emphasize the need for further study of root architecture especially under specific conditions
45
of Al toxicity in acid soils.
46
47
Introduction
48
Aluminium (Al) is a major limiting factor of crop productivity in acid soils (Kochian
49
1995). Acid (pH <5.5) soils exhibiting Al toxicity comprise up to 30% – 40% of the world's
3
arable land, and it is estimated that over 50% of world’s potentially arable land is acidic (von
51
Uexküll and Mutert 1995). Solubilisation of Al oxides and hydroxides is enhanced by low pH,
52
and the predominant form of Al in the acid soils (pH <5.0) is Al3+ (Delhaize and Ryan 1995).
53
The most easily recognized symptom of Al3+ toxicity is the inhibition of root growth 54
(Delhaize and Ryan 1995). Therefore, measurement of the root growth in solution culture
55
assays has been used for screening Al tolerant genotypes (Samac and Tesfaye 2003).
56
Nevertheless, in only a few cases has Al tolerance observed in solution cultures been
57
correlated with Al tolerance in acid soils (Samac and Tesfaye 2003). Discrepancies in
58
genotype rankings regarding Al tolerance have been attributed to different factors which
59
affect effective Al concentration in nutrient solutions, and in addition can reduce repeatability
60
of the results. Typically researchers used simple nutrient solutions with low ionic strength and
61
wide range of Al concentrations. However, Gregory and Hinsinger (1999) highlighted that
62
research on roots needs to involve complex growth medium such as soil, opposed to
63
commonly used hydroponics, gels and sand culture. Furthermore, most research performed in
64
nutrient solutions has focused on the root apex, which is the most sensitive site of root to Al
65
toxicity, while the whole root architecture has gained less attention.
66
Although Al tolerance in wheat appears to be controlled by a single dominant gene
67
(Delhaize et al. 1993a; Riede and Anderson 1996), many root traits are under polygenic
68
control and expression of these genes is influenced by mutual interactions of roots with the
69
abiotic and biotic soil environment (McCully 1999). The importance of root architecture for
70
plant growth and performance, especially under environmental stress has recently gained
71
more attention (e.g. Lynch 1995; López-Bucio et al. 2003). Non-invasive techniques such as
72
x-ray Micro Computed Tomography (µCT) provide an opportunity to examine 3-D root
73
architecture (Tracy et al. 2010) non-destructively in the opaque matrix of soil.
4
The aim of this study was to quantify Al induced changes in root architecture of two
75
wheat cultivars that differ in Al tolerance (Al tolerant Sivka and Al sensitive Scout 66) grown
76
in different growing systems (nutrient solutions and soil), and to compare the usefulness of
77
two methods (WinRhizo and x-ray µCT) for assessing Al induced changes in the root
78
architecture.
79
80
Materials and Methods
81
Plant material and growing conditions 82
Seeds of Al tolerant wheat cultivar Sivka were obtained from the University of Zagreb,
83
Faculty of Agriculture, Department of Plant Breeding, Genetics, and Biometrics
84
(Svetošimunska cesta 25, 10000 Zagreb, Croatia), and Al sensitive cultivar Scout 66 from the
85
Crop Research Institute, Gene Bank Department (Drnovská 507, 161 06 Praha 6 – Ruzyně,
86
Czech Republic). Seeds were surface sterilized in 2.5% sodium hypochlorite, thoroughly
87
rinsed with distilled water and soaked for 6 h hours in distilled water. All seeds were
88
germinated for 64 h on filter paper soaked with 0.2 mM CaCl2 at 23/18 ºC with a 16/8 h, 89
day/night regime.
90
91
Soil-based experiment 92
Soil samples (silty loam, luvisol) were collected from the Ap horizon of an arable field
93
near Gospić, Croatia (44º32’45’’N, 15º22’28’’E). Soil samples were air dried and sieved to <2 94
mm diameter. Selected physical and chemical characteristics of the soil are shown in Table 1.
95
To get soils with different pH half of the soil samples were limed using 1.0 g CaCO3 kg-1. 96
Prepared soil samples were moistened to field capacity and incubated for 2 months at room
97
temperature. After the incubation period soil pH was 5.8, and Al saturation was 3.32%.
98
Before planting, soil samples were sieved through <1.0 mm diameter mesh and were placed
5
into 50 mm diameter and 100 mm high plastic columns to achieve a bulk density of 1.0 g cm
-100
3. The soil was watered and maintained at a volumetric water content of 15% and kept in 101
growth chambers during the seed germination period (64 h). Four uniformly developed
102
seedlings per cultivar were selected for growth (one plant per column). Germinated seeds
103
were placed in 1 mm diameter, 2 mm deep holes drilled in the soil columns. The seeds were
104
placed in the hole with the radical downwards before being covered with soil. Plants were
105
grown in a growth chamber with 16/8 h, 23/18 ºC day/night regime and 75% relative
106
humidity.
107
108
Table 1. Physical and chemical properties of the soil used in the study.
109
Sanda Silta Claya pHb Corgc Nd Pf ECECg Ca Mg K Na Al Alh
———%——— H2O % mg kg-1 ———cmol(+) kg-1———— sat
(%)
8.0 72.3 19.7 4.6 2.9 0.4 12 4.46 1.4 0.54 0.62 0.05 1.85 41.5
aSoil particle size distribution was determined by pipette-method with sieving and sedimentation. 110
bpH potentiometrically. 111
cOrganic carbon content (C
org) determination after dry combustion. 112
dTotal nitrogen by modified Kjeldahl method. 113
fPhosphorus by ammonium lactate method. 114
gEffective cation exchange capacity (ECEC = Ca + Mg + K + Na + Al) and base saturation level were 115
determined in barium chloride extracts; Determination of exchangeable acidity in barium chloride extracts.
116
hAl sat – Al saturation =100 x (exchangeable Al)/(ECEC). 117
118
Nutrient solution experiment 119
The experiment was prepared as a randomized block design with ten replicate plants of
120
each cultivar per treatment. Plants were grown on an opaque plastic mesh in two different
121
nutrient solutions which were previously used in experiments related to Al toxicity. The first
122
nutrient solution (NSR) was used previously by Rengel and Jurkić (1992; 1993) and the
123
second nutrient solution (NSD) was used by Delhaize et al. (1993a; 1993b). Treatments were
124
represented as control nutrient solutions, pH 4.0, without aluminium (NSR0 and NSD0,
125
6
NSD1, respectively). Ionic activities and Al speciation in nutrient solutions were calculated
127
by GEOCHEM-EZ (Shaff et al. 2010) and are shown in Table 2. Based on the calculations,
128
the free activities of Al3+ were 0.0 (in NSR0 and NSD0) and 72.0 µM L-1 (in NSR1 and
129
NSD1). Nutrient solutions were continuously aerated, daily replenished and the pH was
130
adjusted with 0.1 M HCl. Plants were grown in a growth chamber with 16/8 h, 23/18 ºC
131
day/night regime and 75% relative humidity.
132
133
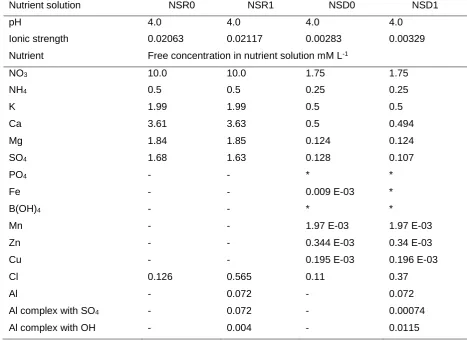
Table 2. Chemical composition and ion activities of nutrient solutions calculated by
134
GEOCHEM-EZ.
135
Nutrient solution NSR0 NSR1 NSD0 NSD1
pH 4.0 4.0 4.0 4.0
Ionic strength 0.02063 0.02117 0.00283 0.00329
Nutrient Free concentration in nutrient solution mM L-1
NO3 10.0 10.0 1.75 1.75
NH4 0.5 0.5 0.25 0.25
K 1.99 1.99 0.5 0.5
Ca 3.61 3.63 0.5 0.494
Mg 1.84 1.85 0.124 0.124
SO4 1.68 1.63 0.128 0.107
PO4 - - * *
Fe - - 0.009 E-03 *
B(OH)4 - - * *
Mn - - 1.97 E-03 1.97 E-03
Zn - - 0.344 E-03 0.34 E-03
Cu - - 0.195 E-03 0.196 E-03
Cl 0.126 0.565 0.11 0.37
Al - 0.072 - 0.072
Al complex with SO4 - 0.072 - 0.00074
Al complex with OH - 0.004 - 0.0115
Notes. * Almost the entire nutrient is in complexes. E-03 concentrations are in µM L-1. 136
137
Root Imaging 138
For the x-ray µCT scanning, the columns with live plants were scanned on the third and
139
fifth day after planting (DAP) using a Phoenix Nanotom® (GE Measurement & Control
[image:6.595.62.530.293.633.2]7
Solutions, Wunstorf, Germany) x-ray µCT scanner set at 100 kV and 210 µA, with a 0.2-mm
141
copper filter and voxel resolution was set at 50 µm. For each column, 1200 image projections
142
were collected over a 30-min period. Image slices were reconstructed into 3D volumes using
143
software Datos|x with beam-hardening reduction algorithms applied and then visualised and
144
analysed in VGStudioMax® 2.0 (Volume Graphics GmbH, Heidelberg, Germany). Roots
145
were segmented from the obtained images using the Region Growing selection tool following
146
the method of Tracy et al. (2012). Segmented root systems were used for quantitative
147
determination of number of seminal roots, root length, length of the longest seminal root, root
148
surface area and root volume.
149
After the final µCT scan at 5 DAP, roots were extracted from the soil and carefully
150
washed and scanned using Epson Perfection V700 photo scanner and WinRhizo® software
151
(WinRhizo 2009 Reg., Regent Instruments Canada Inc.). Root measurements of the plants
152
grown in nutrient solutions were conducted at 3 and 5 DAP, using Epson Perfection V700
153
photo scanner and WinRhizo software.
154
155
Statistical analysis 156
Data were analysed using the SAS® 9.2 statistical package (SAS Institutes, Cary, NC).
157
For the comparison of the scanning techniques (x-ray µCT versus WinRhizo) results of the
158
root traits (number of seminal roots, root length, the length of the longest seminal root, root
159
surface area and root volume) of soil grown plants that were obtained at 5 DAP were
160
compared using ANOVA, followed by the use of Tukey's honestly significant difference
161
(HSD) test. For comparisons of different nutrient solutions (NSR0, NSR1, NSD0, and NSD1),
162
soil treatments (acid versus limed soil), and growing systems, results of the root traits were
163
analysed using repeated measures (Mixed Model Repeated Measures, Littell et al. 1996).
164
8
Results
166
Effect of aluminium toxicity and soil acidity on root traits 167
Root traits of Al tolerant (Sivka) and Al sensitive (Scout 66) wheat cultivars grown in
168
different nutrient solutions with toxic concentrations of Al and in control solutions (without
169
Al) and in acid and limed soil are shown in Figure 1,2,3,4, and 5.
170
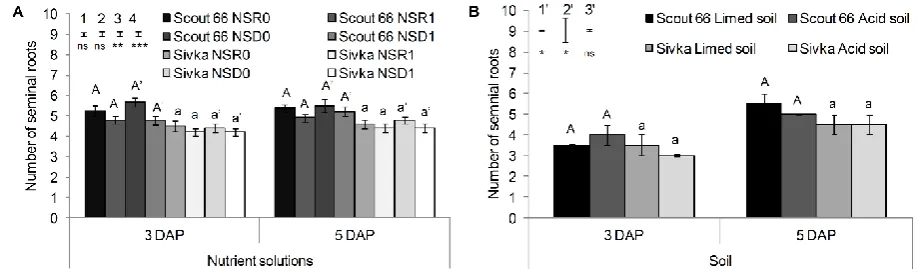
The number of seminal roots was consistently larger for Scout 66 compared to Sivka
171
across nutrient solutions (P < 0.001) and soil treatments (P < 0.05). In both nutrient solutions
172
(NSD and NSR) and at both measurement times (3 and 5 DAP) Al treatments reduced (P <
173
0.01) the number of seminal roots (from 5.01 in Al treatment solutions to 4.61 in control
174
solutions) (Figure 1A). In soil the number of seminal roots increased over time, from 3.5 (3
175
DAP) to 4.88 (5 DAP) (P < 0.05) (Figure 1B).
176
177
178
Figure 1. Comparison of the number of seminal roots of wheat cultivars Scout 66 and Sivka grown in Al
179
treatment solutions (NSR1 and NSD1) and control nutrient solutions (NSR0 and NSD0) (A) and in acid and
180
limed soil (B). For plants grown in soil roots were scanned by x-ray μCT and measured by (VGStudioMax), and
181
for plants grown in nutrient solutions roots were scanned and measured by WinRhizo, at 3 DAP and 5 DAP,
182
respectively. Error bars associated with the histograms are ±1 standard error of the mean. The vertical bars
183
represent standard error of the difference (SED) for (1) day, (2) nutrient solution, (3) nutrient solution treatment,
184
(4) cultivars; (1’) day, (2’) soil treatment, (3’) cultivars. Below the vertical bars (SED) ANOVA for the main
185
effects is presented as: *Significant at the 0.05 probability level; **Significant at the 0.01 probability level;
186
***Significant at the 0.001 probability level; and ns = not significant. For figure A: means with the same letter
187
are not significantly different between nutrient solution treatments within each nutrient solution type at each
188
measurement time; for Scout 66 (capital in NSD and capital with apostrophe in NSR, respectively) and for Sivka
189
(small in NSD and small with apostrophe in NSR, respectively). For figure B: means with the same letter are not
190
significantly different between soil treatments at each measurement time for Scout 66 (capital) and for Sivka
191
(small).
[image:8.595.83.543.405.542.2]9 194
[image:9.595.95.532.106.241.2]195
Figure 2. Comparison of mean root length of wheat cultivars Scout 66 and Sivka grown in Al treatment solutions
196
(NSR1 and NSD1) and control nutrient solutions (NSR0 and NSD0) (A) and in acid and limed soil (B). For
197
plants grown in soil roots were scanned by x-ray μCT and measured by (VGStudioMax), and for plants grown in
198
nutrient solutions roots were scanned and measured by WinRhizo, at 3 DAP and 5 DAP, respectively. Error bars
199
associated with the histograms are ±1 standard error of the mean. The vertical bars represent standard error of the
200
difference (SED) for (1) day, (2) nutrient solution, (3) nutrient solution treatment, (4) cultivars; (1’) day, (2’) soil
201
treatment, (3’) cultivars. Below the vertical bars (SED) ANOVA for the main effects is presented as:
202
*Significant at the 0.05 probability level; **Significant at the 0.01 probability level; ***Significant at the 0.001
203
probability level; and ns = not significant. For figure A: means with the same letter are not significantly different
204
between nutrient solution treatments within each nutrient solution type at each measurement time; for Scout 66
205
(capital in NSD and capital with apostrophe in NSR, respectively) and for Sivka (small in NSD and small with
206
apostrophe in NSR, respectively). For figure B: means with the same letter are not significantly different
207
between soil treatments at each measurement time for Scout 66 (capital) and for Sivka (small).
208 209
210
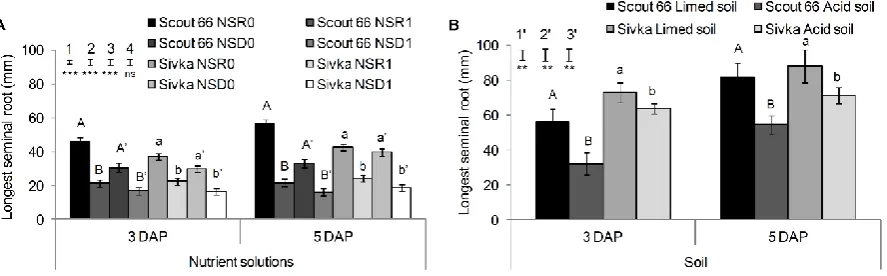
Figure 3. Comparison of length of the longest seminal root of wheat cultivars Scout 66 and Sivka grown in Al
211
treatment solutions (NSR1 and NSD1) and control nutrient solutions (NSR0 and NSD0) (A) and in acid and
212
limed soil (B). For plants grown in soil roots were scanned by x-ray μCT and measured by (VGStudioMax), and
213
for plants grown in nutrient solutions roots were scanned and measured by WinRhizo, at 3 DAP and 5 DAP,
214
respectively. Error bars associated with the histograms are ±1 standard error of the mean. The vertical bars
215
represent standard error of the difference (SED) for (1) day, (2) nutrient solution, (3) nutrient solution treatment,
216
(4) cultivars; (1’) day, (2’) soil treatment, (3’) cultivars. Below the vertical bars (SED) ANOVA for the main
217
effects is presented as: *Significant at the 0.05 probability level; **Significant at the 0.01 probability level;
218
***Significant at the 0.001 probability level; and ns = not significant. For figure A: means with the same letter
219
are not significantly different between nutrient solution treatments within each nutrient solution type at each
220
measurement time; for Scout 66 (capital in NSD and capital with apostrophe in NSR, respectively) and for Sivka
221
(small in NSD and small with apostrophe in NSR, respectively). For figure B: means with the same letter are not
222
significantly different between soil treatments at each measurement time for Scout 66 (capital) and for Sivka
223
(small).
[image:9.595.95.539.420.558.2]10
In nutrient solutions Al treatments reduced (P < 0.001) root length of both cultivars (Scout 66
226
and Sivka), grown in both nutrient solutions (NSD and NSR) and at both measurement times
227
(3 DAP and 5 DAP). In addition, for all cultivar × nutrient solution × treatment combinations,
228
root length increased with time (P < 0.05) except for Scout 66 grown in NSR1 (P > 0.05)
229
(70.64 mm and 85.65 mm, 3 and 5 DAP, respectively) and in NSD1 (P > 0.05) (55.6 mm and
230
68.47 mm, 3 DAP and 5 DAP, respectively) (Figure 2A). Root length of plants grown in soil
231
was affected by cultivar × treatment × measurement time interaction (P < 0.05). Reduction of
232
root length of Scout 66 grown in acid soil was evident at both measurement time (i.e. 87.5
233
mm vs. 146.23 mm at 3 DAP, P < 0.05 and 454.37, mm vs. 194.7 mm 5 DAP, P < 0.001, in
234
acid vs. limed soil, respectively). A significant reduction in root length of Sivka grown in acid
235
soil was recorded at 5 DAP (376.86 mm in acid vs. 453.24 mm in limed soil, P < 0.05)
236
(Figure 2B).
237
[image:10.595.94.542.405.540.2]238
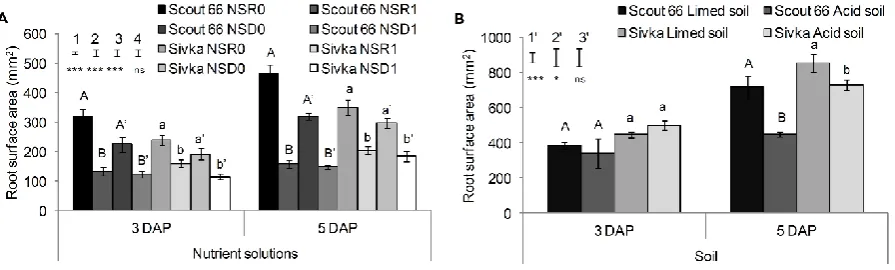
Figure 4. Comparison of root surface area of wheat cultivars Scout 66 and Sivka grown in Al treatment solutions
239
(NSR1 and NSD1) and control nutrient solutions (NSR0 and NSD0) (A) and in acid and limed soil (B). For
240
plants grown in soil roots were scanned by x-ray μCT and measured by (VGStudioMax), and for plants grown in
241
nutrient solutions roots were scanned and measured by WinRhizo, at 3 DAP and 5 DAP, respectively. Error bars
242
associated with the histograms are ±1 standard error of the mean. The vertical bars represent standard error of the
243
difference (SED) for (1) day, (2) nutrient solution, (3) nutrient solution treatment, (4) cultivars; (1’) day, (2’) soil
244
treatment, (3’) cultivars. Below the vertical bars (SED) ANOVA for the main effects is presented as:
245
*Significant at the 0.05 probability level; **Significant at the 0.01 probability level; ***Significant at the 0.001
246
probability level; and ns = not significant. For figure A: means with the same letter are not significantly different
247
between nutrient solution treatments within each nutrient solution type at each measurement time; for Scout 66
248
(capital in NSD and capital with apostrophe in NSR, respectively) and for Sivka (small in NSD and small with
249
apostrophe in NSR, respectively).For figure B: means with the same letter are not significantly different between
250
soil treatments at each measurement time for Scout 66 (capital) and for Sivka (small).
251 252
11 254
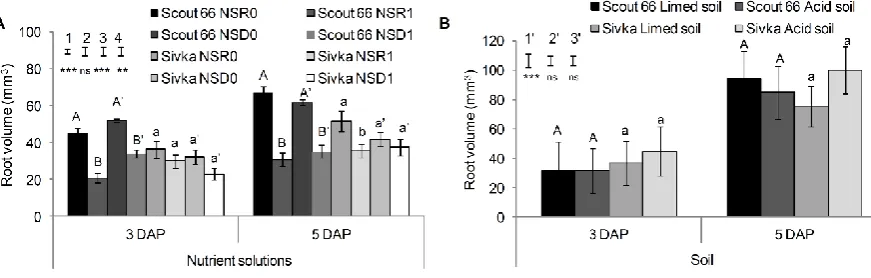
Figure 5. Comparison of root volume of wheat cultivars Scout 66 and Sivka grown in Al treatment solutions
255
(NSR1 and NSD1) and control nutrient solutions (NSR0 and NSD0) (A) and in acid and limed soil (B). For
256
plants grown in soil roots were scanned by x-ray μCT and measured by (VGStudioMax), and for plants grown in
257
nutrient solutions roots were scanned and measured by WinRhizo, at 3 DAP and 5 DAP, respectively. Error bars
258
associated with the histograms are ±1 standard error of the mean. The vertical bars represent standard error of the
259
difference (SED) for (1) day, (2) nutrient solution, (3) nutrient solution treatment, (4) cultivars; (1’) day, (2’) soil
260
treatment, (3’) cultivars. Below the vertical bars (SED) ANOVA for the main effects is presented as:
261
*Significant at the 0.05 probability level; **Significant at the 0.01 probability level; ***Significant at the 0.001
262
probability level; and ns = not significant. For figure A: means with the same letter are not significantly different
263
between nutrient solution treatments within each nutrient solution type at each measurement time; for Scout 66
264
(capital in NSD and capital with apostrophe in NSR, respectively) and for Sivka (small in NSD and small with
265
apostrophe in NSR, respectively). For figure B: means with the same letter are not significantly different
266
between soil treatments at each measurement time for Scout 66 (capital) and for Sivka (small).
267 268
In nutrient solutions Al treatments reduced (P < 0.001) length of the longest seminal root
269
of both cultivars (Scout 66 and Sivka), grown in both nutrient solutions (NSD and NSR) and
270
at both measurement times (3 DAP and 5 DAP). In addition, there was a significant
271
interaction of cultivar × nutrient solution × treatment (P < 0.01). No significant difference in
272
length of the longest seminal root was obtained for Sivka grown in NSR0 (P > 0.05) (39.77
273
mm) and NSD0 (34.68 mm), while cultivar Scout 66 produced longer seminal root in NSR0
274
(P < 0.001) (51.25 mm) compared to NSD0 (31.78 mm). The opposite was obtained in Al
275
treatment solutions where no significant difference (P > 0.05) was found between NSR1
276
(21.40 mm) and NSD1 (16.37 mm) grown Scout 66, while significantly (P < 0.05) longer
277
seminal roots were obtained for NSR1 (23.24 mm) compared to NSD1 (17.55 mm) grown
278
Sivka (Figure 3A). In soil, length of the longest seminal root was affected by measurement
279
time (P < 0.01), by cultivar (P < 0.01) with average length of 55.97 mm for Scout 66
[image:11.595.93.529.77.216.2]12
compared to 74.08 mm for Sivka, and by treatment (P < 0.01) with average length 55.35 mm
281
in acid soil compared to 74.71 mm in limed soil (Figure 3B).
282
In nutrient solutions, root surface area was affected by nutrient solution × treatment (P <
283
0.01) and cultivar × treatment (P < 0.001) interaction. Al treatments reduced root surface area
284
in both nutrient solutions, as well as for both cultivars. However, this reduction was more
285
pronounced in NSR (344.51 mm2 in NSR0 vs. 165.35 mm2 in NSR1) compared to NSD
286
(258.65 mm2 in NSD0 vs. 142.57 mm2 in NSD1) and for cultivar Scout 66 (332.99 mm2 in
287
control solutions vs. 142.1 mm2 in Al-treatment solutions) compared to Sivka (270.17 mm2
288
and in control solutions vs. 165.82 mm2 in Al-treatment solutions) (Figure 4A). When grown 289
in soil, the largest mean root surface area was obtained for Sivka (634.41 mm2) compared to
290
Scout 66 (475.14 mm2) (P < 0.05), and the interaction of treatment × measurement time was
291
significant (P < 0.05). No significant differences (P > 0.05) in root surface area were found
292
between plants grown in acid (422.1 mm2) and limed (417.27 mm2) soil at 3 DAP, while at 5
293
DAP plants grown in limed soil produced root systems with bigger (P < 0.01) surface area
294
(788.59 mm2) compared to those grown in acid soil (591.16 mm2) (Figure 4B)
295
In nutrient solutions, root volume was affected by interactions of cultivar × treatment (P <
296
0.001) and cultivar × nutrient solution × measurement time (P < 0.05). Al treatments reduced
297
root volume of cv. Scout 66 at both measurements and in both nutrient solutions. On the other
298
hand, significant reduction of root volume of cv. Sivka was found only at 5 DAP in NSR (P <
299
0.01) (35.9 mm3 in NSR1 compared to 51.6 mm3 in NSR0) (Figure 5A). In soil, the
300
interaction of cultivar × treatment (P < 0.05) for root volume was significant. Root volume of
301
cultivar Sivka was greater (P < 0.05) in acid (74.22 mm3) compared to limed soil (56.11
302
mm3), while no significant differences (P > 0.05) were found for Scout 66 grown in acid
303
(58.14 mm3) and limed soil (62.63 mm3) (Figure 5B). 304
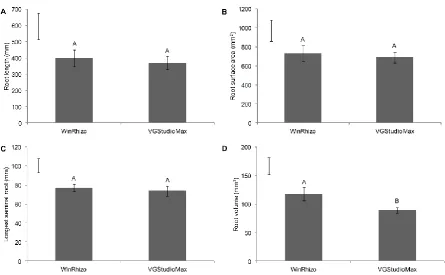
13 Comparison of the scanning techniques: X-ray µCT versus WinRhizo
306
A comparison of the root traits (root length, length of the longest seminal root, root
307
surface area, and root volume) measured by VGStudioMax after x-ray µCT scanning and by
308
WinRhizo (after washing soil from roots) at 5 DAP are shown in Figure 6. Although all
309
measured root traits were slightly larger when measured by WinRhizo compared to
310
VGStudioMax, there were no significant difference in root length (P > 0.05), root surface area
311
(P > 0.05), and the length of the longest seminal root (P > 0.05) when these two techniques
312
were compared. However, a significantly larger (P < 0.05) root volume was obtained by
313
WinRhizo (117.96 mm3) compared to VGStudioMax (89.44 mm3) which can be attributed to 314
the former capturing more of the finer roots (Figure 7).
315
316
Figure 6. Comparison of the root traits of wheat cultivars Scout 66 and Sivka obtained by different scanning
317
techniques, μCT (VGStudioMax) and WinRhizo at 5 DAP: mean root length (A), root surface area (B), length of
318
the longest seminal root (C), and root volume (D). Error bars associated with the histograms are ±1 standard
319
error of the mean. The vertical bars represent minimum significant difference (Tukey's HSD test, p=0.05) for
320
comparing the mean values between scanning techniques; means with the same letter are not significantly
321
different.
[image:13.595.75.521.350.625.2]14 326
Figure 7. Root system images of wheat cultivars Scout 66 (A and C) and Sivka (B and D) at 3 DAP and 5 DAP,
327
grown in acid (A and B) and in limed soil (C and D), scanned by μCT (left) and WinRhizo (right).
15
Discussion
330
Although all measured root traits were larger when measured by WinRhizo compared to
331
VGStudioMax, comparison of the results of root traits obtained by these two scanning
332
techniques showed that they did not differ significantly, except for root volume. Relatively
333
poor correlation between root volumes measured destructively by WinRhizo and
non-334
destructively, after x-ray µCT scan, was already described by Tracy et al. (2012). Tracy et al.
335
(2012) have attributed these discrepancies to the better contrast between roots and their
336
surroundings which can be obtained using WinRhizo and on the other hand to the image
337
resolution limitation which were gained by x-ray µCT. This could also be the truth for our
338
results (Figure 7). Additional technical disadvantage of the x-ray µCT scanning technique is
339
the limited soil volume that can be used for growing plants which disables this technique to
340
study older plants with more complex root architecture. Namely, all roots of the plants used in
341
this study reached bottom and/or side walls of the columns by the 5 DAP (Figure 7).
342
However, results of this study showed that x-ray µCT scanning technique provide reliable and
343
good quality 3-D scans of roots in the soil, and despite its current limitations, new
344
developments of this technique, such as automated root segmentation, and bigger, faster and
345
more precise x-ray CT scanners with greater resolution would give the opportunity to study
346
older more complex root systems (for the review see Mooney et al. 2012).
347
Aluminum toxicity reduced all examined root traits in the experiment with nutrient
348
solutions while in soil based experiments it caused reduction of root length, length of the
349
longest seminal root and root surface area. Al induced reduction of root size is most likely the
350
primary cause of commonly described symptoms of Al toxicity, such as impairment of
351
nutrient and water acquisition. Al toxicity, both in acid soil and in Al treatment nutrient
352
solutions, caused a more pronounced reduction of all examined root traits for Al sensitive cv.
353
Scout 66 compared to Al tolerant cv. Sivka (Figure 1, 2, 3, 4, and 5). Differences in root traits
16
determined between cv. Scout 66 and cv. Sivka are in accordance to their tolerance to
355
aluminium. It is well known that there is significant genetic variability in Al tolerance among
356
wheat cultivars and cv. Scout 66 was used as a model of an Al sensitive cultivar in previous
357
studies related to Al toxicity (e.g. Rengel and Jurkić 1992; Ryan et al. 1992), on the other
358
hand cv. Sivka was evaluated as moderately tolerant cultivar in a screening for Al tolerance
359
among Yugoslavian wheat cultivars (Rengel and Jurkić 1992).
360
The first and most easily recognized symptom of Al toxicity is the inhibition of root
361
growth (Delhaize and Ryan 1995). Barceló and Poschenrieder (2002) stated that sensitive
362
plants exhibit statistically significant inhibition of root elongation after approximately 30 min
363
to 2 h exposure. Our results show that Al toxicity caused slower reduction of root growth in
364
acid soil compared to those that were obtained in experiments with nutrient solutions. For
365
example, reduction of root length and root surface area for plants grown in Al treatment
366
solutions was evident at 3 DAP while reduction of root length for acid soil grown cv. Sivka
367
and reduction of root surface area for both acid soil grown cultivars was evident only at 5
368
DAP. These delayed response to Al toxicity observed for acid soil grown plants could be
369
explained as a lag phase. Barceló and Poschenrieder (2002) described the lag phase as the
370
time or concentration required for Al to interfere with key processes in root growth. It was
371
estimated (Delhaize et al. 1993a) that significant Al inhibition of root growth in wheat occurs
372
at root tip Al concentrations around 1000 µg Al g-1. Therefore, these results indicate that acid 373
soil grown plants, especially cv. Sivka, can tolerate a longer period of exposure to toxic Al
374
concentrations.
375
Although there are some reports about the Al induced inhibition of lateral roots in
376
sensitive genotypes of rice (Oryza sativa L.) (Famoso et al. 2011), soybean (Glycine max L.).
377
(Vilagarcia et al. 2001; Silva et al. 2001) maize (Zea mays L.) (Clark et al. 2013), there is lack
378
of data about the effect of Al toxicity on other root traits, especially under real acid soil
17
conditions. Villagarcia et al. (2001) developed a sand based screening technique which
380
simulated growth in acid soil. In their experiments, they made comparison between
381
hydroponic and sand based experiments by measurements of different root traits of soybean.
382
These authors reported Al toxicity (eighteen days of exposure to 450 µM Al L-1) in sand 383
based experiments did not greatly affect the tap root length, while it caused significant
384
reduction of root surface area (by 58%) compared to control, probably due to reduction in
385
length of basal roots and branches. In our experiments Al toxicity induced reduction of early
386
stage root volume for both cultivars grown in Al treatment nutrient solutions (Figure 5A),
387
while soil acidity did not affect root volume of cv. Scout 66 and that of cv. Sivka was greater
388
when grown in acid compared to limed soil (Figure 5B). Aluminium-injured roots are often
389
described as stubby and brittle, with thickened lateral roots (Foy et al. 1978). Possible
390
explanations of equal root volume (limed and acid soil grown cv. Scout 66) or increased root
391
volume in acid soil grown cv. Sivka could be the Al induced increase in viscous and elastic
392
extensibility of cell wall of the root apices (Ma et al. 2004) or Al induced reduction of cell
393
length accompanied by radial cell expansion which was found on Al treated rice roots
394
(Alvarez et al. 2012).
395
Plants grown in acid soil produced larger root system (root length, length of the longest
396
seminal root, root surface area and root volume) compared to plants grown in Al treatment
397
solutions. These results could be explained by higher activities of toxic Al in Al treatment
398
solutions (Table 2), as well as possible mitigating effect of soil compounds like plant nutrients
399
and organic matter on Al toxicity. Despite the high Al saturation percentage of soil used in
400
this experiment (Table 1), Delhaize and Ryan (1995) found that exchangeable Al in soil is a
401
poor indicator of Al toxicity. In sand based experiments, Villagarcia et al. (2001) reported that
402
an approximate 100-fold increase in Al concentration was required to inhibit root growth to a
403
comparable degree to hydroponic based experiments. However, high concentrations of toxic
18
Al are not the only reason for decreased root size in nutrient solutions. This statement is
405
supported by the fact that acid soil grown plants produced a larger root system compared to
406
plants grown in the control nutrient solutions. Reduced root growth of plants grown in
407
nutrient solutions could be explained by stress caused by transfer of young seedlings to
408
hydroponics (Tamas et al. 2006). Another possible explanation could be the more efficient
409
detoxification of Al in soil due to slower diffusion rates of organic acids (malate) away from
410
root surface and Al toward root surface. Kinraide et al. (2005) proposed biphasic diffusion
411
hypothesis of Al detoxification, which suggests that majority of Al detoxification occurs just
412
beneath the root epidermis. Our observed increase in root volume in acid soil grown plants
413
possibly caused by radial expansion of epidermal and cortex cells may represent the evidence
414
for such detoxification.
415
Despite equal concentrations of free Al in both NSD1 and NSR1 solutions (Table 2), Al
416
toxicity caused more pronounced reduction of root growth in NSD compared to NSR.
417
Possible explanation may lay in the different concentration of nutrients in these two nutrient
418
solutions, especially those of calcium and magnesium, and differences in ionic strength of the
419
solutions (Table 2). With the increasing ionic strength of the nutrient solution increases the
420
competition between Al3+ and other cations for negatively charged sites within the root cell
421
wall and plasma membrane. Due to complex chemistry of Al and its multiple interactions with
422
different nutrients in solution, in previous studies of Al toxicity researchers used simple
423
nutrient solutions with low ionic strength and wide range of Al concentrations (from 5 to 200
424
µM L-1) (Wang et al. 2006), often avoiding usage of different plant nutrients, such as sulphur
425
and phosphorus (Samac and Tesfaye 2003). However, it has been well documented that
426
different concentrations nutrients such as nitrate, phosphate, sulphate and iron can lead to
427
alterations in root growth and architecture (for review see López-Bucio et al. 2003).
19
Results of this study indicate that beside the well-known reduction of root length Al
429
toxicity also has a profound effect on other root traits, e.g. in nutrient solutions Al toxicity
430
reduced the number of seminal roots, the length of the longest seminal root, the root surface
431
area, root volume. In addition, differences obtained in Al induced effects on root architecture
432
between different nutrient solutions (NSD and NSR) and even more profound differences
433
found between two growing systems (soil and nutrient solutions) emphasize the need for
434
further investigation of wheat root architecture under specific conditions of Al toxicity. In
435
previous experiments Al toxicity was studied under simplified conditions. X-ray µCT
436
provides the opportunity to non-destructively study 3-D root system development in their
437
natural environment of soil. With the further development of this technique, it will be possible
438
to examine larger number of samples and to monitor root development over a more prolonged
439
period across the growth cycle of a plant and to include different environmental factors or
440
plant microbial interactions that could have significant effect on Al toxicity. For example, it
441
would be useful to investigate Al induced root architecture changes across specific soil pH
442
ranges (pH 4.0 – 6.0) in which Al toxicity occurs in arable soils. Furthermore, considering
443
that in many arable soils Al toxicity occurs in acid subsoil layer, further research should focus
444
on larger number of genotypes and on root architectures of mature more established plants.
445
446
Acknowledgements
447
This study was supported by a studentship from the British Scholarship Trust and Ministry
448
of Science Education and Sports of the Republic of Croatia. We wish to thank Crop Research
449
Institute, Gene Bank Department,Praha, Czech Republic, and Department of Plant Breeding,
450
Genetics, and Biometrics, Faculty of Agriculture, Zagreb, Croatia for providing the seeds.
451
452
20
References
454
Alvarez, I., O. Sam, I. Reynaldo, P. Testillano, M. Carmen Risueno, and M. Arias. 2012.
455
Morphological and cellular changes in rice roots (Oryza sativa L.) caused by Al stress.
456
Botanical Studies 53:67–73.
457
Barceló, J., and C. Poschenrieder. 2002. Fast root growth responses, root exudates, and
458
internal detoxification as clues to the mechanisms of aluminum toxicity and resistance:
459
A review. Environmental and Experimental Botany 48:75–92. doi: 10.1016/S0098-460
8472(02)00013-8.
461
Clark, R. T., A. N. Famoso, K. Zhao, J. E. Shaff, E. J. Craft, C. D. Bustamante, S. R.
462
McCouch, D. J. Aneshansley, and L.V. Kochian. 2013. High-throughput
two-463
dimensional root system phenotyping platform facilitates genetic analysis of root
464
growth and development. Plant, Cell and Environment 36:454–66. doi: 10.1111/j.1365-465
3040.2012.02587.x.
466
Delhaize, E., S. Craig, C. D. Beaton, R. J. Bennet, V. C. Jagadish, and P. J. Randall.
467
1993a. Aluminum tolerance in wheat (Triticum aestivum L.), I: Uptake and distribution
468
of aluminum in root apices. Plant Physiology 103:685–93.
469
Delhaize, E., and P. R. Ryan. 1995. Aluminum toxicity and tolerance in plants. Plant
470
Physiology 107:315–21.
471
Delhaize, E., P. R. Ryan, and P. J. Randall. 1993b. Aluminum tolerance in wheat
472
(Triticum aestivum L.), II: Aluminum stimulated excretion of malic acid from root
473
apices. Plant Physiology 103:695–702.
474
Famoso, A.N., R.T. Clark, J. E. Shaff, E. Craft, S. R. McCouch, L. V. Kochian. 2010.
475
Development of a novel aluminum tolerance phenotyping platform used for
476
comparisons of cereal aluminum tolerance and investigations into rice aluminum
477
tolerance mechanisms. Plant Physiology 153:1678–1691. doi:10.1104/pp.110.156794.
478
Foy, C. D., R. L. Chaney, and M. C. White. 1978. The physiology of metal toxicity in
479
plants. Annual Review of Plant Physiology 29:511–66.
480
doi:10.1146/annurev.pp.29.060178.002455.
481
Gregory, P. J., and P. Hinsinger. 1999. New approaches to studying chemical and physical
482
changes in the rhizosphere: An overview. Plant and Soil 211:1–9.
483
doi:10.1023/A:1004547401951.
484
Kinraide, T. B., D. R. Parker, and R. W. Zobel. 2005. Organic acid secretion as a
485
mechanism of aluminum resistance: A model incorporating the root cortex, epidermis,
486
and the external unstirred layer. Journal of Experimental Botany 56:1853–65.
487
doi:10.1093/jxb/eri175.
488
Kochian, L. V. 1995. Cellular mechanisms of aluminum toxicity and resistance in plants.
489
Annual Review of Plant Physiology and Plant Molecular Biology 46:237–60.
490
doi:10.1146/annurev.pp.46.060195.001321.
491
Littell, R. C., G. A. Milliken, W. W. Stroup, and R. D. Wolfinger. 1996. SAS system for
492
mixed models, 87–134. Cary, NC: SAS Institute Inc.
493
López-Bucio, J., A. Cruz-Ramı́rez, and L. Herrera-Estrella. 2003. The role of nutrient
494
availability in regulating root architecture. Current Opinion in Plant Biology 6:280–87.
495
doi:10.1016/S1369-5266(03)00035-9.
496
Lynch, J. 1995. Root architecture and plant productivity. Plant Physiology 109:7–13.
497
Ma, J. F., R. Shen, S. Nagao, and E. Tanimoto. 2004. Aluminum targets elongating cells
498
by reducing cell wall extensibility in wheat roots. Plant Cell Physiology 45:583–89.
499
doi:10.1093/pcp/pch060.
21
McCully, M. E. 1999. Roots in soil: Unearthing the complexities of roots and their
501
rhizospheres. Annual Review of Plant Physiology and Plant Molecular Biology
502
50:695–718. doi:10.1146/annurev.arplant.50.1.695.
503
Mooney, S. J., T. P. Pridmore, J. Helliwell, and M. J. Bennett. 2012. Developing x-ray
504
computed tomography to non invasively image 3-D root systems architecture in soil.
505
Plant and Soil 352:1–22. doi:10.1007/s11104-011-1039-9.
506
Rengel, Z., and V. Jurkić. 1992. Genotypic differences in wheat Al tolerance. Euphytica
507
62:111–17. doi:10.1007/BF00037936.
508
Rengel, Z., and V. Jurkić. 1993. Evaluation of Triticum aestivum germplasm from Croatia
509
and Yugoslavia for aluminum tolerance. Euphytica 66:111–16.
510
doi:10.1007/BF00023515.Riede, C. R., and J. A. Anderson. 1996. Linkage of RFLP
511
markers to an aluminum tolerance gene in wheat. Crop Science 36:905–09.
512
doi:10.2135/cropsci1996.0011183X0036000400015x.
513
Ryan, P. R., J. E. Shaff, and L. V. Kochian. 1992. Correlation among ionic currents, ion
514
fluxes, and root elongation in aluminum-sensitive and aluminum-tolerant wheat
515
cultivars. Plant Physiology 99:1193–200. doi:10.1104/pp.99.3.1193.
516
Samac, D. A., and M. Tesfaye. 2003. Plant improvement for tolerance to aluminum in
517
acid soils: A review. Plant Cell Tissue and Organ Culture 75:189–207.
518
doi:10.1023/A:1025843829545.
519
Shaff, J. E., B. A. Schultz, E. J. Craft, R. T. Clark, and L. V. Kochian. 2010.
GEOCHEM-520
EZ: A chemical speciation program with greater power and flexibility. Plant and Soil
521
330:207–14. doi:10.1007/s11104-009-0193-9.
522
Silva, I. R., T. J. Smyth, T. E. Carter, and T. W. Rufty. 2001. Altered aluminum root
523
elongation inhibition in soybean genotypes in the presence of magnesium. Plant and
524
Soil 230:223–30. doi:10.1023/A:1010384516517.
525
Tamas, L., S. Budikova, M. Simonovicova, J. Huttova, B. Siroka, and I. Mistrik. 2006.
526
Rapid and simple method for Al toxicity analysis in emerging barley roots during
527
germination. Biologia Plantarum 50:87–93. doi:10.1007/s10535-005-0079-5.
528
Tracy, S. R., C. R. Black, J. A. Roberts, A. McNeill, R. Davidson, M. Tester, M. Samec,
529
D. Korošak, C. Sturrock, and S. J. Mooney. 2012. Quantifying the effect of soil
530
compaction on three varieties of wheat (Triticum aestivum L.) using x-ray
531
microcomputed tomography (CT). Plant and Soil 353:195–208. doi: 10.1007/s11104-532
011-1022-5.
533
Tracy, S. R., J. A. Roberts, C. R. Black, A. McNeill, R. Davidson, and S. J. Mooney.
534
2010. The X-factor: Visualizing undisturbed root architecture in soils using x-ray
535
computed tomography. Journal of Experimental Botany 61:311–13.
536
doi:10.1093/jxb/erp386.
537
Villagarcia, M. R., T. E. Carter, T. W. Rufty, A. S. Niewoehner, M. W. Jennette, and C.
538
Arrellano. 2001. Genotypic rankings for aluminum tolerance of soybean roots grown in
539
hydroponics and sand culture. Crop Science 41:1499–507.
540
doi:10.2135/cropsci2001.4151499x.
541
Von Uexküll, H. R., and E. Mutert. 1995. Global extent, development, and economic
542
impact of acid soils. Plant and Soil 171:1–15. doi:10.1007/BF00009558.
543
Wang, J. P., H. Raman, G. P. Zhao, N. Mendham, and M. X. Zhou. 2006. Aluminum
544
tolerance in barley (Hordeum vulgare L.): Physiological mechanisms, genetics, and
545
screening methods. Journal of Zhejiang University Science B 7:769–87.
546
doi:10.1631/jzus.2006.B0769.