ISSN Online: 2162-2086 ISSN Print: 2162-2078
Factor Influencing the Gold Prices: An
Empirical Investigation in the Indian Context
Sashikala Parimi
IBS, IFHE, Hyderabad, India
Abstract
The most precious metals is Gold for long and its value has been used as the standard for many currencies also known as gold standard. The consumption of gold has increased drastically with strong economic growth and promising movements in gold prices in 1990s during liberalization of gold import poli-cy. The gold prices in India are continuously increasing due to domestic de-mand based on security, liquidity and diversified portfolio. There would be various factors that influence the prices of the gold. This study aims at under-standing and analyzing the various factors which influence the gold prices in the Indian context.
Keywords
Gold Prices, S & P 500, Crude Oil, Indian Rupee Rate, BSE, Nifty, Multiple Regression
1. Introduction
The most precious metals is Gold for long and its value has been used as the standard for many currencies also known as gold standard. It has been used as a symbol of purity, value, royalty and pool of these properties. The consumption of gold has increased drastically with strong economic growth and promising movements in gold prices in 1990s during liberalization of gold import policy. Gold is used as an alternative for dollar since its downfall [1]. Due to its impor-tance in both investment and consumer world, Gold is one of the most widely debated metal and continues to have strong impact on the value of currency of developed countries. Moreover, there exists a strong correlation between the value of the gold and the strength of currencies trading on foreign exchanges.
Gold has been observed as a safe haven, especially during periods of financial
How to cite this paper: Parimi, S. (2018) Factor Influencing the Gold Prices: An Empirical Investigation in the Indian Con-text. Theoretical Economics Letters, 8, 3444-3456.
https://doi.org/10.4236/tel.2018.815211
Received: September 21, 2018 Accepted: December 1, 2018 Published: December 4, 2018
Copyright © 2018 by author and Scientific Research Publishing Inc. This work is licensed under the Creative Commons Attribution International License (CC BY 4.0).
http://creativecommons.org/licenses/by/4.0/ Open Access
and economic stress. It is a safe haven as it is considered as an asset that protects investors’ wealth against financial turmoil and owner can resell it without loss at any time. Investors who suffered heavy loss from stock price falling invested in gold, either to locate a safe haven or to anticipate a higher return [2]. There are also two behavioral reasons why the gold has to be purchased. First, gold has been the traditional form of savings amongst Indian households for many years. So, people need not be as nervous about fluctuations in gold prices when stock or bond prices move. Buying gold gives a feeling of comfort. Psychologists call this the exposure effect [3]. And second, gold is a real asset. And real assets possess an important characteristic—we can touch and feel them. The touch-and-feel factor is one reason why many prefer to buy physical gold than financial gold.
As early as the Byzantine Empire, gold was used to support fiat currencies, or the various currencies considered legal tender in their nation of origin. Gold was also used as the world reserve currency up through most of the 20th century; the United States used the gold standard until 1971 when President Nixon discon-tinued it. One of the reasons for its use is that it limited the amount of money nations were allowed to print. This is because, then as now, countries had li-mited gold supplies on hand. Until the gold standard was abandoned, countries couldn’t simply print their fiat currencies unless they possessed an equal amount of gold. Although the gold standard is no longer used in the developed world, some economists feel we should return to it due to the volatility of the U.S. dol-lar and other currencies [4].
Among the various commodities, Gold and Silver have an important role in the history of money and monetary policy. Traditionally there are considered as a medium of exchange with a unit of value [5]. The commodities gold and silver have a crucial role in the history of money and monetary policy. They are consi-dered as a medium of exchange, store of wealth and a unit of value traditionally
[5]. According to the frame work of [6], these two commodities are expected to hedge against inflation, which leads to increase in the consumer price level and inspire individuals to convert their liquid assets into gold [7]. Further, they are long-lasting, transportable, universally acceptable and easily legitimate.
Therefore, gold and silver prices could effectively gauge inflation expectations since, commodity prices are generally considered to be able to incorporate new information faster than consumer prices. Investors typically buy large quantities of gold when their country is experiencing high levels of inflation. The demand for gold increases during inflationary times due to its inherent value and limited supply. As it cannot be diluted, gold is able to retain value much better than other forms of currency [8].
Nations’ currency is strongly related with the value of imports and exports. The value of currency increases when a country is an exporter. More specifically a country that exports gold reserves will witness an increase in the strength of its currency. In other words, an increase in the price of gold can generate a trade surplus. The supply and demand of the domestic currency depends on the pur-chase of gold by Central bank and this many lead to inflation. This happens
because banks rely on printing more money to buy gold, thereby creating an excess supply of the fiat currency [9].
Mostly gold is considered as an absolute substitution for appreciating the cur-rency of a country. Though there is relationship between gold prices and the value of fiat currency the inverse is not always true. That is if demand for the production of gold is high, the gold prices will increase but the local currency may be very high at the same time. Gold has high impact on the values of world currencies. The gold price continues to play vital role in the foreign exchange markets and is an important metal to follow and analyze for its unique ability to understand the health of both local and international economies. The prices of gold have seen a steep increase of 900% during the last 10 years. In India it is considered to be a safe option for investment but the role is changing over a pe-riod of time bad has entered the secular bull market and it is providing abundant revenue to its investors.
2. Literature Review
The gold prices in India are continuously increasing due to domestic demand based on security, liquidity and diversified portfolio. The historic data indicates that investing in gold is a safe option when the stock market collapses or dollar deteriorates as the gold prices increase during that time [10]. The impact of do-mestic gold price on stock price indices in India is studied by Bhunia & Mukhuti
[2] and found that the Correlation between BSE and NSE are positively asso-ciated with domestic gold prices in the period of study. Gold is considered to be precious, highly liquid, financial instrument which has the characteristics of both commodity and currency but due to tangibility it is different form stocks
[11]. The causal relationship among stock prices and gold price is developed in developing countries to understand that gold price is influenced by stock market
[12]. According to World Gold council report, India is the world’s largest single market for the consumption of gold. This leads to include macro and other market indicators such as crude oil price, exchange rate, interest rate, inflation for future research [13].
The relationship between prices of oil and gold, exchange rate and equity markets of Taiwan, China, Japan, United State (US) and Germany is studied by Wang, et al.[14]. It was found that there exists long-run cointegration among all variables in each country except for UST. The findings supported that there exist bidirectional relationship between crude oil, gold and Taiwan stock market. Similar variables were considered for Indian context also and found that there is long-run cointegration among all variables under study [15]. The findings of this research have several implications especially in terms of portfolio diversification. There are several studies that have investigated the relationship between gold prices and the stock indices. The causal relationship between gold prices and stock index (S & P CNXNIFTY) of NSE of India was studied [16]. The impact of domestic gold prices on the stock indices of two Indian stock exchanges was
examined, BSE and NSE and showed that in the short run there is bidirectional causality between gold prices and S & P CNX NIFTY and also between BSE, Sensex and gold prices [2]. The researchers extended their research to conduct a study on multiple commodity markets like oil and gold, stock indices and mi-croeconomic variables like exchange rate of a country’s currency, interest rates and inflation rates to study relationship among them. Phoong, et al.[17] studied the effect of oil prices and gold prices on stock market indices of Malaysia, Sin-gapore, Thailand and Indonesia. The relationship among gold prices, Bombay Stock Exchange’s Sensex, National Stock Exchange’s Standard and Poor’s (S & P) Financial Services LLC CNX NIFTY (S & P CNX NIFTY) and US dol-lar/Indian rupee (USD/INR) exchange rate for the period January 1998-April 2014 was studied by Atul Shiva and Monica Sethi [18] and the results revealed that that gold prices, SENSEX, USD/INR and S & P CNX NIFTY are in equili-brium in the short run and long run.
The existence of unidirectional or bidirectional relationship between gold price and Sensex for the period of 10 years (2002-2012) was studied by Narang and Raman [19]. The results of the analysis show that there is no causality be-tween the gold price and Sensex. The results revealed that returns of Sensex in-dex does not lead to increase in gold price and rise in gold price does not lead to increase in Sensex.
Studies have revealed that there exist long-run and short run relationships among stock price index and gold price in developed and developing countries. There was no relationship with the stock market and gold rate and the gold prices do not increase because of stock market [20], [21]. Yahyazadehfar, et al. [12], Mishra, et al.[13] and Le & Chang [22] confirmed that there is a significant relationship with the stock market and gold rate and the increase gold rate is due to stock market. Le and Chang [22] examined the association between gold price and crude oil price based on monthly time series data from 1986 to 2011 and showed that both the variables are closely linked with each other. A study was conducted during 2nd January 1991 and 10th August 2012 using daily time se-ries data to see the influence of Indian stock market index (Sensex and Nifty) on Indian gold price or the relationship between Indian gold price and Indian stock market index (Sensex and Nifty) and the results revealed that gold price in India was increased during the study period because of stock market reaction in India along with other macro-economic factors.
Studies were conducted to understand the relationship between gold price and US Dollar. Various statistical tools were applied to study the behavior of gold with respect to exchange rates of various currencies against the US Dollar The US dollar and gold prices was found to move in opposite direction. For each ex-change rate considered, a typical weekly movement against the dollar generated a movement in the gold price [23].
According to Sindhu [24], the relationship an increase in gold price will result in decrease in the Dollar value, Gold price and crude oil price share a positive
relationship, increase in repo rates leads to decrease gold prices, and Gold prices and inflation rates are dependent and positively correlated.
Sujit [25] studied the relationship between Gold price, stock returns, Ex-change rate and Oil price. By considering the data from January 1998 to June 2011, from the time series analysis it was found that the relationship among these variables showed that Exchange rate is highly affected by stock returns, Exchange rate and Oil price.
Paper Reference Objective (s) Variables considered of interest/relevance for current study Findings/Conclusion/Implications
Macroeconomic Variables and Stock Price: New Evidence from Iran [12]
to understand how gold price
is influenced by stock market and stock market Gold Price
The causal relationship among stock prices and gold price is developed in developing countries
Relationships among Oil Price, Gold Price, Exchange Rate and International Stock Markets [14]
To study the relationship between prices of oil and gold,
exchange rate and equity markets of Taiwan, China, Japan,
United State (US) and Germany
Gold price, Oil prices, exchange rate and equity markets
It was found that there exist long-run cointegration among all variables in
each country except for UST. The findings supported that there exist bidirectional relationship between crude oil, gold and Taiwan stock market. Causal relationship between
gold price and S & P CNX NIFTY—An empirical study in Indian context. [16]
investigated the relationship between gold prices and the stock indices
Gold prices and Stock indices
The results revealed causal relationship between gold prices and stock index (S & P CNX NIFTY) of NSE of India
Dynamics between strategic commodities and financial variables. [22]
the influence of Indian stock market index (Sensex and Nifty)
on Indian gold price or the relationship between Indian gold price and Indian stock market index (Sensex and Nifty)
Gold prices and crude oil prices, sensex and Nifty
the results revealed that gold price in India was increased during the study
period because of stock market reaction in India along with other
macro-economic factors
A study on impact of select factors on the price of Gold [24]
To study the relationship between gold price, dollar value and crude oil price
Dollar value, Gold price and crude oil price
The results revealed that an increase in gold price will result in decrease
in the Dollar value, Gold price and crude oil price
Study on dynamic relationship among gold price, oil price,
exchange rate and stock market returns [25]
To study the relationship between Gold price, stock returns,
Exchange rate and Oil price
Gold price, Stock returns, exchange rate, oil price
From the time series analysis it was found that the relationship among these
variables showed that Exchange rate is highly affected by stock returns,
Exchange rate and Oil price.
3. Methodology
The statistical package SAS was used to get the Predictive model of the changes in the prices of gold using multiple linear regression).
3.1. Dependent Variable
The dependent variable in the study is Gold Prices. Gold has been used throughout history as money and has been a relative standard for currency equivalents specific to economic regions or countries, until recent times.
Many European countries implemented gold standards in the latter part of the 19th century until these were temporarily suspended in the financial crises
volving World War I. After World War II, the Bretton Woods system pegged the United States dollar to gold at a rate of US$35 per troy ounce. The system existed until the 1971 Nixon Shock, when the US unilaterally suspended the direct con-vertibility of the United States dollar to gold and made the transition to a fiat currency system. The last currency to be divorced from gold was the Swiss Franc in 2000.
Since 1919 the most common benchmark for the price of gold has been the London gold fixing, a twice-daily telephone meeting of representatives from five bullion-trading firms of the London bullion market. Furthermore, gold is traded continuously throughout the world based on the intra-day spot price, derived from over-the-counter gold-trading markets around the world (code “XAU”).
3.2. Variables
The various Independent that are assumed to affect the prices of Gold from the literature review in the short-run are as follows:
1) S & P 500: The S & P 500, or the Standard & Poor’s 500, is an American stock market index whose components and weights are determined by S & P Dow Jones Indices.
2) NIFTY: The NIFTY 50 index is National Stock Exchange of India’s benchmark stock market index for Indian equity market.
3) BSE: is the S & P Bombay Stock Exchange Sensitive Index. It is also known as the BSE 30 or simply the SENSEX, this is a free-float market-weighted stock market index of 30 in which the companies which are strong monetarily and are listed in Bombay Stock Exchange.
4) Indian Rupee Rate: The rupee, or more precisely the Indian rupee is the official currency of India. This is managed by reserve bank of India and its role is derived in the currency management based on Reserve Bank of India Act, 1934.
5) Crude Oil Price: The price of oil is the spot price of a barrel of standard crude oil. The price of a barrel of oil depends on its grade, which is based on the factors such as its specific gravity, sulphur content, and its location. The global macroeconomic conditions influence the demand for oil.
4. Data
The data were collected from a range of secondary resources. The historical data was gathered through government databases, private wealth management funds like Moody’s, Goldman Sachs and through NSE and BSE Databases available on-line.
Moody’s corporation is essential for the global capital markets which provide credit ratings, research tools and analysis. Moody’s analytics offers prominent software, advisory services and research for credit and economic analysis and fi-nancial risk management.
Goldman Sachs provides a variety of financial services to a diversified client base such as corporations, financial institutions, Governments and individuals.
The National Stock Exchange of India Ltd. (NSE) is the top stock exchange in India and the second largest in the world. It developed its systems using tech-nology for investment and ensures reliability. It also believes in the scale and breadth of its products and services and delivers innovation in both trading and non-trading businesses and provides high-quality data and services to the par-ticipants in the market and clients.
The Bombay Stock Exchange (BSE) is the first and largest securities market in India. It helped in the development of capital markets of the country which in-cludes retail debt market and also helped in the growth of the Indian corporate sector. The list of BSE includes stocks, stock futures, stock options index futures, index options and weekly options.
Analysis and Interpretation
Table 1 shows the model fit statistics of the regression model. The value of R2 is
0.576. It is the coefficient of determination. It denotes how well the data fits the model. An R2 of 1 indicates that the regression line perfectly fits the data, while
R2 of 0 indicates that the regression line does not fit the data at all. From the
given data it is observed that R2 is close to 0.6.Which shows that the regression
line fits the majority of the data. It indicates that there is 60% of the variability in the prices of gold is explained by the estimated multiple regression equation with the independent variables S&P 500, Currency, Sensex, Crude Oil Price, NIFTY. The values of R2 increases with increase of number of independent
va-riables.
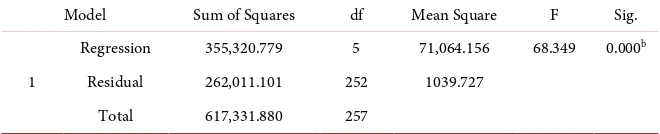
From Table 2, the 𝑝𝑝 value of the overall model is 0.000. The F test is used to determine whether there exists a significant relationship between the dependent variable and the set of independent variables. Since the p value is less than α val-ue (the α value is 0.05 i.e., 5%). It can be said the model is the significant and there exists a significant relationship between Gold prices and the independent variables S& P 500, Currency, Sensex, Crude Oil Price and NIFTY.
Table 1. Model summaryb.
Model R R Square Adjusted R Square Std. Error of the Estimate
1 0.759a 0.576 0.567 32.245
[image:7.595.209.539.631.698.2]a. Predictors: (Constant), S& P500, Currency, Sensex, Crude Oil Price, NIFTY; b. Dependent Variable: Gold Price (dep).
Table 2. ANOVAa.
Model Sum of Squares df Mean Square F Sig.
1
Regression 355,320.779 5 71,064.156 68.349 0.000b Residual 262,011.101 252 1039.727
Total 617,331.880 257
a. Dependent Variable: Gold Price (dep); b. Predictors: (Constant), S&P 500, Currency, Sensex, Crude Oil Price, NIFTY.
The multiple regression model that can be obtained from the coefficients Ta-ble 3 below is
0 1 1 2 2 3 3 4 4 5 5
1 2
3 4 5
Gold Prices, Crude Oil Price, Currency,
NIFTY, Sensex, S&P 500
y x x x x x
y x x
x x x
β β β β β β
= + + + + +
= = =
= = =
The hypotheses for the F test involving the parameters of the regression model is
0 1 2 3 4 5
H =β =β =β =β =β
Ha = one or more of the parameters is not equal to zero
As the p-value < 0.05, H0 is rejected abd we can conclude that there is
suffi-cient statistical evidence that one or more of the parameters is not equal to zero and that the overall relationship between gold prices and the independent va-riables S& P500, Currency, Sensex, Crude Oil Price and NIFTY is signifi-cant
The estimated regression equation from the coefficients table is
(
)
(
)
(
)
(
)
(
)
Y 2400.799 0.63 Sensex 0.195 Nifty 0.618 Crude oil price 12.928 Currency 0.154 S& 500
= − + +
− −
Since the F test shows that the multiple regression relationship is significant, a t-test is conducted to determine the significance of each of the independent va-riables.
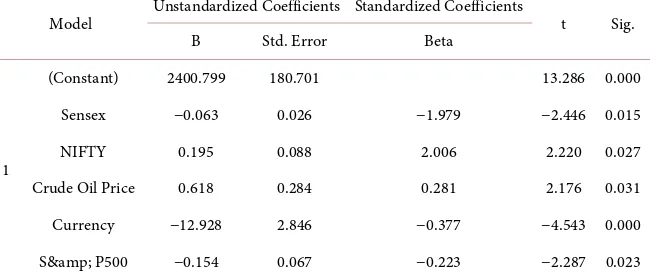
From Table 3, based on the t-test, the p values of all the variables is <0.05. It can be said that all the independent variables are significant and it can be con-cluded that H0: βi = 0, i = 1 to 5 independent variables S&P 500, Currency,
[image:8.595.213.538.570.710.2]Sensex, Crude Oil Price and NIFTY is rejected and hence all the independent va-riables are statistically significant. The positive value of B coefficient indicates that as the value of the variable increases gold prices increase and if the B value is negative the gold prices decrease. From the above table Nifty and crude oil prices have positive impact on gold prices whereas S&P 500, Currency, Sensex have negative impact on the gold prices. Hence, this gives a clear indication that
Table 3. Coefficientsa.
Model Unstandardized Coefficients Standardized Coefficients t Sig. B Std. Error Beta
1
(Constant) 2400.799 180.701 13.286 0.000 Sensex −0.063 0.026 −1.979 −2.446 0.015 NIFTY 0.195 0.088 2.006 2.220 0.027 Crude Oil Price 0.618 0.284 0.281 2.176 0.031 Currency −12.928 2.846 −0.377 −4.543 0.000 S& P500 −0.154 0.067 −0.223 −2.287 0.023
a. Dependent variable: Gold price (dep).
as the BSE Sensex, S & P 500 and the Indian Currency value increases, the price of gold decreases. However, the Crude Oil Price and the Nifty Index have posi-tive beta coefficients. This elucidates that as the NIFTY and the crude oil price increase the value of the gold also increases.
This can be further proven by the following graphs depict the data points in which the Y axis is the Gold Price and X axis are the significant variables i.e.
[image:9.595.228.521.203.440.2]currency. Since the B coefficient for currency is a negative value there is a rela-tionship between gold price and currency (Figures 1-3).
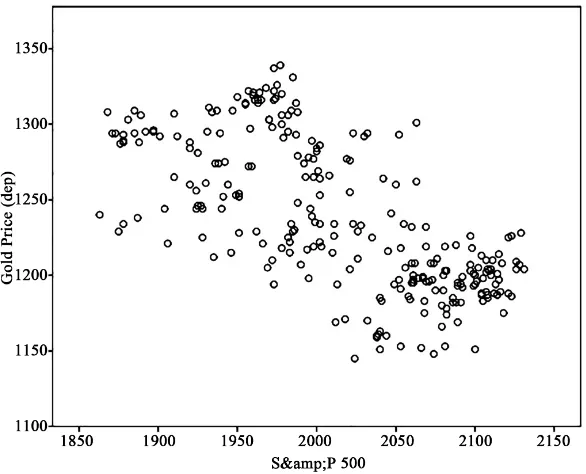
Figure 1. Gold Price and S&P 500.
Figure 2. Scatter plot for gold price and sensex.
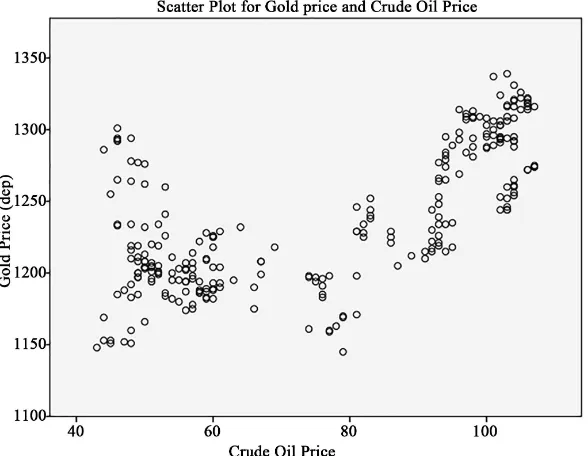
[image:9.595.231.525.472.709.2]Figure 3. Scatter plot for gold price and crude oil price.
The Scatter diagram of Gold Price and S&P 500 indicates that the rela-tionship between gold price and this independent variable is negative and the degree of relationship is low which is also evident from the scatter plot.
Since the B coefficient for Sensex is a negative value the graph indicates that though there is a relationship between gold price and Sensex the curve is down-ward showing that there is a decrease in the gold price as there is a change in the Sensex value.
Since the B coefficient for Crude Oil Price is a positive value the graph indi-cates that there is a relationship between gold price and Crude oil price is in-creasing showing that there is an Increase in the gold price as there is a change in the Crude oil price.
5. Conclusions
The study provides a comprehensive analysis of the independent factors that af-fect the value of Gold and a best fit model is also achieved. This model has been proven to be applied to the pragmatic world. The various tools used to identify the variables and analyze a best fit regression model are SPSS and SAS, and a li-near regression analysis was conducted so as to find out a predictive model.
First, the literature review revealed that the Gold prices i.e., the target va-riables is affected by several other independent vava-riables. From the independent variables considered Nifty and Crude oil price are positively related and Sensex, Currency and S& 500 are negatively related. However, the extant literature enabled to eliminate all the unnecessary independent variables and get the scope of the study.
Second, the analysis and interpretation of the data revealed the significance of the independent variables, the significance of the regression equation and the
model fit. It was known that only three variables were significant in the regres-sion model to the gold prices, namely, Currency data, NIFTY and BSE.
As the model’s R2 was close to 60%, this model can further be used for data analysis and predicting the prices of the gold in the spot market.
The optimism is also reflected in the performance of the model, and an analy-sis was conducted to observe the predictability of gold price in the spot market. The answer revealed that the regression equation was accurate by a close margin.
6. Current Scenario of Indian Gold Market
According to the World Gold Council (WGC), the demand for gold in India is expected to improve based on the efforts by Government to raise the income of the rural population and improving the macroeconomic indicators. Further, the Union Budget has also announced certain measures to increase the rural income. It is also observed that the overall demand for gold in the first quarter is lowered by 12% compared to earlier period as the demand for jewellery decreased to the lowest in the last 10 years due to increase in gold prices. The WGC report also highlighted that the focus on unaccounted income by the Government as the re-tail investors became very keen on this and the demand for bars and coins in In-dia has dropped
7. Limitations and Future Study
The study has not focused on qualitative factors and the study is short term as the data points were limited. The future study is to identify the qualitative fac-tors to a large extent. And as the study is short term the data points were limited, a long-term analysis can be conducted on the trend of gold prices as well and al-so on the policy changes i.e., the qualitative factors that affect the value of Gold.
Conflicts of Interest
The author declares no conflicts of interest regarding the publication of this pa-per.
References
[1] Turk, J. and Rubino, J. (2007) [2004]. The Collapse of the Dollar and How to Profit from It: Make a Fortune by Investing in Gold and Other Hard Assets (Paperback ed.). Doubleday, New York, 43 of 252.
[2] Bhunia, A. and Mukhuti, S. (2013) The Impact of Domestic Gold Price on Stock Price Indices—An Empirical Study of Indian Stock Exchanges. Universal Journal of Marketing and Business Research, 2, 35-43.
[3] Aggarwal, R. and Lucey, B.M. (2007) Psychological Barriers in Gold Prices? Review of Financial Economics, 16, 217-230. https://doi.org/10.1016/j.rfe.2006.04.001
[4] Rothbard, M.N. (1997) The Case for a Genuine Gold Dollar, The Gold Standard: Perspectives in the Austrian School. Edited with an Introduction by Llewellyn H. Rockwell, Jr. The Ludwig von Mises Institute. Auburn, Ala. pp. 116-130; The Gold Standard: An Austrian Perspective. Lexington, MA: D.C. Heath, 1985, pp. 1-17;
printed in The Logic of Action One: Method, Money, and the Austrian School. Glos, UK: Edward Elgar Publishing Ltd., 1997, pp. 364-383.
[5] Goodman, B. (1956) The Price of Gold and International Liquidity. Journal of Finance, 11, 15-28. https://doi.org/10.1111/j.1540-6261.1956.tb00683.x
[6] Fisher, I. (1930) The Theory of Interest. Macmillan, New York.
[7] Fortune, J.N. (1987) The Inflation Rate of the Price of Gold, Expected Prices, and Interest Rates. Journal of Macroeconomics, 9, 71-82.
https://doi.org/10.1016/S0164-0704(87)80007-1
[8] Mahdavi, S. and Zhou, S. (1997) Gold and Commodity Prices as Leading Indicators of Inflation: Tests of Long-Run Relationship and Predictive Performance. Journal of Economics and Business, 49, 475-489.
https://doi.org/10.1016/S0148-6195(97)00034-9
[9] Smith, K. (2018) How Gold Affects Currencies Investopedia
https://www.investopedia.com/articles/forex/11/golds-effect-currencies.asp#ixzz5O
89esJV7
[10] Gaur, A. and Bansal, M. (2010) A Comparative Study of Gold Price Movements in Indian and Global Markets. Indian Journal of Finance, 4, 32-37.
[11] Sumner, S.W., Johnson, R. and Soenen, L. (2012) Spillover Effects among Gold, Stocks, and Bonds.Journal of Centrum Cathedra, 2, 106-120.
[12] Yahyazadehfar, M. and Babaie, A. (2012) Macroeconomic Variables and Stock Price: New Evidence from Iran. Middle East Journal of Scientific Research, 11, 408-415.
[13] Mishra, R.N. and Mohan, G.J. (2012) Gold Prices and Financial Stability in India. RBI Working Paper Series, Department Of Economic And Policy Research, 2: 1-16. [14] Wang, M.L., Wang, C.P. and Huang, T.Y. (2010) Relationships among Oil Price,
Gold Price, Exchange Rate and International Stock Markets. International Research Journal of Finance and Economics, 47, 80-89.
[15] Bhunia, A. (2013) Cointegration and Causal Relationship among Crude Price, Do-mestic Gold Price and Financial Variables-An Evidence of BSE and NSE. Journal of Contemporary Issues in Business Research, 2, 1-10.
[16] Sreekanth, D. and Veni, L.K. (2014) Causal Relationship between Gold Price and S&P CNX NIFTY—An Empirical Study in Indian Context. Asian Journal of Re-search in Banking and Finance, 4, 253-265.
[17] Phoong, S.W., Ismail, M.T. and Sek, S.K. (2013) A Markov Switching Vector Error Correction Model on Oil Price and Gold Price Effect on Stock Market Returns. In-formation Management and Business Review, 5, 331-336.
[18] Shiva, A. and Sethi, M. (2015) Understanding Dynamic Relationship among Gold Price, Exchange Rate and Stock Markets: Evidence in Indian Context. Global Busi-ness Review, 16, 93S-111S.https://doi.org/10.1177/0972150915601257
[19] Narang and Raman (2017) Causal Relationship between Gold Price and Sensex: A Study in Indian Context. Vivekananda Journal of Research, 1, 33-37.
[20] Shahzadi, H. and Chohan, M.N. (2012) Impact of Gold Prices on Stock Exchange: A Case Study of Pakistan. Working Paper Series, Karachi Stock Exchange, No. 10, 1-12.
[21] Kaliyamoorthy, S. and Parithi, S. (2012) Relationship of Gold Market and Stock Market: An Analysis. International Journal of Business and Management, 2, 1-6. [22] Le, T. and Chang, Y. (2011) Dynamics between Strategic Commodities and
Finan-cial Variables. Working Paper Series, Economic Growth Centre, Nanyang
nological University, Singapore.
http://egc.hss.ntu.edu.sg/research/workingpp/Pages/2011.aspx
[23] Capie, F., Terence, C.M. and Wood, G. (2005) Gold as a Hedge against the Dollar.
International Financial Markets, Institution and Money, 15, 343-352.
https://doi.org/10.1016/j.intfin.2004.07.002
[24] Sindhu (2013) A Study on Impact of Select Factors on the Price of Gold. IOSR Journal of Business and Management, 8, 84-93.
[25] Sujit, K.S. (2011) Study on Dynamic Relationship among Gold Price, Oil Price, Ex-change Rate and Stock Market Returns. International Journal of Applied Business and Economic Research, 9, 145-165.