Munich Personal RePEc Archive
The Biocultural Origins of Human
Capital Formation
Galor, Oded and Klemp, Marc
Brown University, Brown University and University of Copenhagen
29 April 2014
Online at
https://mpra.ub.uni-muenchen.de/55636/
The Biocultural Origins of Human Capital Formation
∗Oded Galor Marc Klemp
April 29, 2014
Abstract
This research explores the biocultural origins of human capital formation. It presents the first evidence that moderate fecundity was conducive for long-run reproductive success within the human species. Exploiting an extensive geneal-ogy record for nearly half a million individuals in Quebec during the seventeenth and eighteenth centuries, the study traces the number of descendants of early inhabitants in the subsequent four generations. Using the time interval between the date of marriage and the first live birth as a measure of reproductive capac-ity, the research establishes that while a higher fecundity is associated with a larger number of children, an intermediate level maximizes long-run reproduc-tive success. The finding further indicates that the optimal level of fecundity was below the population median, suggesting that the forces of natural selection favored individuals with a lower level of fecundity. The research lends credence to the hypothesis that during the Malthusian epoch, natural selection favored individuals with a larger predisposition towards child quality, contributing to human capital formation, the onset of the demographic transition and the evo-lution of societies from an epoch of stagnation to sustained economic growth.
KeywordsDemography, Evolution, Human Capital Formation, Natural Selec-tion, Fecundity, Quantity-Quality Trade-Off, Long-Run Reproductive Success
JEL Classification Codes J10, O10
∗The authors wish to thank Carl-Johan Dalgaard, Moshe Hazan, Nicolai Kaarsen, Omer Moav and Yona
1
Introduction
The transition from an epoch of stagnation to an era of sustained economic growth has triggered one of the most significant transformations in the course of human history. While living standards in the world economy stagnated during the millennia preceding the Industrial Revolution, income per capita has experienced an unprecedented tenfold increase over the past two centuries, profoundly altering the level and distribution of education, health, and wealth across the globe.1
Over most of human existence, the process of development was marked by Malthusian stag-nation. The Malthusian pressure has governed the evolution of the size of the population, and conceivably, via the forces of natural selection, has shaped the composition of the population as well. Lineages of individuals whose traits were complementary to the economic environment gen-erated higher income, and thus a larger number of surviving offspring. The gradual increase in the representation of these growth-enhancing traits in the population presumably has contributed to the process of development and the take-off from stagnation to growth (Galor, 2011).2
In particular, it was hypothesized that during the Malthusian epoch, natural selection brought about a gradual increase in the representation of traits associated with preferences for offspring quality in the population (Galor and Moav, 2002). The effect of this evolutionary process on investment in human capital stimulated technological progress and contributed to the reinforcing interaction between investment in human capital and technological progress that triggered the demographic transition and brought about a state of sustained economic growth.
This research explores the biocultural origins of human capital formation. It presents the first evidence that moderate fecundity was conducive for long-run reproductive success within the human species. It further suggests that individuals with lower levels of fecundity than the median in the population generated an evolutionary advantage in the pre-demographic transition era. These findings lend credence to the hypothesis that during the Malthusian epoch, natural selection favored individuals with a larger predisposition towards child quality, contributing to human capital formation, the onset of the demographic transition and the evolution of societies from an epoch of stagnation to sustained economic growth.3
1
The transition from stagnation to growth and the associated divergence of income per capita across the globe have been the subject of intensive research in the growth literature in recent years (Galor and Weil, 1999, 2000; Galor and Moav, 2002; Hansen and Prescott, 2002; Lucas, 2002; Galor, 2011).
2
Evidence suggests that the composition of existing genetic traits may experience rapid evolutionary processes. Voight et al. (2006) detected about 700 regions of the human genome where genes have been reshaped by natural selection within the last 5,000 to 15,000 years. Other notable evidence suggests that lactose tolerance was developed among Europeans and Near Easterners since the domestication of dairy animals in the course of the Neolithic revolution, whereas in regions that were exposed to dairy animals in later stages, a larger proportion of the adult population suffers from lactose intolerance. Furthermore, genetic immunity to malaria provided by the sickle cell trait is prevalent among descendants of Africans whose engagement in agriculture improved the breeding ground for mosquitoes and thereby raised the incidence of malaria, whereas this trait is absent among descendants of nearby populations that have not made the transition to agriculture (Livingstone, 1958; Wiesenfeld, 1967; Durham, 1982).
3
The interaction between human evolution and the process of development, as was further explored theoreti-cally by Lagerl¨of (2007); Galor (2005); Galor and Michalopoulos (2012), is applicable to either cultural or genetic intergenerational transmission of entrepreneurial traits (Bisin and Verdier, 2000; Cavalli-Sforza, 1981; Boyd, 1988; Weibull, 1997; Bowles, 1998). The long lasting effects of these historically determined genetic factors on comparative
The influential life-history theory in the field of evolutionary biology suggests that fecundity of organisms reflects a trade-off in reproductive success between the quantity and quality of offspring. Central to the theory is the supposition that there exists an optimal level of fecundity beyond which fitness diminishes.4
A negative association between the quantity and the quality of offspring has been documented in a wide variety of species, ranging from plants to humans. In particular, researchers uncovered an inverse relationship between the number of seeds and their size as well as between the quantity and quality of offspring within and across mammals.5
Moreover, a trade-off between fertility on the one hand and offspring survival probability and education on the other hand has been documented for pre-industrial human societies.6
However, the exploration of the static trade-off between quantity and quality of offspring, while confirming an important building block of life-history theory, does not generate direct evidence about the effect of fecundity on long-run reproductive success.7
This research presents evidence of the effect of fecundity on long-run reproductive success within the human species. Exploiting an extensive genealogy record for nearly half a million individuals in Quebec between the 17th and the 18th centuries, the study traces the number of descendants of early inhabitants of this Canadian province in the subsequent four generations. Using the time interval between the date of marriage and the first live birth as measure of fecundity over this period, the research establishes that while higher fecundity is associated with a larger number of children, an intermediate level is conducive for long-run reproductive success.
The research finds that the maximal reproductive success is attained by couples with a moderate level of time to first birth (i.e., those whose first delivery occurs 65 weeks after their marriage, in comparison to a sample median of 53 weeks). In particular, in comparison to highly fertile couples whose first child is born 38 weeks after the marriage, those individuals have on average 0.3 fewer children, but 0.6 more grandchildren, 9.5 additional great-grandchildren, and 15 added great-great-grandchildren (in comparison to a sample mean of 294).
The research establishes that there are two related mechanisms that generate the observed hump-shaped effect of fecundity on reproductive success in the long run. First, the number of surviving offspring are not monotonic in the level of fecundity, reflecting an adverse effect of the number of children on the survival probability of each child. Second, the number of children may come on the account of their human capital, and thus conditional on survivability, it may affect their standard of living and ultimately their reproductive success.
In light of the heritability of fecundity, the finding that the optimal level of time to first birth is above the population median may suggest that in pre-industrial Quebec, the representation of
development have been established by Galor and Moav (2007); Spolaore and Wacziarg (2009); Ashraf and Galor (2013); Ashraf et al. (2014).
4
See Lack et al. (1954); Cody (1966); Roff (1992); Stearns (1992). 5
See Salisbury et al. (1942); Harper et al. (1970); Roff (2002); Charnov and Ernest (2006); Walker et al. (2008). 6
See Hill and Hurtado (1996); Strassmann and Gillespie (2002); Gillespie et al. (2008); Meij et al. (2009); Becker et al. (2010).
7
individuals with lower levels of fecundity has gradually increased in the population.8
Thus, plau-sibly, the forces of natural selection favored individuals characterized by a lower level of fecundity, and hence a larger predisposition towards a quality strategy. These findings support the hypothesis that during the Malthusian epoch, natural selection favored individuals with a larger predisposi-tion towards child quality, contributing to human capital formapredisposi-tion, the onset of the demographic transition and the evolution of societies from an epoch of stagnation to sustained economic growth.
2
Empirical Strategy
Two major obstacles affect the identification of the effect of fertility on long-run reproductive suc-cess. First, omitted correlates of offspring quantity may also be correlated with offspring quality, obscuring the effect of quantity on long-run reproductive success. For instance, if variations in resources across individuals (e.g., income and education) enable some parents to produce more off-spring of higher quality, failing to account for the effect of resources will obscure the effect of child quantity on long-run reproductive success. In particular, an observed monotonically positive rela-tionship between the number of children and that of grandchildren may misleadingly be interpreted as indicative of the lack of an optimal level of quantity beyond which fitness diminishes.
Second, reverse causality from offspring’s quality to the aggregate quantity of offspring may obscure the presence or the absence of an optimal level of fecundity beyond which fitness dimin-ishes. For instance, the adverse effect of low offspring quality on the offspring survival rate may contribute to the total number of offspring born (via the child replacement channel), generating a negative correlation between the long-run reproductive success and the quantity of offspring that has no bearing on the presence or the absence of an optimal level of quantity beyond which fitness diminishes.
This research mitigates these major hurdles by focusing on the effect of fecundity, rather than fertility, on reproductive success. Furthermore, it designs an empirical strategy that exploits the inherent uncertainty in the process of human reproduction to identify the effect of fecundity on reproductive success. In particular, in light of the social norm observed in pre-industrial Quebec, in which marriage marked the intention to conceive, the research exploits variation in the random component of the time interval between the date of first marriage and the first birth (TFB) to capture the effect of fecundity on fitness.
Indeed, as depicted in Figure 1, a marriage over this period signaled a deliberate attempt to conceive. A sharp spike in birth rates occurs starting in the 35th week after marriage and nearly a third of births occurs within the 36–44 weeks time interval.9
Furthermore, premarital conception is insignificant, reflecting possibly an adherence to the existing social and religious norms. In
8
For the heritability of fecundity, see Christensen et al. (2003); Pettay et al. (2005); Ramlau-Hansen et al. (2008); Kosova et al. (2009). In the Quebec sample TFB is heritable and the coefficient of heritability,h2, is 0.04.
9
Full term babies are born upon 38 weeks of gestation. Nevertheless, pregnancy is considered at term if the gestation period is within the interval 36-40 weeks. However, since the marriage age may coincide with the ovulation period and may occur at most 4 weeks before it, time to first birth within the interval 36–44 weeks would correspond to babies born at term.
0 1 2 3 4 5
Percentage of observations
0 38 142
[image:6.612.91.529.77.361.2]Weeks from marriage to first birth
Figure 1: The histogram depicts the durations (in weeks) from first marriages to first births of 53,154 mothers in Quebec between the 17th and the end of the 18th century who gave birth between the 7th and 728th day of their marriage date.
particular, only 7.9 percent of the births over this period occurred within 35 weeks of marriage, and the incidence of premature births suggests that even this small fraction overstates the share of babies conceived prior to marriage.10
Since fecundity reflects genetic and socio-environmental factors, TFB is affected by genetic predisposition, socio-environmental conditions, as well as the realization of random elements that affect conception. Accounting for a range of genetic and socio-environmental confounding factors that may affect the time to first birth, reproductive success, and the quality of offspring, the study attempts to isolate the effect the random variations in TFB across individuals. In particular, genetic, as well as cultural and socio-economic factors that may affect fecundity are accounted for by the inclusion of Maternal Founder fixed effects. Namely, the effect of fecundity on reproductive success is identified based on variations in reproductive success among siblings, capturing the similarities in the genetic predisposition of these genetically linked individuals, as well as their cultural and socio-economic proximity.
10
Additional confounding variations between siblings are accounted for by the inclusion of dum-mies for their marriage age, birth year, gender, and literacy. Furthermore, additional control variables include the geographic location at birth and death, birth order, month of birth, month of birth of the firstborn, number of marriages, and immigration and emigration status of the spouse, for each head of lineage.
3
Data and Main Variables
This section sets the stage for the empirical examination of the hypothesis that higher fecundity in the pre-demographic transition era was associated with a larger number of children, while an intermediate level maximized long-run reproductive success.
3.1 Data
The data is based on the demographic history of Quebec, using the reconstructed genealogy based on the entire parish registers of Quebec, covering 471,412 individuals from the beginning of the French colonization in the 17th century to the turn of the 19th century.11
The data covers all parishes of Quebec, and thus in light of negligible inter-provincial migration, intra-provincial migration does not prevent the tracking of reproductive success of individuals over several generations. Indeed, more than 94% of these individuals were born and died in Quebec.
The analysis focuses on the reproductive success of individuals who were born in Quebec prior to and including 1685, died in the province, and had at least one great-great grandchild.12
The focus on the reproductive success of heads of lineages born prior to and including 1685 permits tracing of most descendants of these individuals in the subsequent four generations, while accounting for the Maternal Founder fixed effects.13
Furthermore, immigrants among heads of lineages are excluded from the sample for two reasons. First they may differ systematically from natives, reflecting the circumstances that led to their decision to immigrate as well as the effects of immigration on their socio-economic status and thus their reproductive success. Second, reproduction of immigrants prior to their arrival to Quebec is unknown. Similarly, emigrants are excluded as well since they may possess unique attributes and their subsequent marriages and births outside of Quebec are not observed.
11
The data is provided byLe Programme de recherche en d´emographie historiqueat the University of Montreal. 12
All children of these heads of lineages, virtually all grandchildren, and most of the descendants in the third and the fourth generations are observed. In particular, fewer than 2.5% of the head of lineages that satisfy the sample selection criteria produced a birth after age 60, implying that fewer than 0.1% of lineages produced a grandchild after 115 years. Systematic association between the birth year of the head of the lineage and the number of unobserved descendants in the third and fourth generations are accounted for by the inclusion dummies for the birth year of the heads of lineages.
13
The use of alternative time intervals would not affect the qualitative results. In particular, as established in Tables A.7 and 3, the main results are qualitatively unchanged if the analysis focuses on the reproductive success of heads of lineages born: (i) over the entire sample period (ii) in 1660–1685.
The study focuses on individuals whose time from first marriage to first birth is at least 38 weeks.14
Finally, the study follow the convention in the literature (e.g. Milot et al. (2011)) and restricts the sample to individuals whose time to first conception is less than 2 years, excluding 11.5% of this subset.15
This further restriction is designed to mitigate the effect of extreme values of time to first birth which may reflect measurement errors or underlying biological conditions that may directly affect long-run reproductive success. Thus the analysis focuses on the reproductive success of 3,798 heads of lineages in the pre-1685 period that satisfy the entire sample restrictions.16
3.2 Main Variables
3.2.1 Dependent and Independent Variables
In the main analysis that explores the effect of TFB on reproductive success, the dependent variable is the number of offspring of each head of lineage in the subsequent four generations (i.e., children, grandchildren, great-grandchildren and great-great-grandchildren). In the additional analysis that examines the mechanism through which TFB affects long-run reproductive success, the dependent variables are the number of children surviving to the average marriage age, and the fraction of literate children amongst children with known literacy status. The independent variable throughout the analysis is time interval between the first marriage date of the head of a lineage and the birth date of the individual’s first child (TFB).17
3.2.2 Maternal Founder Fixed Effects
The effect of fecundity on reproductive success may be affected by variation in genetic predispo-sition among genetically distinct individuals, as well as variation in cultural and socio-economic background. Hence, similarities in the genetic, cultural, and socio-economic characteristics across siblings within each household are exploited to isolate the effect of random variation in TFB on reproductive success. Accounting for Maternal Founder fixed effects, as well as the confounding factors underlined below, the analysis explores the effect of random variation in TFB on long-run reproductive success within lineages headed by siblings, as opposed to across all heads of lineages.
3.2.3 Control Variables
The analysis accounts for the confounding effects of the marriage age, birth year, literacy, and the maternal identity, for each head of lineage. Furthermore, additional control variables include the
14
For the 8.2 percent of the individuals in the sample of non-migrating heads of lineages whose firstborn’s date of birth is unknown, it is estimated to be one week prior to the date of baptism.
15
The average time to first birth in the sample is about 62 weeks, exceeding the median of about 53 weeks, reflecting a long right tail of the distribution of time to first birth.
16
The summary statistics for this sample can be found in Table A.1. 17
geographic location at birth and death, birth order, month of birth, month of birth of the firstborn, number of marriages, and immigration and emigration status of the spouse, for each head of lineage. The confounding associations between the marriage age of heads of lineages and their affluence, fecundity, and reproduction is accounted for by the inclusion of dummy variables indicating the marriage age of heads of lineages. The marriage age is associated with reproductive success through three channels. First, fecundity is affected by age (Baird et al., 2005). Second, the marriage age affects the length of the reproductive period of the couple. Third, in the pre-demographic transition era that corresponds to our sample, the marriage age was inversely related to the affluence of individuals, and marriage age and its potential association with affluence could have had an independent effect on long-run reproductive success.
The time-path of socioeconomic and demographic factors may differentially affect fecundity and reproductive success across cohorts of heads of lineages. In particular, the affluence, fecundity, and reproductive success of heads of lineages may be affected by the socioeconomic and demographic conditions during their lifetime, as partly captured by their birth year. These confounding fac-tors are accounted for by the inclusion of dummy variables indicating the birth year of heads of lineages.18
The human capital attainment that may reflect the socioeconomic status of heads of lineages may affect their TFB and reproductive success. This confounding factor is partly accounted for by the inclusion of the literacy status of heads of lineages, inferred from the existence of a signature (rather than a mark) on the marriage certificate. Additional confounding variations between heads of lineages are accounted for by the inclusion of dummies capturing gender, geographic location at birth and death, birth order, month of birth, month of birth of the firstborn, number of marriages, and immigration and emigration status of the spouse.
Finally, variations in socioeconomic and physiological factors across heads of lineages may gen-erate variation in the length of the reproductive period that may obscure the effect of TFB on reproduction. In particular, conditional on the marriage age, the age at last delivery determines the length of the reproductive period. Hence, to account for the potential effect of the stoppage age, in part of the analysis, dummy variables indicating the stoppage age of heads of lineages, in addition to the marriage age, are introduced to account for this confounding factors, permitting the study to capture the effects of TFB on fertility, for a given length or reproductive period.19
4
Empirical Analysis
This section examines the proposed hypothesis that higher fecundity in the pre-demographic tran-sition era was associated with a larger number of children, while an intermediate level maximized long-run reproductive success. The examination proceeds in two stages. The empirical regularities
18
In addition, the inclusion of birth year dummies mitigates the potential systematic associations between the birth year and the number of unobserved descendants after three or four generations.
19
As depicted in Figure A.1, the stoppage age over this period marked the decline in fecundity and onset of sterility associated with age-related infertility and onset of menopause, with a modal stoppage age of 41.
that emerge from the data are examined initially semi-parametrically, using cubic spline regression models, followed by an examination using OLS regressions models.
4.1 Semi-Parametric Analysis
The proposed hypothesis is confirmed initially using restricted cubic spline regression models. It establishes that while a higher fecundity is associated with a larger number of children, an inter-mediate level maximizes long-run reproductive success.20
The effect of TFB of heads of lineages on their number of descendants in the subsequent four generations, accounting for the birth year and the marriage and stoppage age of heads of lineages, is depicted in Figure 2. In line with the proposed hypothesis, panel A shows an approximately linear negative partial effect of TFB on the number of children, confirming the conventional presumption that ceteris paribus, a short time to first birth in the pre-demographic transition era increased the number of children. In contrast, as hypothesized, an intermediate TFB maximizes long-run reproductive success. In particular, panel B depicts a hump-shaped relation between TFB of heads of the lineages and their number of grandchildren. The TFB of heads of lineages that maximizes the number of grandchildren is associated with 48 grandchildren. Panels C and D reveal a similar a hump-shaped relation between TFB of the heads of the lineages and their great-grandchildren and great-great-grandchildren. The TFB of heads of lineages that maximizes the number of great-grandchildren is associated with 194 great-grandchildren, whereas the optimal TFB of heads of lineages for reproductive success in the 4rd generation (62 weeks) is associated with 306 great-great-grandchildren.
Thus, Figure 2 shows that, in accordance with the proposed hypothesis, TFB of heads of lineages has a monotonically negative effect on the number of children and a hump-shaped effect on the number of grandchildren, great-grandchildren and great-great-grandchildren.21
Thus, heads of lineages with an intermediate level of TFB achieved the maximal number of descendants in the long run, despite having a smaller number of children relative to those with lowest TFB.
4.2 Econometric Model
The negative relationship between TFB of heads of lineages and the number of children, as well as the hump-shaped relationship between TFB of heads of lineages and long-run reproductive success, is further assessed by estimating a series of quadratic regression models. First, the effect of TFB of the head of lineage on the number of children is estimated using the OLS regression model:
lnDi,1 =β0,1+β1,1T F Bi+Ziβ2,1+εi,1,
whereDi,1is the number of children (i.e., offspring in generation 1) born to head of lineagei;T F Bi
is the time from the first marriage to the first birth of the head of lineagei;Ziis a vector of control
variables capturing the characteristics of the head of lineagei; and εi,1 is an error term clustered
20
The use of multivariate LOWESS results in a similar qualitative pattern. 21
8.5
9
9.5
10
10.5
Predicted no. of children
38 142
Weeks from marriage to first birth
A
40
42
44
46
48
50
Predicted no. of grandchildren
38 142
Weeks from marriage to first birth
B
140
160
180
200
Predicted no. of g.grandchildren
38 142
Weeks from marriage to first birth
C
200
250
300
Predicted no. of g.-g.-grandchildren
38 142
Weeks from marriage to first birth
[image:11.612.76.536.132.586.2]D
Figure 2: Predicted number of descendants with 90% confidence interval as a function of TFB based on restricted cubic splines with three knots, for 3,798 heads of lineages. Dummies indicating birth year and marriage and stoppage age are included in the underlying regressions. (A) Number of children. (B) Number of grandchildren. (C) Number of great-grandchildren. (D) Number of great-great-grandchildren.
at the level of heads of lineages sharing the same firstborn. The coefficient of interest isβi,1 and it is predicted to be negative, i.e., TFB of heads of lineages negatively affects the number of children. Second, the effect TFB of heads of lineages and long-run reproductive success is estimated using the OLS regression model:
lnDi,t =β0,t+β1,tT F Bi+β2,tT F B 2
i +Ziβ3,t+εi,t,
whereDi,t is the number of descendants that the head of household i, has in the subsequent three
generations t, t = 3,4; T F Bi is the time from the first marriage to the first birth of the head of
lineage i; Zi is a vector of control variables capturing the characteristics of the head of lineage i;
and εi,t is an error term clustered at the level of heads of lineages sharing the same firstborn.22
The coefficients of interest are β1,t andβ2,t. The prediction is thatβ1,t>0 and β2,t <0, i.e., TFB
has a hump-shaped effect on the number of grandchildren, great-grandchildren and great-great-grandchildren.
4.3 Estimation based on Variation across all Heads of Lineages
The baseline OLS estimates of the effect TFB of the head of lineage on reproductive success are presented in Tables 1 and 2, accounting for the marriage age and the birth year of heads of lineages. The initial estimates in Tables 1 are based on variation in TFB across all head of lineages, whereas those in Table 2 accounts for Maternal Founder fixed effects, and thus presents estimates based on variation in TFB within heads of lineages that are originated from the same mother.
Consistently with the first element of proposed hypothesis, and the pattern depicted in Figure 2, panel A, column 1 establishes a highly significant negative association between TFB of heads of lineages and the number of children. An increase in the TFB by one year results in a reduction of 0.068 in the log number of children. In particular, an increase in TFB from 38 weeks to 1 year and 38 weeks would result in a reduction of approximately 0.72 children.23
The positive association of an intermediate level of TFB and long-run reproductive success is confirmed in columns 2–3, resembling the pattern depicted in Figure 2, panel C–D. Column 2 establishes a significant quadratic relationship between TFB of heads of lineages and the number of great-grandchildren.24
In particular, the first-order effect of the quadratic expression is positive and significant at the 5% level and the second-order effect of the quadratic expression is negative and significant at the 5% level. Moreover, an additional test establishes a significant hump-shaped relationship (p=0.01).25
Similarly, column 3 establishes a highly significant quadratic relationship
22
To ensure that the logarithmic transformation is defined for extinct lineages, 1 is added to the number of descendants in all generations. The results are robust to alternative methods that could account for extinct lineages. In particular, Table 4 and Table A.5 demonstrates that the results are robust to the use of a GLM model with a negative binomial distribution and a logarithmic link function.
23
Throughout the analysis, estimates on the original scale of numbers of descendants are corrected for re-transformation bias in accordance with Duan (1983).
24
The analysis focus on the effect on long-run reproductive success and hence on the 3rd and the 4th generations. As is apparent from Figure 2, the effect on the 2nd generation is similar qualitatively but somewhat less significant.
25
Table 1: The association between the time to first birth (TFB) and the number of descendants for head of lineages born prior to and including 1685
(1) (2) (3) (4) (5) (6) (7) (8) (9) (10) (11) (12)
ln(descendants) in: Gen. 1 Gen. 3 Gen. 4 Gen. 1 Gen. 3 Gen. 4 Gen. 1 Gen. 3 Gen. 4 Gen. 1 Gen. 3 Gen. 4
TFB -.068*** .498** .788*** -.068*** .403* .674** -.083*** .314 .596** -.079*** .359* .626**
(.020) (.228) (.299) (.020) (.225) (.295) (.019) (.222) (.293) (.009) (.200) (.288)
TFB2 -.171** -.276*** -.145** -.246*** -.125* -.229** -.138** -.238***
(.073) (.095) (.073) (.094) (.072) (.094) (.064) (.092)
Literate .015 .373*** .497*** .010 .364*** .489*** -.049*** .297*** .442***
(.022) (.049) (.066) (.022) (.048) (.066) (.010) (.044) (.065)
Male .240*** .475*** .420*** -.007 .193*** .270***
(.021) (.041) (.050) (.010) (.039) (.052)
Stoppage age fixed effects No No No No No No No No No Yes Yes Yes
Number of observations 3,798 3,798 3,798 3,798 3,798 3,798 3,798 3,798 3,798 3,798 3,798 3,798
Adjusted R2 .019 .027 .307 .021 .052 .324 .052 .081 .334 .801 .291 .370
Joint sign.-level of TFB & TFB2 .001 .055 .007 .001 .084 .009 .000 .050 .006 .000 .012 .003
Maximizing TFB 1.458 1.427 1.389 1.369 1.254 1.302 1.297 1.314
Lower limit of 90% CI 1.095 1.158 .568 .970 -3.172 .718 .427 .825
Upper limit of 90% CI 1.678 1.585 1.632 1.543 1.513 1.491 1.501 1.490
Significance of hump-shape .010 .001 .023 .004 .041 .007 .015 .004
This table presents the results of a series of OLS regressions of the number of descendants in generationton time to first birth, i.e. T F BandT F B2
for heads of lineages born prior to 1685. Birth year and marriage age dummies are included as controls. Furthermore, stoppage age dummies are included in columns 10–12. A dummy indicating unknown literacy is included in the regressions underlying column 4–12. Standard errors clustered at the level of the firstborn are reported in parentheses. *p <0.10, **
p <0.05, ***p <0.01.
between TFB of heads of lineages and the number of great-great-grandchildren. The first and second-order effects are both significant at the one percent level, and jointly significant (p=0.007). Moreover, an additional test establishes a significant hump-shaped relationship (p=0.001).
Columns 4–6 establish that the results are robust to the inclusion of parental literacy as a control variable. The highly significant negative association between TFB of heads of lineages and the number of children is maintained and the coefficient is rather stable (column 4). Furthermore, a significant quadratic relationship between TFB of heads of lineages and the number of descendants in the second, third, and fourth generations is stable, although somewhat less significant (column 5-6). Moreover, the test for the hump-shaped relationship remains significant. In particular, it is highly significant for great-great grandchildren (p=0.004). Furthermore, literacy is positively associated with long-run reproductive success (columns 5–6). As will become apparent in Table 5, literacy (and its potential association with a quality bias) is positively associated with the number of surviving children, and is thus rewarding in the long run.
Furthermore, columns 7–9 establish that the results are robust to the inclusion of a control for gender. The highly significant negative association between TFB of heads of lineages and the number of children is maintained and the coefficient is rather stable (column 7). Furthermore, a quadratic relationship between TFB of heads of lineages and the number of descendants is stable and significant at the 5% level in the third and fourth generations (column 8–9). Moreover, the test for the significance of hump-shaped relationship remains significant in all configurations. In particular, it is highly significant for great-great grandchildren (p <0.007).
Finally, columns 10–12 establish that the results are robust to the inclusion of a control for the stoppage age. The highly significant negative association between TFB of heads of lineages and the number of children is maintained and the coefficient is rather stable (column 10). Furthermore, the quadratic relationship between TFB of heads of lineages and the number of descendants in th 3rd and the 4th generations is rather stable and significance (column 11-12). Moreover, the test for the significance of hump-shaped relationship remains below 5% in all configurations. In particular, it is highly significant for great-great grandchildren (p=0.004).
4.4 Estimation based on Variation within Head of Lineages traced to the same Maternal Founder
Table 2: The effect of the time to first birth (TFB) on the number of descendants for head of lineages born prior to and including 1685 – accounting for Maternal Founder fixed effects
(1) (2) (3) (4) (5) (6) (7) (8) (9) (10) (11) (12)
Gen. 1 Gen. 3 Gen. 4 Gen. 1 Gen. 3 Gen. 4 Gen. 1 Gen. 3 Gen. 4 Gen. 1 Gen. 3 Gen. 4
TFB -.043** .499** .751*** -.044** .492** .755*** -.052*** .457** .740*** -.064*** .528*** .775*** (.020) (.201) (.253) (.020) (.201) (.253) (.020) (.200) (.253) (.009) (.178) (.247)
TFB2 -.191*** -.298*** -.189*** -.301*** -.181*** -.297*** -.207*** -.312***
(.066) (.083) (.066) (.083) (.066) (.083) (.058) (.081)
Literate -.005 .141*** .135** -.003 .144*** .137** -.019 .121*** .108*
(.026) (.050) (.064) (.025) (.050) (.064) (.012) (.045) (.063)
Male .200*** .293*** .132** -.016 .082* .043
(.026) (.046) (.058) (.012) (.042) (.060)
Stoppage age fixed effects No No No No No No No No No Yes Yes Yes
Number of observations 3,798 3,798 3,798 3,798 3,798 3,798 3,798 3,798 3,798 3,798 3,798 3,798
Adjusted R2 .015 .039 .310 .016 .041 .310 .035 .052 .311 .806 .299 .360
Joint sign.-level of TFB & TFB2 .031 .002 0 .026 .002 0 .008 .002 0 0 0 0
Maximizing TFB 1.307 1.257 1.304 1.256 1.264 1.245 1.272 1.242
Lower limit of 90% CI .966 .994 .954 .995 .835 .97 1.016 .997
Upper limit of 90% CI 1.466 1.395 1.465 1.393 1.434 1.384 1.402 1.372
Significance of hump-shape .002 .000 .002 .000 .003 .000 .000 .000
This table presents the results of a series of fixed-effects regressions of the number of descendants in generationton time to first birth, i.e. T F BandT F B2
. All regressions account for Maternal Founder fixed effects. Birth year and marriage age dummies are included as controls. Furthermore, stoppage age dummies are included in columns 10–12. A dummy indicating unknown literacy is included in the regressions underlying column 4–12. Standard errors clustered at the level of the firstborn are reported in parentheses. *p <0.10, **p <0.05, ***p <0.01.
As established in Table 2, the qualitative results established in Table 1 are unaffected by the inclusion of Maternal Founder fixed effects. In particular, consistently with the first element of proposed hypothesis, column 7 establishes a highly significant negative association between TFB of heads of lineages and the number of children, accounting for the marriage age, birth year, literacy status and gender of the heads of lineages. An increase in the TFB by one year results in a reduction of 0.052 in the log number of children. In particular, an increase in TFB from 38 weeks to 1 year and 38 weeks would result in a reduction of approximately 0.76 children.
The beneficial effects of an intermediate level of TFB on long-run reproductive success is con-firmed in columns 8–9. They establish a significant hump-shaped effect of TFB of heads of lineages on the number of descendants in the third and fourth generations, accounting for the marriage age, birth year, literacy status and gender of the heads of lineages. In particular, the first and second order terms are jointly significant at the 5% level for great-grandchildren and great-great-grandchildren. Moreover, the hump-shaped relationship for great-great-grandchildren is p¡0.001. Furthermore, as established in columns 10–12 the findings are robust for the inclusion of control for the stoppage age.
The analysis suggests that the maximal reproductive success is attained by heads of lineages with a moderate TFB (i.e., those whose first delivery occurs 65 weeks after their marriage, in comparison to a sample median of 53 weeks), suggesting that the forces of natural selection may have had a positive effect on the median TFB in the population over this time period. In particular, in comparison to highly fertile couples whose first child is born 38 weeks after the marriage, those individuals have on average 0.3 fewer children, but 0.6 more grandchildren, 9.5 additional great-grandchildren, and 15 added great-great-grandchildren.
Thus, the regression analysis presented in Table 2 confirms the hypothesis that higher fecundity in the pre-demographic transition era was associated with a larger number of children, while an intermediate level maximized long-run reproductive success.
Reassuringly, the main results are qualitatively unchanged if the analysis focuses on the repro-ductive success of heads of lineages born over the 1660-1685 period (Table 3), and over the entire sample period (Table A.7). Furthermore, the main results are robust to the use of GLM regression (Table 4).
5
Robustness to Additional Attributes of Heads of Lineages
Table 3: The effect of the time to first birth (TFB) on the number of descendants for head of lineages born 1660–1685 – accounting for Maternal Founder fixed effects
(1) (2) (3) (4) (5) (6) (7) (8) (9) (10) (11) (12)
Gen. 1 Gen. 3 Gen. 4 Gen. 1 Gen. 3 Gen. 4 Gen. 1 Gen. 3 Gen. 4 Gen. 1 Gen. 3 Gen. 4
TFB -.053** .537** .788*** -.054*** .529** .788*** -.063*** .480** .760*** -.065*** .491*** .730*** (.021) (.212) (.267) (.021) (.213) (.268) (.021) (.212) (.268) (.010) (.188) (.264)
TFB2 -.211*** -.322*** -.209*** -.322*** -.197*** -.315*** -.200*** -.307***
(.070) (.088) (.070) (.088) (.070) (.088) (.062) (.087)
Literate -.022 .121** .116* -.024 .117** .114* -.025** .107** .086
(.028) (.054) (.067) (.027) (.053) (.067) (.012) (.048) (.067)
Male .199*** .309*** .176*** -.023* .113*** .119*
(.027) (.048) (.060) (.012) (.044) (.063)
Stoppage age fixed effects No No No No No No No No No Yes Yes Yes
Number of observations 3,376 3,376 3,376 3,376 3,376 3,376 3,376 3,376 3,376 3,376 3,376 3,376
Adjusted R2 .018 .043 .339 .019 .045 .339 .039 .059 .341 .811 .309 .385
Joint sign.-level of TFB & TFB2 .011 .001 .000 .01 .001 .000 .002 .000 .000 .000 .000 .000
Maximizing TFB 1.27 1.224 1.269 1.224 1.22 1.206 1.225 1.187
Lower limit of 90% CI .926 .95 .914 .948 .767 .906 .887 .871
Upper limit of 90% CI 1.426 1.363 1.426 1.363 1.392 1.35 1.374 1.335
Significance of hump-shape .001 .000 .001 .000 .002 .000 .000 .000
This table presents the results of a series of fixed-effects OLS regressions of the number of descendants in generationton time to first birth, i.e. T F B andT F B2
for heads of lineages born in the period 1660–1685. All regressions account for Maternal Founder fixed effects. Birth year and marriage age dummies are included as controls. Furthermore, stoppage age dummies are included in columns 10–12. A dummy indicating unknown literacy is included in the regressions underlying column 4–12. Standard errors clustered at the level of the firstborn are reported in parentheses. *p <0.10, **p <0.05, ***p <0.01.
Table 4: Robustness to GLM regression – accounting for Maternal Founder fixed effects
(1) (2) (3) (4) (5) (6) (7) (8) (9) (10) (11) (12)
Gen. 1 Gen. 3 Gen. 4 Gen. 1 Gen. 3 Gen. 4 Gen. 1 Gen. 3 Gen. 4 Gen. 1 Gen. 3 Gen. 4
TFB -.041** .412** .547** -.042** .414** .557*** -.052*** .387** .547** -.073*** .468*** .595*** (.020) (.179) (.215) (.020) (.178) (.215) (.020) (.177) (.215) (.010) (.160) (.216)
TFB2 -.162*** -.234*** -.163*** -.238*** -.158*** -.236*** -.191*** -.256***
(.058) (.068) (.058) (.069) (.058) (.068) (.052) (.069)
Literate -.006 .121*** .119** -.006 .124*** .121** -.020 .118*** .104*
(.026) (.045) (.056) (.025) (.045) (.056) (.013) (.040) (.055)
Male .248*** .282*** .127** -.015 .083** .072
(.027) (.044) (.054) (.014) (.040) (.055)
Stoppage age fixed effects No No No No No No No No No Yes Yes Yes
Birth year FE Yes Yes Yes Yes Yes Yes Yes Yes Yes Yes Yes Yes
Number of observations 3,798 3,798 3,798 3,798 3,798 3,798 3,798 3,798 3,798 3,798 3,798 3,798 Joint sign.-level of TFB & TFB2 .045 .001 .000 .037 .001 .000 .009 .000 .000 .000 .000 .000
Maximizing TFB 1.271 1.169 1.27 1.169 1.226 1.155 1.225 1.159
This table presents the results of a series of GLM regressions, with a negative binomial distribution and a logarithmic link function, of the number of descendants in generation
ton time to first birth, i.e.T F BandT F B2
. All regressions include dummies for Maternal Founder fixed effects (Table A.6 omits these). Birth year and marriage age dummies are included as controls. Furthermore, stoppage age dummies are included in columns 10–12. A dummy indicating unknown literacy is included in the regressions underlying column 4–12. Standard errors clustered at the level of the firstborn are reported in parentheses. *p <0.10, **p <0.05, ***p <0.01.
5.1 Spousal migration
Immigrants may differ systematically from natives reflecting the circumstances that led to their decision to immigrate as well as the effects of immigration on their socio-economic status and thus their reproductive success. Thus, the migration status of the first spouse may have affected the reproductive success of heads of lineages. In the sample, heads of lineages were neither immigrants nor emigrants. Nevertheless, 23.5% of their first spouses were immigrants and 0.5% were emigrants. To account for the potential effect of spousal migration, dummy variables indicating the immigration and emigration status of heads of lineages are included in the regression analysis performed in Tables 2. As established in Table A.2, the qualitative results are unaffected by the migration status of the first spouse of the head of lineage.
5.2 Remarriages
Some head of lineages and their spouses, remarried, possibly multiple times, reflecting in part a considerable mortality rate over this period. The formation of additional unions may affect the reproductive success of heads of lineages via various channels, reflecting possibly the health and socioeconomic circumstances that led to these remarriages, as well as the potential differential treatment of previous and new children in the newly formed household. To account for the effect of remarriages, dummy variables indicating the number of marriages experienced by each head of lineage are included in the regressions performed in Tables 2. As established in Table A.2, the qualitative results are unaffected by accounting for remarriages.26
5.3 Gender
Reflecting an earlier marriage age of women relative to men, the sample of heads of lineages is unbalanced across gender. Although men on average married at a later age than women (i.e., 26.6 for men versus 19.4 for women), their average age at last delivery was higher (i.e., 46.3 for men versus 38.3 for women), and they remarried more often, resulting in a higher number of children per male (i.e., 10 for men versus 9.4 for woman). The effect of gender is directly accounted for as a control in the regressions performed in Tables 1 and 2. As an additional robustness check, Table A.3 demonstrate that the results are qualitatively similar in a sample that includes only females.
5.4 Birth and Death Parishes
The parishes of birth and death may affect TFB of heads of lineages and their reproductive success due to the influence of cultural and socioeconomic factors in a parish on the resources and pref-erences of heads of lineages. To account for the effect of these confounding geographical factors, dummy variables indicating the parishes of birth and death of each head of lineages are included
26
Excluding remarriages of head of lineages would reduce the sample size considerably and thus would affect the significance of the estimations. Nevertheless, the qualitative results would not be altered and the existence of the hump-shaped relationship would be significant at the 1% level.
in the regressions performed in Tables 2. As established in Table A.4, the qualitative results are unaffected by accounting for these parish fixed effects.
5.5 Month of Marriage and Month of Birth of Firstborn
The month of marriage may affect TFB and reproductive success of heads of lineages due to influence of climatic conditions on resources, nutrition and human physiology. In addition, the month of birth of the firstborn may affect the resources of heads of lineages and thus their reproductive success. To account for these confounding seasonal factors, dummy variables indicating the month of marriage for each head of lineage and the months of birth of the first born of each head of lineage are included in the regression performed in Tables 1 and 2. As established in Table A.4, the qualitative results are unaffected by accounting for these seasonal factors.
5.6 Birth Order
The birth order of heads of lineages may affect their TFB and reproductive success due to its effect of their nourishment as children, physiology, intergenerational transfers of wealth, and therefore resources as adults. To account for the potential effect of birth order, a dummy variable indicating if the head of lineage is the first birth among individuals sharing the same mother is included in the regressions performed in Tables 2. As established in Table A.5, the qualitative results are unaffected by accounting for the firstborn status of heads of lineages. Moreover, the firstborn status has no significant effect on reproductive success. Furthermore, accounting for the entire birth order of each head of lineage does not alter the qualitative results.
5.7 Alternative Estimation Method
The negative relationship between TFB of heads of lineages and the number of children, as well as the hump-shaped relationship between TFB of heads of lineages and long-run reproductive success, is established using quadratic OLS regression models. Table 4 and A.5 demonstrate that the qualitative results are robust to an alternative estimation method, using a generalized linear model (GLM) with a negative binomial distribution and a logarithmic link function.
6
Mechanism
6.1 Surviving Offspring
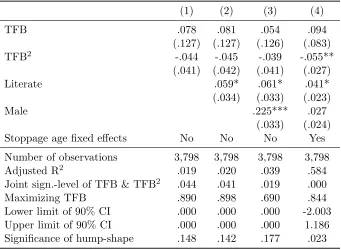
The survival probability channel is explored in Table 5, accounting for Maternal Founder fixed effects. As established in column 1, the number of children surviving to the mean marriage age of 23 is associated non-monotonically with TFB of heads of lineages, but rather weakly.27
In particular, accounting for the marriage age and birth year of heads of lineages, as well as gradually for their literacy status, gender, unless one accounts for the stoppage age, there is a no significant hump-shaped relationship between TFB and the number of children surviving to the average marriage age. Thus, it appears that this survival probability channel plays a minor role, if any in accounting for the established hump-shaped pattern between TFB and long-run reproductive success.
6.2 Education of Offspring
[image:21.612.135.476.352.602.2]The education channel is investigated in Table 6. As established in column 1, TFB of heads of lineages has a highly significant positive association with the fraction of literate children, accounting
Table 5: The effect of time to first birth (TFB) on the number of children surviving to the average marriage age
(1) (2) (3) (4)
TFB .078 .081 .054 .094
(.127) (.127) (.126) (.083) TFB2
-.044 -.045 -.039 -.055** (.041) (.042) (.041) (.027)
Literate .059* .061* .041*
(.034) (.033) (.023)
Male .225*** .027
(.033) (.024)
Stoppage age fixed effects No No No Yes
Number of observations 3,798 3,798 3,798 3,798 Adjusted R2
.019 .020 .039 .584
Joint sign.-level of TFB & TFB2
.044 .041 .019 .000
Maximizing TFB .890 .898 .690 .844
Lower limit of 90% CI .000 .000 .000 -2.003
Upper limit of 90% CI .000 .000 .000 1.186
Significance of hump-shape .148 .142 .177 .023
This table presents the results of a series of fixed-effects regressions of the number of children surviving to the average marriage age (23 years) on time to first birth,
i.e. T F B andT F B2. All regressions account for Maternal Founder fixed effects.
Birth year and marriage age dummies are included as controls. Furthermore, stoppage age dummies are included in column 4. A dummy indicating unknown literacy is included in the regressions underlying column 2–4. Standard errors clustered at the level of the firstborn are reported in parentheses. *p <0.10, **
p <0.05, ***p <0.01.
27
The use of the number of married children as dependent variable generates qualitatively similar results.
Table 6: The effect of time to first birth (TFB) on the fraction of literate children
(1) (2) (3) (4)
TFB .401*** .351*** .322*** .337***
(.090) (.090) (.091) (.091)
Literate 1.308*** 1.307*** 1.305***
(.094) (.094) (.095)
Male .563*** .407***
(.090) (.098)
Stoppage age fixed effects No No No Yes
Number of observations 3,448 3,448 3,448 3,448
This table presents the results of a series of fractional logit regressions of the share of children obtaining literacy on time to first birth, i.e. T F B andT F B2
for heads of lineages with at least one surviving child with observed literacy status. Birth year and marriage age dummies are included as controls. Furthermore, stoppage age dummies are included in column 4. A dummy indicating unknown literacy is included in the regressions underlying column 2–4. Standard errors clustered at the level of the firstborn are reported in parentheses. *p <0.10, **p <0.05, ***p <0.01.
for the marriage age and birth year of heads of lineages. As controls are gradually introduced to account for the confounding effects of the literacy status, gender, and stoppage age of heads of lineages, the positive coefficient remains stable and significant at the 1% level. Moreover, literacy of heads of lineages has a highly significant positive effect on the literacy of their children.
7
Concluding Remarks
This research explores the biocultural origins of human capital formation. It presents the first evidence that moderate fecundity was conducive for long-run reproductive success within the human species. Exploiting an extensive genealogy record for nearly half a million individuals in Quebec during the seventeenth and eighteenth centuries, the study traces the number of descendants of early inhabitants in the subsequent four generations. Using the time interval between the date of marriage and the first live birth as a measure of reproductive capacity, the research establishes that while a higher fecundity is associated with a larger number of children, an intermediate level maximizes long-run reproductive success.
References
Ashraf, Q. and O. Galor (2013): “The Out of Africa Hypothesis, Human Genetic Diversity, and Comparative Economic Development,”The American Economic Review, 103, 1–46.
Ashraf, Q., O. Galor, and M. Klemp(2014): “The Out of Africa Hypothesis of Comparative Development Reflected by Nighttime Light Intensity,” Brown Working Papers, 2014.
Baird, D. T., J. Collins, J. Egozcue, L. H. Evers, L. Gianaroli, H. Leridon, A. Sunde, A. Templeton, A. Van Steirteghem, J. Cohen, P. G. Crosignani, P. Devroey, K. Diedrich, B. C. Fauser, L. Fraser, A. Glasier, I. Liebaers, G. Mautone, G. Pen-ney, B. Tarlatzis, and coauthors (2005): “Fertility and ageing,” Human Reproduction
Update, 11, 261–276.
Becker, S., F. Cinnirella, and L. Woessmann (2010): “The Trade-off between Fertility and Education: Evidence from before the Demographic Transition,” Journal of Economic Growth, 15, 177–204.
Bisin, A. and T. Verdier(2000): “”Beyond the melting pot”: cultural transmission, marriage, and the evolution of ethnic and religious traits,” The Quarterly Journal of Economics, 115, 955–988.
Borgerhoff Mulder, M. (2000): “Optimizing offspring: the quantity–quality tradeoff in agropastoral Kipsigis,” Evolution and Human Behavior, 21, 391–410.
Bowles, S. (1998): “Endogenous preferences: The cultural consequences of markets and other economic institutions,” Journal of economic literature, 36, 75–111.
Boyd, R.(1988): Culture and the evolutionary process, University of Chicago Press.
Cavalli-Sforza, L. L. L. (1981): Cultural transmission and evolution: a quantitative approach, 16, Princeton University Press.
Charnov, E. L. and S. K. M. Ernest(2006): “The offspring-size/clutch-size trade-off in mam-mals,”The American Naturalist, 167, 578–582.
Christensen, K., H.-P. Kohler, O. Basso, J. Olsen, J. W. Vaupel, and J. L. Rodgers
(2003): “The Correlation of Fecundability Among Twins: Evidence of a Genetic Effect on Fer-tility?” Epidemiology, 14, 60–64.
Cody, M. L.(1966): “A general theory of clutch size,”Evolution, 174–184.
Duan, N.(1983): “Smearing estimate: a nonparametric retransformation method,”Journal of the
American Statistical Association, 78, 605–610.
Durham, W. H. (1982): “Interactions of genetic and cultural evolution: Models and examples,”
Human Ecology, 10, 289–323.
Galor, O.(2005): “From stagnation to growth: unified growth theory,” inHandbook of economic
growth (vol. 1A), ed. by P. Aghion and S. Durlauf, Amsterdam: North-Holland.
Galor, O. (2011): Unified Growth Theory, Princeton: Princeton University Press.
Galor, O. and S. Michalopoulos(2012): “Evolution and the growth process: Natural selection of entrepreneurial traits,” Journal of Economic Theory, 147, 759–780.
Galor, O. and O. Moav(2002): “Natural selection and the origin of economic growth,”Quarterly
Journal of Economics, 117, 1133–1191.
Galor, O. and O. Moav (2007): “The Neolithic revolution and contemporary variations in life expectancy,” Brown University Department of Economics Working Paper, 14.
Galor, O. and D. N. Weil(1999): “From Malthusian Stagnation to the Demographic Transition and Beyond,” The American Economic Review, 89, 150–154.
Galor, O. and D. N. Weil (2000): “Population, Technology, and Growth: From Malthusian Stagnation to the Demographic Transition and Beyond,” The American Economic Review, 90, 806–828.
Gillespie, D., A. Russell, and V. Lummaa (2008): “When fecundity does not equal fitness: evidence of an offspring quantity versus quality trade-off in pre-industrial humans,”Proceedings
of the Royal Society B: Biological Sciences, 275, 713–722.
Hansen, G. D. and E. C. Prescott(2002): “Malthus to Solow,” American Economic Review, 92, 1205–1217.
Harper, J., P. Lovell, and K. Moore(1970): “The shapes and sizes of seeds,”Annual review
of ecology and systematics, 1, 327–356.
Hill, K. and A. Hurtado (1996): Ache life history: The ecology and demography of a foraging
people, Aldine de Gruyter.
Kaplan, H., J. Lancaster, S. Johnson, and J. Bock(1995): “Does observed fertility maxi-mize fitness among New Mexican men?” Human Nature, 6, 325–360.
Kosova, G., M. Abney, and C. Ober (2009): “Heritability of reproductive fitness traits in a human population,”PNAS, 107, 1772–1778.
Lagerl¨of, N.-P.(2007): “Long-run trends in human body mass,”Macroeconomic Dynamics, 11, 367–387.
Lind, J. T. and H. Mehlum(2010): “With or Without U? The Appropriate Test for a U-Shaped Relationship,” Oxford Bulletin of Economics and Statistics, 72, 109–118.
Livingstone, F. B. (1958): “Anthropological Implications of Sickle Cell Gene Distribution in West Africa1,”American Anthropologist, 60, 533–562.
Lucas, R. (2002): The Industrial Revolution: Past and Future, Cambridge: Harvard University Press.
Meij, J., D. Van Bodegom, J. Ziem, J. Amankwa, A. Polderman, T. Kirkwood, A. De Craen, B. Zwaan, and R. Westendorp (2009): “Quality–quantity trade-off of hu-man offspring under adverse environmental conditions,” Journal of evolutionary biology, 22, 1014–1023.
Milot, E., F. M. Mayer, D. H. Nussey, M. Boisvert, F. Pelletier, and D. R´eale(2011): “Evidence for evolution in response to natural selection in a contemporary human population,”
Proceedings of the National Academy of Sciences, 108, 17040–17045.
Pettay, J. E., L. E. B. Kruuk, J. Jokela, and V. Lummaa(2005): “Heritability and genetic constraints of life-history trait evolution in preindustrial humans,” PNAS, 102, 2838–2843.
Ramlau-Hansen, C. H., A. M. Thulstrup, J. Olsen, and J. P. Bonde (2008): “Parental Subfecundity and Risk of Decreased Semen Quality in the Male Offspring: A Follow-up Study,”
American Journal of Epidemiology, 167, 1458–1464.
Roff, D.(1992): Evolution of life histories: theory and analysis, Routledge, Chapman and Hall.
Roff, D. A. (2002): Life History Evolution, Sunderland, MA: Sinauer Associates.
Salisbury, E. et al.(1942): “The reproductive capacity of plants. Studies in quantitative biol-ogy.” The reproductive capacity of plants. Studies in quantitative biology.
Spolaore, E. and R. Wacziarg(2009): “The diffusion of development,”The Quarterly Journal
of Economics, 124, 469–529.
Stearns, S.(1992): The evolution of life histories, vol. 248, Oxford University Press Oxford.
Strassmann, B. and B. Gillespie(2002): “Life–history theory, fertility and reproductive success in humans,” Proceedings of the Royal Society of London. Series B: Biological Sciences, 269, 553– 562.
Voight, B., S. Kudaravalli, X. Wen, and J. Pritchard (2006): “A map of recent positive selection in the human genome,” PLoS Biology, e72.
Walker, R. M., M. Gurven, O. Burger, and M. J. Hamilton(2008): “The trade-off between number and size of offspring in humans and other promates,” Proceedings of the Royal Society, 275, 827–833.
Weibull, J. W.(1997): Evolutionary game theory, MIT press.
A
Distribution of stoppage ages
0 5 10 15
Percentage of observations
0 41 60
[image:27.612.92.532.185.511.2]Age
Figure A.1: The histogram depicts the age at last delivery of 13,411 once-married, non-migrant mothers in Quebec born born before 1749 (and after 1624) who survived to age 50 and whose husband survived to age 50.
B
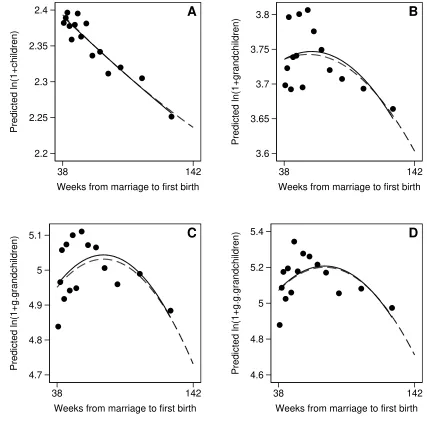
Conditional means by bins
2.2 2.25 2.3 2.35 2.4
Predicted ln(1+children)
38 142
Weeks from marriage to first birth
A
3.6 3.65 3.7 3.75 3.8
Predicted ln(1+grandchildren)
38 142
Weeks from marriage to first birth
B
4.7 4.8 4.9 5 5.1
Predicted ln(1+g.grandchildren)
38 142
Weeks from marriage to first birth
C
4.6 4.8 5 5.2 5.4
Predicted ln(1+g.g.grandchildren)
38 142
Weeks from marriage to first birth
[image:28.612.93.520.88.509.2]D
Figure A.2: Conditional means by bins for 3,798 heads of lineages)
The figure depicts estimates of the mean of the transformed number of descendants conditional on the marriage age and the birth year of the head of lineage. The sample is sorted by TFB and successively divided into 15 bins of approximately equal numbers of head of lineages. The median TFB in for each bin b,T F Bb is obtained. The figure depicts the expected value of ln(Db,t), where
Db,t is the number of descendants in generation t by head of household bin b, b = 1,2, . . . ,15,
conditional on birth year, marriage age and stoppage age dummies on the individual level, plotted againstT F Bb. The solid line represents the OLS fit of a quadratic regression of ln(Db,t) on T F Bb
C
Summary statistics for heads of lineages
Table A.1: Summary statistics of heads of lineages born before 1685
(1) (2) (3) (4)
Mean Median S.D. Count
Females
Children 9.42 10 3.66 2,058
Grandchildren 45.99 43 27.40 2,058
Great-grandchildren 187.65 159 142.74 2,058
Great-great-grandchildren 341.04 206.5 408.07 2,058
Years from marriage to first birth (TFB) 1.23 1.04 0.49 2,058
Literate 0.68 1 0.47 1,192
Fraction of literate children 0.72 1 0.36 1,872
Fraction of surviving childrenb 0.59 0.60 0.20 2,058
Fraction of surviving children with known literacyb 0.62 0.60 0.40 2,044
Age at first marriage 19.34 18.7 3.79 2,058
Age at last delivery 38.27 40.3 6.46 2,058
Males
Children 10.03 10 4.32 1,740
Grandchildren 48.94 45 28.77 1,740
Great-grandchildren 187.53 159 137.10 1,740
Great-great-grandchildren 238.38 136.5 293.17 1,740
Years from marriage to first birth (TFB) 1.16 0.99 0.44 1,740
Literate 0.64 1 0.48 1,030
Fraction of literate children 0.76 1 0.34 1,576
Fraction of surviving childrenb 0.60 0.60 0.20 1,740
Fraction of surviving children with known literacyb 0.57 0.50 0.39 1,728
Age at first marriage 26.62 25.9 4.41 1,740
Age at last delivery 46.31 46.9 8.81 1,740
All
Children 9.70 10 3.99 3,798
Grandchildren 47.35 44 28.07 3,798
Great-grandchildren 187.59 159 140.17 3,798
Great-great-grandchildren 294.01 171 363.58 3,798
Years from marriage to first birth (TFB) 1.20 1.02 0.47 3,798
Literate 0.66 1 0.47 2,222
Fraction of literate children 0.74 1 0.35 3,448
Fraction of surviving childrenb 0.59 0.60 0.20 3,798
Fraction of surviving children with known literacyb 0.60 0.57 0.40 3,772
Age at first marriage 22.67 22.2 5.46 3,798
Age at last delivery 41.95 42.1 8.61 3,798
a
The moderate increase in the mean and median number of descendants from the third to the fourth generation (i.e. from great-grandchildren to great-great-grandchildren) reflects the fact that these cohorts are less fully observed. Furthermore, since men produce children at lager ages than women, this effect is more pronounced among men.
b
Survival is recorded at the average marriage age, i.e. 23 years.
D
Robustness: Number of Marriages and Spousal Migration
Table A.2: Robustness to additional control variables: number of marriages and spousal migration – accounting for Maternal Founder fixed effects
(1) (2) (3) (4) (5) (6)
Gen. 1 Gen. 3 Gen. 4 Gen. 1 Gen. 3 Gen. 4
TFB -.049*** .583*** .794*** -.050** .418** .688***
(.019) (.197) (.252) (.020) (.200) (.253) TFB2
-.222*** -.315*** -.166** -.278***
(.065) (.083) (.066) (.083)
Literate -.008 .139*** .134** -.003 .144*** .139**
(.023) (.049) (.063) (.025) (.050) (.064)
Male .156*** .250*** .117** .182*** .227*** .041
(.023) (.045) (.058) (.026) (.046) (.058)
Total number of marriages fixed effects Yes Yes Yes No No No
Total number of marriages of spouse fixed effects Yes Yes Yes No No No
Immigration status of spouse fixed effects No No No Yes Yes Yes
Emigration status of spouse fixed effects No No No Yes Yes Yes
Number of observations 3,798 3,798 3,798 3,798 3,798 3,798
Adjusted R2
.194 .098 .316 .038 .062 .319
Joint sign.-level of TFB & TFB2
.008 .000 .000 .012 .004 .000
Maximizing TFB 1.311 1.258 1.26 1.239
Lower limit of 90% CI 1.067 1.02 .728 .927
Upper limit of 90% CI 1.446 1.389 1.445 1.388
Significance of hump-shape .000 .000 .006 .000
This table presents the results of a series of fixed-effects regressions of the number of descendants in generationton time to first birth, i.e. T F B andT F B2
E
Robustness: Gender
Table A.3: Robustness to gender distinction – sample restricted to females – accounting for Maternal Founder fixed effects
(1) (2) (3) (4) (5) (6)
Gen. 1 Gen. 3 Gen. 4 Gen. 1 Gen. 3 Gen. 4
TFB -.065*** .972*** 1.521*** -.065*** .980*** 1.534***
(.025) (.272) (.336) (.025) (.272) (.336)
TFB2 -.343*** -.545*** -.345*** -.549***
(.086) (.106) (.086) (.106)
Literate -.030 .117 .144
(.037) (.082) (.103)
Number of observations 2,058 2,058 2,058 2,058 2,058 2,058
Adjusted R2 .094 .092 .272 .093 .093 .272
Joint sign.-level of TFB & TFB2 .009 .000 .000 .008 .000 .000
Maximizing TFB 1.416 1.397 1.420 1.398
Lower limit of 90% CI 1.240 1.261 1.247 1.264
Upper limit of 90% CI 1.535 1.495 1.539 1.496
Significance of hump-shape .000 .000 .000 .000
This table presents the results of a series of fixed-effects regressions of the number of descendants in generationton time to first birth, i.e. T F B andT F B2
for female heads of lineages. All regressions account for Maternal Founder fixed effects. Birth year, marriage age and stoppage age dummies are included as controls. A dummy indicating unknown literacy is also included in the regressions. Standard errors clustered at the level of the firstborn are reported in parentheses. *p <0.10, **p <0.05, ***p <0.01.
F
Robustness: Location and Season of Marriage and Birth
Table A.4: Robustness to additional control variables: location and season of marriage and birth – accounting for Maternal Founder fixed effects
(1) (2) (3) (4) (5) (6)
Gen. 1 Gen. 3 Gen. 4 Gen. 1 Gen. 3 Gen. 4
TFB -.053*** .334* .548** -.040** .537*** .784***
(.020) (.198) (.247) (.020) (.206) (.265)
TFB2 -.137** -.228*** -.206*** -.313***
(.065) (.081) (.067) (.086)
Literate -.012 .090* .074 -.003 .151*** .141**
(.026) (.051) (.064) (.025) (.050) (.064)
Male .183*** .223*** .044 .204*** .289*** .123**
(.026) (.045) (.057) (.026) (.047) (.058)
Birth parish fixed effects Yes Yes Yes No No No
Death parish fixed effects Yes Yes Yes No No No
Month of marriage fixed effects No No No Yes Yes Yes
Month of birth of firstborn fixed effects No No No Yes Yes Yes
Number of observations 3,798 3,798 3,798 3,798 3,798 3,798
Adjusted R2
.070 .130 .375 .036 .056 .312
Joint sign.-level of TFB & TFB2 .007 .012 .000 .044 .001 .000
Maximizing TFB 1.218 1.200 1.301 1.251
Lower limit of 90% CI .116 .707 .984 .978
Upper limit of 90% CI 1.441 1.382 1.453 1.39
Significance of hump-shape .018 .002 .001 .000
This table presents the results of a series of fixed-effects regressions of the number of descendants in generationton time to first birth, i.e. T F BandT F B2