Advanced Visual Analytics Methods for Literature Analysis
Daniela Oelke
University of Konstanz Data Analysis and Visualization
Konstanz, Germany
Dimitrios Kokkinakis
Spr˚akbanken Department of Swedish University of Gothenburg
Gothenburg, Sweden
Mats Malm
Department of Literature, History of Ideas and Religion
University of Gothenburg Gothenburg, Sweden
Abstract
The volumes of digitized literary collec-tions in various languages increase at a rapid pace, which results also in a growing demand for computational support to ana-lyze such linguistic data. This paper com-bines robust text analysis with advanced visual analytics and brings a new set of tools to literature analysis. Visual ana-lytics techniques can offer new and unex-pected insights and knowledge to the liter-ary scholar. We analyzed a small subset of a large literary collection, the Swedish Liter-ature Bank, by focusing on the extraction of persons’ names, their gender and their nor-malized, linked form, including mentions of theistic beings (e.g., Gods’ names and mythological figures), and examined their appearance over the course of the novel. A case study based on 13 novels, from the aforementioned collection, shows a number of interesting applications of visual analyt-ics methods to literature problems, where named entities can play a prominent role, demonstrating the advantage of visual liter-ature analysis. Our work is inspired by the notion ofdistant readingormacroanalysis for the analyses of large literature collec-tions.
1 Introduction
Literature can be studied in a number of different ways and from many different perspectives, but text analysis - in a wide sense - will surely always make up a central component of literature stud-ies. If such analysis can be integrated with ad-vanced visual methods and fed back to the daily work of the literature researcher, then it is likely
to reveal the presence of useful and nuanced in-sights into the complex daily lives, ideas and be-liefs of the main characters found in many of the literary works. Therefore, the names of all char-acters appearing in literary texts can be one such line of enquiry, which is both an important sub-field of literature studies (literary onomastics) and at the same time the result obtained by a mature language technology (named entity recognition) which can be turned into a tool in aid of text anal-ysis in this field. (Flanders et al., 1998) discuss that references to one type of names, namely that of people, are of intrinsic interest because they re-veal networks of friendship, enmity, and collab-oration; familial relationships; and political al-liances. People’s names can be an appropriate starting point for research on biographical, his-torical, or literary issues, as well as being a key linguistic and textual feature in its permutations and usage.
We argue that the integration of text analysis and visualization techniques, which have turned out to be useful in other scientific fields such as bioinformatics (Nature Methods, 2010), could be put to effective use also in literature studies. We also see an opportunity to devise new ways of ex-ploring the large volumes of literary texts being made available through national cultural heritage digitization projects.
Digitized information and the task of storing, generating and mining an ever greater volume of (textual) data becomes simpler and more efficient with every passing day. Along with this opportu-nity, however, comes a further challenge: to create the means whereby one can tap this great poten-tiality and engage it for the advancement of (sci-entific) understanding and knowledge mining.
We apply a supra-textual perspective to the analysis of literary texts by encompassing a rather global visualization of a document. As a case study, we have analyzed a subset, 13 novels, of the Swedish Literature Bank1collection through two levels of inquiry by focusing on person names, their gender and their normalized, linked form, including mentions of theistic beings (e.g. Gods’ names and mythological characters), and examin-ing their appearance in sentences, paragraphs and chapters.
Our aim is to explore the usage of alterna-tive visualization means that provide additional insight by showing the data at higher resolution levels or that permit an analysis of the devel-opment of the story in the course of the text. The employed visualization techniques are scal-able enough to display several novels at once and therefore allow a literature scholar to compare dif-ferent literary texts to each other. By combining advanced natural language processing techniques with visualization techniques, we aim to allow the user to rapidly focus on key areas of interest (based on name mentions) and provide the ability to discover e.g. semantic patterns in large collec-tions of text. Therefore, our work is based on in-dividual texts, by looking for certain patterns of variation based on a particular named entity type. Our work is also inspired by the notions ofdistant readingormacroanalysisapplied to the analyses of literature collections which we find appealing for the research we describe. However, we do not
1The Swedish Literature Bank (Litteraturbanken,
http://litteraturbanken.se) is a co-operation
between the Swedish Academy, the Royal Library of Sweden, the Royal Swedish Academy of Letters, History and Antiquities, the Language Bank of the University of Gothenburg, the Swedish Society for Belles Lettres, and the Society of Swedish Literature in Finland. The Swedish Literature Bank also focuses on neglected authors and genres, effectively establishing a set of ’minor classics’ alongside the canonical works. So far, mainly texts in Swedish are available, but over time, selected works will be offered in translation as well. Currently, the Swedish Literature Bank offers literary works either as searchable e-text, as facsimiles of the original edition, as PDF files or as EPUB files - often in more than one format. The texts are available free of charge and the software is developed as open source. The website is directed towards the general public and students and teachers at every level, as well as towards scholars. The digital texts are based on printed first editions or on later scholarly editions. They are carefully proof-read, thus establishing a basis for scholarly work. For the common reader, introductions and essays provide fresh perspectives on the classics.
consider such techniques to be used as a substitu-tion for reading a book sequentially but as a useful supplement.
2 Background
Computer-assisted literary criticism is a rather young field in literature analysis (Juola, 2008). Typically, researchers in literary studies use com-puters only to collect data that is afterwards ana-lyzed conventionally. Yet, there are some cases in which the computer has already proven use-ful, e.g., for the analysis of prosody and poetic phonology or for comparing an author’s revisions (from version to version). Computer-assisted studies have also been performed in the context of sequence analysis in the past, such as assigning quoted passages to speakers and locating them in the sequence of the text (Butler, 1992).
2.1 Distant Reading and Macroanalysis
(Moretti, 2005) coined the term ”distant reading” in which ”the reality of the text undergoes a pro-cess of deliberate reduction and abstraction”. Ac-cording to this view, understanding literature is not accomplished by studying individual texts, but by aggregating and analyzing massive amounts of data. This way it becomes possible to detect possible hidden aspects in plots, the structure and interactions of characters becomes easier to fol-low enabling experimentation and exploration of new uses and development that otherwise would be impossible to conduct, e.g., quantifying the dif-ference between prose styles.
2.2 Visual Analytics for Literature Analysis
Visual Analytics is ”the science of analytical rea-soning facilitated by visual interactive interfaces” (Thomas et al., 2005). The central idea of visual analytics is that by tightly integrating the human expert and the machine, the strengths of both can be leveraged in the analysis process. Visual An-alytics has been applied successfully to many ap-plication domains in the past such as text analysis, geographical data analysis, security applications, (computational) biology or multimedia data.2
However, visual analytics is not often used in the context of literature analysis. Commonly, a text is read sequentially and then analyzed by the researcher bit by bit. Only during recent years some literary scholars have started to employ vi-sualization techniques in their studies.
One of them is Franco Moretti, who advocated the usage of visual representations such as graphs, maps, and trees for literature analysis (Moretti, 2005). (Vuillemot et al., 2009) suggested the us-age of word clouds and self-organizing graphs and presented a tool that allows to analyze a novel interactively with respect to several properties. In (Plaisant et al., 2006) a tabular representation that is enriched with visual symbols was used to present the results of an automatic algorithm for detecting erotic statements. (Rydberg-Cox, 2011) generated social network graphs of characters in Greek tragedies, based on information taken from linguistic dependency treebanks, which permit to visualize the interactions between characters in the plays. Furthermore, scatterplot views allowed the user to search for correlations between sev-eral variables of the meta data that comes with the novels. Rohrer et al. (1998) experimented with using implicit surfaces to compare single docu-ments with respect to the most frequent terms and to visualize a document collection.
Pixel-based visualizations come with the ad-vantage that the documents can be analyzed at a higher resolution level. The Compus system (Fekete and Dufournaud, 2000) used dense pixel displays to visualize the structure of richly anno-tated XML documents of books of the 16th cen-tury. Keim and Oelke (2007) focused more on the analysis of documents with respect to certain text
2
Cf. proceedings of the IEEE Conference on Vi-sual Analytics Science and Technology (IEEE VAST), http://visweek.org/.
properties to compare authors with respect to their writing style or to learn more about the character-istics of a literary book. The two techniques also differ from each other in terms of how structural information is encoded and how they deal with the problem of overplotting that occurs if a pixel encodes several feature values.
3 Named Entity Recognition
Named entity recognition (NER) is an important supporting technology with many applications in various human language technologies. It has emerged in the context ofinformation extraction
(IE) andtext mining(TM). The automatic recog-nition and marking-up of names (in a wide sense) and some other related kinds of information - e.g., time and measure expressions and/or terminology - has turned out to be a recurring basic require-ment. Hence, NER has become core language technology of great significance to numerous ap-plications and a wide range of techniques (Jack-son and Moulinier, 2007).
In our study involving 19th century fiction, we use a slightly adapted NER system to the lan-guage used in fiction around the turn of the twenti-eth century (Borin and Kokkinakis, 2010). More-over, the nature and type of named entities vary, depending on the task under investigation or the target application. In any case, person, location
andorganization namesare considered ’generic’. The system we applied implements a rather fine-grained named entity taxonomy with several main named entity types and subtypes but for our case study we chose to only use the typepersonwhich usually incorporates people’s names (forenames, surnames), groups of people, animal/pet names, mythological names, theonyms and the like. Note that we haven’t performed any formal evaluation of the entity or the gender annotation in this work. In previous studies, based on data from the same source and applying the same NER-tools (Borin et al., 2007), we have shown high figures on pre-cision and recall (96-98%) on, particularly, person recognition.
3.1 Gender Attribution
the referential gender of all person entities. Ref-erential gender relates linguistic expressions, both persons and groups of individuals, to ”female”, ”male” or ”gender-indefinite”. This is an impor-tant constraint which contributes to better perfor-mance in subsequent language processing appli-cations based on NER, such as anaphora resolu-tion, by filtering-out of gender-incompatible can-didates (Evans and Orasan, 2000). The approach to gender discrimination is based on applying a combination of the following heuristics:
• NER has a high accuracy in identifying per-son names, a large number of which are as-signed gender. A pre-classified list of 16,000 common first names assigns gender to com-monly used first names. This way a first dis-tinction is already being made between enti-ties that carry gender. The list has been ac-quired from various internet sites.
• Use of gender-marked pronouns in the vicin-ity of person entities (a simplistic form of pronoun resolution where simple decisions are made by matching a genderless per-son entity with a gender bearing perper-sonal pronouns, han ’he’, hans ’his’, hon ’she’ and hennes ’her’). Also, various types of honorifics and designators, manually pre-categorized into gender groups, provide the evidence that is explored for the annota-tion of both animate instances but also their gender. Inherent characteristics for a large group of these designators (e.g., morpholog-ical cues), indicate biologmorpholog-ical gender. Exam-ples of gender-bearing male designators are e.g. the nounsbaronandherr ’Mr’, and ad-jectives with suffix bearing gender, namely
-e, such as starke ’strong’, hygglige ’kind’ andgamle ’old’; while female-bearing des-ignators are e.g. tant ’aunt’ andfru ’wife’. Gender is also captured using a simplified set of suffix matching rules, such as-inna/innan,
-erska/erskan (typical suffixes for female) and -man/mannen, -iker/ikern (typical suf-fixes for male).
• Labeling consistency is a technique that op-erates over the whole annotated text. This module reviews the annotations made so far, in order to support gender attribution of unassigned cases based on unambiguous
pre-vious gender assignments. This is a sim-ple but robust approach that does not rely on pre-compiled statistics of any kind. In order to capture such consistency we em-ploy a two stage labeling approach. Dur-ing the first stage, we note the instances of person entities with unknown gender, and search for a context where the same entity has been assigned gender (male, female) due to a gender-indicating context and for which no other occurrences of the same entity are found in the document with a different gen-der. If this is the case, then all occurrences of that entity are assigned the same gender throughout the document. During the sec-ond stage, the system investigates if there are any conflicting, ambiguous annotations for gender for which the local context and the supporting resources (e.g., first names’ gazetteer) cannot decide the gender attribu-tion. If this is the case and more than one possible annotation for gender is recorded, we choose the most frequently assigned gen-der label for the entity in question, in case of a tie we mark the gender asunknown.
3.2 Name Linking
Since the same name can be referred to in vari-ous ways, extracting named entities alone is not sufficient for many tasks. Therefore, mapping and linking multiple linguistic variations to a sin-gle referent is necessary. We apply a simplified form of co-reference resolution based on salient features and pattern matching that links (hope-fully) all mentions that refer to a single per-son entity. Consider the aggregated occurrences for the name O’Henny appearing in the novel ”Clownen Jac” [lb904603] (1930). All 92 oc-currences of the figure O’Henny will be linked to the same individual since there is sufficient and reliable evidence which is based on gender match, no annotation conflicts (i.e. other individ-ual namedDennyorHennywith the same gender) and orthographic characteristics: O’Henny (58);
Denny (19); Denny O’Henny (7); Henny-Denny
(4);Denny-Henny(3);Henny(1).
4 Material
considered an essential source within many disci-plines of humanities (history, religion, sociology, linguistics etc.) and social studies and an invalu-able source for understanding the movements of society by its ability to demonstrate what forces and ideas are at work in the society of its time. Prose fiction is complex and difficult to use not only because of interpretational complexity but also because of its limited availability.
The Swedish Literature Bank, and its sister project ”the 19th Century Sweden in the Mirror of Prose Fiction”, aims to change this by devel-oping a large representative corpus which mir-rors society at given points in time, chronologi-cally selected in such a way that historical com-parisons can be made. A substantial part of the material is all fiction, written in the original and published separately for the first time, that ap-peared in Swedish starting from the year 1800 and collected during consecutive twenty year in-tervals. The material provides a whole century of evolution and social, aesthetic, scientific, techni-cal, cultural, religious and philosophical change. Out of this data we selected the literary produc-tion, 13 novels, of a single author, namely Hjal-mar Bergman (1883-1931). The selected novels (followed by their id) are:
• Savonarola (1909); id=lb443177 • Amourer (1910); id=lb1611717
• Hans n˚ads testamente (1910); id=lb1611719 • Vi Bookar, Krokar och Rothar (1912);
id=lb494265
• Loewenhistorier (1913); id=lb1631349 • Falska papper (1916); id=lb1525006 • Herr von Hancken (1920); id=lb1524996 • Farmor och V˚ar Herre (1921); id=lb1187656 • Eros’ begravning (1922); id=lb1470072 • Chefen fru Ingeborg (1924); id=lb1524995 • Flickan i frack (1925); id=lb1470073 • Kerrmans i paradiset (1927); id=lb1317426 • Clownen Jac (1930); id=lb904603
5 Visual Exploration of the Data
In this chapter we report on our experiences with different visualization techniques that can be em-ployed for analyzing novels with respect to the characters involved in the plot. Besides net-work representations two alternative, not as well
known, visualization techniques are tested. Our goal is to learn about their strengths and weak-nesses with respect to the task and identify chal-lenges that are specific for the field. We show how visualization can be used to gain insight into lit-erary work that otherwise would be much more laborious to get.
5.1 Network representation
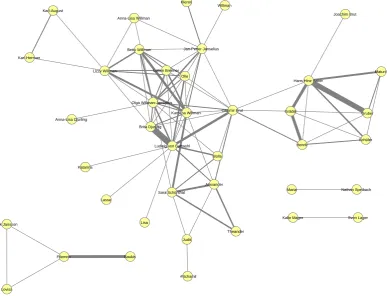
Traditionally, persons in a novel are analyzed in terms of the relations that exist between them. Obviously, graph visualizations are well suited for representing this kind of information. Figure 1 shows a person network for the novel ”Eros’ be-gravning” (’Eros’ funeral’) (1922). Nodes repre-sent characters of the plot and an edge is inserted between two persons if they co-occur in at least one sentence of the novel.3 In such a represen-tation it is easy to identify protagonists that are connected to many other characters (e.g.,Ludwig von Battwyhl or Olga Willman-Janselius). Fur-thermore, it is possible to see clusters of char-acters. Figure 1 also shows thatCasimir Brut is the person that connects the two main groups of characters of the novel, in the sense that he in-troduces one group of characters to another. The thickness of an edge encodes the number of times that two names co-occur which could be regarded as the strength of the relationship. A strong con-nection seems to exist betweenBrita Djurlingand
Ludwig von Battwyhlbut also betweenHans Hinz Faber and Gruber. It is interesting to see that
Gruberis only weakly connected with other char-acters of the plot but almost exclusively occurs together withHans Hinz Faber. Presumably, be-causeHans Hinz Faberwas the faithful servant of
Gruber.
The example shows that network representa-tions can provide interesting insight with respect to the relationship between different persons in the plot. However, one question that this plot can-not answer is how these relationships evolve over the course of the novel.
5.2 Summary Plots
Summary plots are tabular representations in which each column represents a text unit (here:
3
#Schamil Judit Olle
Casimir Brut Betty Willman
Karolina Willman
Schüler Maturin
Henrik Grädel
Hans Hinz Faber
Filemon
Lovisa Erik Jansson
Baukis
Gruber Lizzy Willman
Brita Djurling Karl-Herman
Anna-Lisa Willman Karl-August
Lotten Brenner
Ludwig von Battwyhl Jan-Petter Janselius
Olga Willman-Janselius
Lasse
Lisa
Alexander Katarina
Bolla
Nathan Speibach Maria
Sara Schönthal
Willman Hieron
Theander Anna-Lisa Djurling
Joachim Brut
[image:6.595.106.494.70.366.2]Sven Lager Kalle Mager
Figure 1: Network representation based on the co-occurrences of the person names in ”Eros’ begravning”
a chapter) and each line corresponds to a person of the novel. Table cells are colored according to the frequency of the character in the specific text unit (normalized with respect to the number of words in the chapter). The person names are sorted in descending order according to the over-all frequency of the person name in the novel.
In such a heatmap-like representation it is easy to see which characters co-occur in a chapter but also how this develops in the course of the docu-ment.Do always the same persons meet? Is there one main protagonist in the book that is almost always present or is the story line more complex in terms of characters? Being able to answer this kind of questions provides the analyst with insight about the development of the story that would not be visible in a person network.
Figure 2 shows the summary plot for the novel ”Eros’ begravning” in which some interesting characteristics become apparent. For example, some person names are only mentioned in a specific chapter (see lines of Hans Hinz Faber,
Gr¨adel,Schmil,Lisbeth etc.). Besides, the chap-ters differ significantly with respect to the num-ber of unique person names that are mentioned.
The first and the last chapter are the ones in which most characters are mentioned whereas in the third chapter only four characters play a role.
A closer look into the text reveals that the novel consists of a ”frame text”, where different peo-ple meet and tell each other stories. The stories constitute chapters in the novel, and thus become a bit like short stories. The first chapter, which does not have a title, introduces a large number of people. This number of participating people then decreases during the course of the following sto-ries (chapters), but towards the end of each chap-ter the discussion is returned to the overall story once again, where people are talking with each other about various things before the next story starts. Also, in the individual chapters there exist people who do not participate outside of a single chapter.
5.3 Literature Fingerprints
ag-lb1470072, red = Olga Willman-Janselius, green = other name
1
2
3
4
5
6
[image:7.595.120.478.62.271.2]7
Figure 3: Literature Fingerprint for the novel ”Eros’ begravning”. Red pixels mark mentions of the protagonist ”Olga Willman-Janselius, green pixels highlight the position of other names.
Figure 2: Summary plot for novel ”Eros’ begravning” (’Eros’ funeral’).
gregation and enable an inspection of the data on a much higher resolution level.
We use the literature fingerprinting technique (Keim and Oelke, 2007) to inspect the novel ”Eros’ begravning” in more detail. Each pixel represents one word. Pixels are arranged from left to right and top to bottom and are grouped accord-ing to chapters. The color of a pixel can be used to encode a value. In this case pixels were colored in red if they represent the name of the most
fre-quent protagonist, Olga Willman-Janselius, and in green if another name was mentioned. The technique is scalable enough to display the whole book at this high resolution level. However, the colored pixels are sparse and would likely be lost in the sea of uncolored pixels. We therefore use semi-transparent halos around the colored pixels to increase their visual saliency. (For more vi-sual boosting techniques for pixel-based vivi-sual- visual-izations see (Oelke et al., 2011)). In this visualiza-tion it is now possible to see where in the course of the novel the main protagonist,Olga Willman-Janselius, plays a role. Furthermore, it becomes obvious that there are parts in which almost no person name at all is mentioned. This is in line with the fact that the book tells several separate stories that are integrated at the end of each chap-ter into the overall story (see also explanation in section 5.2).
Alternatively, we also could have highlighted the positions of several names using one color per protagonist to compare their distribution. This way an analyst can learn about the relations be-tween different characters. However, the number of different names that can be highlighted at the same time is restricted by the human ability to dis-tinguish different colors easily (cf.(Ware, 2008)).
[image:7.595.108.259.328.565.2]Male
Fem
ale
Unkno
wn
Gods
Inc
ludes
ne
w
da
ta
Vi Bookar, Krokar … (1912) Savonarola (1909) Clownen Jac (1930) Kerrmans i paradiset (1927)
Amourer (1910) Hans nåds testamente (1910) Chefen fru Ingeborg (1924) Loewenhistorier (1913)
Herr von Hancken (1920) Eros‘ begravning (1922) Farmor och Vår Herre (1921) Falska papper (1916)
[image:8.595.97.502.63.391.2]Flickan i frack (1925)
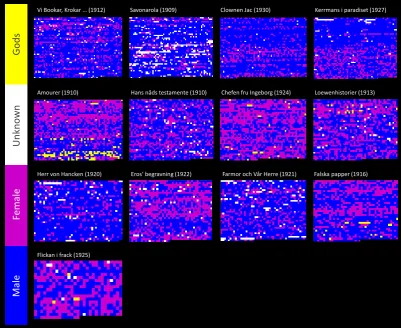
Figure 4: Fingerprints for the 13 novels. Color is used to encode the three categories male, female, gods.
focus is put on the order in which the mentions of the three categories (male, female, gods) appear. Words that the algorithm recognized as a name but could not assign to one of the categories are marked as unknown and are colored in white.
Some interesting patterns become visible in the visualization. One book (first one in the second row) sticks out because of its high number of men-tions of theistic beings. ”Amourer” [lb1611717] (1910) is a collection of short stories. The last story, ”The False Cristoforo”, varies the theme of
Christopher, who carried Jesus Christ across the river which results in the peak of names of theis-tic beings that can be observed at the end of the book.
Another interesting observation is that in the beginning of the book ”Kerrmans i paradiset” [lb1317426] (1927) (last one in first row), male characters are clearly dominant which is almost reversed in the book’s second part. A closer look into the book reveals that this is because the book is divided into two main parts. The first part is more about prestige and position in society,
i.e., social games with other men, while the sec-ond part is more personal and relates clearly to women. The summary plot of the book (Figure 5) reveals that there are not fewer male characters involved in the second part of the book but overall they are less frequently mentioned. At the same time, female characters that had in the first part of the book only a minor role become more domi-nant in the plot.
5.4 Discussion
in-Male characters
[image:9.595.118.476.63.293.2]Female characters
Figure 5: Summary plot for the novel ”Kerrmans i paradiset”. Lines are grouped according to the two categories male / female and are sorted within each category according to the overall frequency of the characters.
volvement of different characters across the doc-ument. Even more details are provided by the literature fingerprinting technique. Because the technique is very scalable, every single word can be visualized. Coloring is used to encode text properties of interest. Again, the development of the characters across a document is visible, this time even within single chapters. However, com-pared to the summary plot technique, fewer per-son names can be distinguished.
Obviously, a combination of the three tech-niques is advisable for analyzing novels with re-spect to the persons involved. But our comparison of the three techniques also allows us to identify a missing type of visualization: One that is able to show the development of the story in terms of the characters involved and at the same time is able to display their relationships.
Furthermore, the techniques lead to interesting in-sight but these newly generated hypotheses need to be checked in the text. A tighter integration of the actual text source into the visualization tools could therefore be a valuable extension.
6 Conclusions
The combination of robust text analysis with vi-sual analytics brings a new set of tools to litera-ture analysis, provides powerful insights on docu-ment collections, and advances our understanding
of the evolution of human behavior, society, tech-nological advancement and cultural trends. As a matter of fact, (Michel, 2010), introduced the term ”Culturomics”, i.e. the application of high-throughput data collection, digital book archives and the like, and analysis to the study of hu-man culture and we believe that novel insights to-wards this direction can be gained by combining such technologies. In this paper we have shown that quantifiable data such as (person) names can be identified, extracted, and visualized in novel ways.
In the future we intend to further extend the ca-pabilities for visual literature analysis. One re-search goal is the development of a visualization technique that allows to investigate the develop-ment of a story across a novel but at the same time shows the relationships between the char-acters. Furthermore, we believe that interactive visual analysis tools (instead of static visualiza-tions) open up additional possibilities for litera-ture scholars to explore the large volumes of dig-itized literary collections that are nowadays avail-able.
Acknowledgments
References
Yevgeni Berzak, Michal Richter, Carsten Ehrler and Todd Shore. 2011. Information Retrieval and Vi-sualization for the Historical Domain. Language Technology for Cultural Heritage - Theory and Ap-plications of Natural Language Processing. Pp. 197–212. Springer.
Lars Borin and Dimitrios Kokkinakis. 2010. Liter-ary Onomastics and Language Technology. Liter-ary Education and Digital Learning. Methods and Technologies for Humanities Studies. Pp. 53–78. IGI Global.
Lars Borin, Dimitrios Kokkinakis and Leif-Jran Ols-son. 2007. Naming the past: Named entity and animacy recognition in 19th century Swedish litera-ture.Proceedings of the ACL Workshop: Language Technology for Cultural Heritage Data (LaTeCh). Prague. Pp. 1–8.
Christopher S. Butler. 1992. Computers and Written Texts. Basil Blackwell.
Richard Evans and Constantin Orasan. 2000. Im-proving anaphora resolution by identifying ani-mate entities in texts. Proceedings of the Dis-course Anaphora and Anaphor Resolution Collo-quium (DAARC) 2000. Lancaster, UK. Pp. 154– 162.
Jean-Daniel Fekete and Nicole Dufournaud. 2000. Compus: visualization and analysis of structured documents for understanding social life in the 16th century. Proceedings of the fifth ACM conference on Digital libraries. San Antonio, Texas, United States. Pp. 47–55, ACM.
Julia Flanders, Syd Bauman, Paul Caton and Mavis Cournane. 1998. Names proper and improper: Ap-plying the TEI to the classification of proper nouns. Computers and the Humanities. 31(4), pp. 285– 300.
Peter Jackson and Isabelle Moulinier. 2007. Natural language processing for online applications: Text retrieval, extraction and categorization. Amster-dam: John Benjamins.
Patrick Juola. 2008. Killer applications in digital humanities. Literary and Linguistic Computing. 23(1): 73–83.
Daniel A. Keim and Daniela Oelke. 2007. Literature Fingerprinting: A New Method for Visual Literary Analysis. Proceedings of the IEEE Symposium on Visual Analytics Science and Technology (VAST). Pp. 115–122.
Jean-Baptiste Michel et al. 2010. Quantita-tive Analysis of Culture Using Millions of Digitized Books. Science 331 (6014): 176. ”http://www.sciencemag.org/content/early/2010/12/ 15/science.1199644”.
Franco Moretti. 2005. Graphs, maps, trees: abstract models for a literary history. R. R. Donnelley & Sons.
Nature Methods. 2010. Visualizing biological data. Supplement to Nature Publishing Group journals. 7 (3s): S1-S68.
Daniela Oelke, Halldor Janetzko, Svenja Simon, Klaus Neuhaus and Daniel A. Keim. 2011. Visual Boosting in Pixel-based Visualizations. Computer Graphics Forum. 30 (3): 871-880.
Catherine Plaisant, James Rose, Bei Yu, Loretta Auvil, Matthew G. Kirschenbaum, Martha Nell Smith, Tanya Clement and Greg Lord. 2006. Exploring erotics in Emily Dickinson’s correspondence with text mining and visual interfaces. Proceedings of the 6th ACM/IEEE-CS joint conference on Digital libraries. Pp. 141-150, ACM.
Randall M. Rohrer, David S. Ebert, and John L. Sibert. 1998. The Shape of Shakespeare: Visualizing Text using Implicit Surfaces. Proceedings of the 1998 IEEE Symposium on Information Visualization. Pp. 121-129.
Jeff Rydberg-Cox. 2011. Social Networks and the Language of Greek Tragedy. Journal of the Chicago Colloquium on Digital Humanities and Computer Science.1(3): 1-11.
Kathryn Schulz. 2011. The Mechanic Muse - What Is Distant Reading? The New York Times - Sunday Book Review. Page BR14. ”http://www.nytimes.com/ 2011/06/26/books/review/the-mechanic-muse-what-is-distant-reading.html”.
James J. Thomas and Kristin A. Cook. 2005. Illu-minating the Path: The Research and Development Agenda for Visual Analytics.National Visualization and Analytics Center.
Romain Vuillemot, Tanya Clement, Catherine Plaisant and Amit Kumar. 2009. What’s Being Said Near ”Martha”? Exploring Name Entities in Literary Text Collections. Proceedings of the IEEE Sympo-sium on Visual Analytics Science and Technology (VAST). Atlantic City, New Jersey, USA. Pp. 107– 114.