Hi´erarchie: Interactive Visualization for Hierarchical Topic Models
Alison Smith, Timothy Hawes, and Meredith Myers DECISIVE ANALYTICS Corporation
Arlington, VA
{alison.smith, timothy.hawes, meredith.myers}@dac.us
Abstract
Existing algorithms for understanding large collections of documents often pro-duce output that is nearly as difficult and time consuming to interpret as read-ing each of the documents themselves. Topic modeling is a text understanding algorithm that discovers the “topics” or themes within a collection of documents. Tools based on topic modeling become in-creasingly complex as the number of top-ics required to best represent the collec-tion increases. In this work, we present Hi´erarchie, an interactive visualization that adds structure to large topic models, making them approachable and useful to an end user. Additionally, we demonstrate Hi´erarchie’s ability to analyze a diverse document set regarding a trending news topic.
1 Introduction
In computational linguistics and related fields, sig-nificant work has been invested in the development of algorithms for gaining insight from large bod-ies of text. The raw output of these techniques can be so complex that it is just as difficult and time consuming to understand as reading the text. Therefore, it is an especially challenging problem to develop visualizations that add analytic value, making complex analysis accessible by helping a user to understand and interact with the output of these algorithms.
Topic Modeling is a common, data-driven tech-nique for summarizing the content of large text corpora. This technique models documents as dis-tributions of topics and topics as disdis-tributions of words. In practice, topic models are used to pro-vide a high-level overview and guided exploration of a corpus. Prior work by others (Chaney and
Blei, 2012) and by the author (Smith et al., 2014) has focused on visualizing the results of topic modeling to support these two goals, but these visualizations do not scale beyond 10 to 20 top-ics1. Topic models with a small number of
top-ics may not accurately represent very diverse cor-pora; instead, representative topic models require a number of topics an order of magnitude higher, for which current visualization methods are not suitable. We propose a visualization that displays hierarchically arranged topics. As opposed to a flat model, which can be thought of as an un-ordered heap of topics, a hierarchical structure al-lows a user to “drill into” topics of interest, mean-ing this technique supports directed exploration of a corpus regardless of the number of topics in the model.
Although methods that use inherently hierarchi-cal generative models do exist, we take a simple recursive approach that scales to large datasets and does not change or depend on the underlying topic modeling implementation. In principle, this tech-nique could be applied to a range of topic model-ing algorithms. We present this hierarchical model to the user through an intuitive interactive visual-ization, Hi´erarchie. Additionally, we demonstrate the capability with a Case Study on analyzing the news coverage surrounding the Malaysia Airlines flight that went missing on March 8, 2014.
2 Related Work
Latent Dirichlet Allocation (LDA) (Blei et al., 2003b) is an unsupervised algorithm for perform-ing statistical topic modelperform-ing that uses a “bag of words” approach, treating each document as a set of unordered words. Each document is repre-sented as a probability distribution over some top-ics, and each topic is a probability distribution over
1Either the visualization becomes too confusing to
under-stand or using the visualization to explore the corpus takes too much time — or both.
words. LDA is an effective, scalable approach to modeling a large text corpus; however, the result is a flat topic model with no hierarchical structure for a visualization to exploit.
Approaches exist for learning topic hierarchies from data, such as the Nested Chinese restaurant process (Blei et al., 2003a) and Pachinko Alloca-tion (Li and McCallum, 2006). These approaches build the intuitions of the hierarchy into the mod-eling algorithm. This adds additional complexity and tightly couples the hierarchical process with the underlying modeling algorithm.
Our Hierarchical Topic Modeling method uses a simple top-down recursive approach of splitting and re-modeling a corpus to produce a hierarchi-cal topic model that does not require a specific un-derlying topic modeling algorithm. This work is most similar to Dirichlet Compound Multinomial Latent Dirichlet Allocation, DCM-LDA, which processes the corpus via a bottom-up approach. DCM-LDA first trains unique topic models based on co-occurrence of words in each document, and then clusters topics across documents (Mimno and McCallum, 2007).
Existing visualizations support analysis and ex-ploration of topic models. Topical Guide (Gardner et al., 2010), TopicViz (Eisenstein et al., 2012), and the topic visualization of (Chaney and Blei, 2012) provide visualization and interaction with topic models for corpus exploration and under-standing. These visualizations typically repre-sent topics as word clouds, where the topic model as a whole is presented as an unordered set of topics. This approach is not optimal for effi-cient exploration and understanding, and the sea of word cloudsquickly becomes overwhelming as the number of topics grows. Termite (Chuang et al., 2012) uses a tabular layout to represent a topic model and supports easy comparison of words within and across topics. The Termite visualiza-tion organizes the model into clusters of related
topics based on word overlap. This visualization technique is space saving and the clustering speeds corpus understanding. Our approach clusters top-ics by document overlap instead of word overlap and is hierarchical, providing multiple levels of re-lated topics for intuitive corpus exploration.
Nested lists, icicle plots (Kruskal and Landwehr, 1983), and treemaps (Shneider-man, 1998) are commonly used for visualizing hierarchical data, but they have limitations and do
not easily support data-dense hierarchies, such as hierarchical topic models. Nested lists can be hard to navigate as they fail to maintain the same size and approximate structure during exploration. An icicle plot, which is a vertical representation of a partition chart, suffers from similar rendering constraints and limits positioning, sizing, and readability of text labeling. Treemaps use nested rectangles to display hierarchical data, but have been criticized as not cognitively plausible (Fab-rikant and Skupin, 2005), making them difficult to interpret. Additionally, as is the case for nested lists and icicle plots, treemaps obscure the structure of the underlying data to accommodate layout and sizing constraints.
Hi´erarchie uses an interactive sunburst chart (Stasko et al., 2000), which is a partition chart with radial orientation that supports visual-izing large or small hierarchies without requiring scrolling or other interaction. The sunburst chart implementation used by Hi´erarchie is directly based upon the Sequences Sunburst (Rodden, 2013) and Zoomable Sunburst (Bostock, 2012b) examples that are implemented in the Data-Driven Documents library (Bostock, 2012a).
3 Hierarchical Topic Modeling
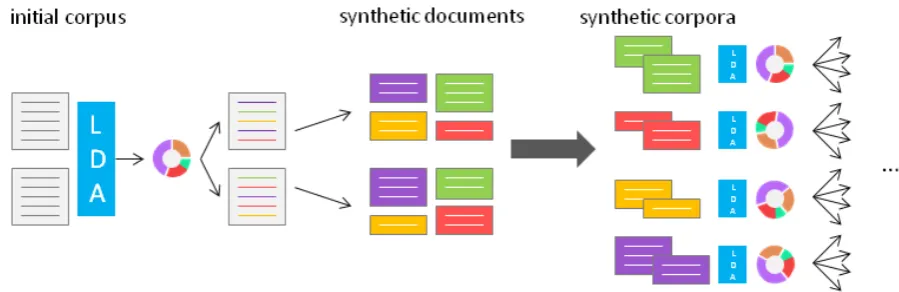
The HLDA algorithm takes a simple, top-down approach for producing hierarchical topic models by recursively splitting and re-modeling a corpus. Standard LDA discovers the distribution of words in topics and topics in documents through an infer-ence process; our implementation uses Gibbs sam-pling (Griffiths and Steyvers, 2004) for inference. As a result of this process, each word in a docu-ment is assigned to a topic. At the end of sampling, HLDA uses these word-to-topic assignments to construct newsyntheticdocuments for each topic from each of the initial documents. These syn-thetic documents contain only those words from the original document that are assigned to the topic and make up the synthetic corpus for the topic. So, if there are 10 topics in the topic model, up to 10 new synthetic documents — one for each topic — will be created for each document, and these doc-uments will be merged into the topic’s synthetic corpus.
For each topic,t, we then construct a new topic model,mt, using the synthetic corpus
correspond-ing to t. The discovered topics in mt represent
Figure 1: Overview of the HLDA algorithm. The algorithm runs LDA over the original corpus which results in a topic model and word-topic assignments. These word-topic assignments are used to create synthetic documents — one for each document/topic pair. The synthetic documents are grouped into synthetic corpora by topic, and LDA is run for each of the synthetic corpora. This process continues recursively until the synthetic corpus and documents are too small to model. The result is a hierarchy of topic distributions.
Figure 1, can be repeated recursively, until the synthetic corpus and synthetic documents are too small to model.2 While the number of topics at
each level in the hierarchy must be specified, the overall number of topics discovered by this ap-proach is a byproduct of the algorithm.
This modeling approach is a wrapper algorithm that can be applied to any modeling approach that assigns individual tokens in documents to specific topics.
4 Hi´erarchie
To effectively visualize the topic hierarchy out-put from HLDA, it is important to properly con-vey the relevance and structure of the topics. In-tuitive interaction with the visualization is impor-tant so users can easily explore topics and identify patterns. Without effective visualization, forming conclusions becomes as difficult as approaching the raw documents without the benefit of algorith-mic analysis.
In practice, a diverse set of visualizations are used to display hierarchical data. An effective vi-sualization of a hierarchical topic model should support the following Use Cases:
1. Accuracy- display topics without hiding or
skewing the hierarchical structure
2. Granularity- interact with the visualization
2This is parameterized and can be set based on tolerable
quality degradation from short documents or small corpora.
to explore the topics at all levels of the hier-archy
3. Accessibility- view the underlying data
as-sociated with the topics
Many of the visualizations we considered for viewing topic hierarchies obscure or misrepresent the true structure of their underlying data, largely due to the amount of space required for rendering. Others provide less skewing of the structure, yet, for large hierarchies, require a high degree of user interaction (clicking and navigating) to expose the underlying data. We found that a sunburst chart is best suited to our purposes as it supports visual-izing large or small hierarchies without requiring scrolling or other interaction. Unlike other hierar-chical visualizations, the sunburst can accommo-date the size of a typical computer screen without hiding or minimizing structure.
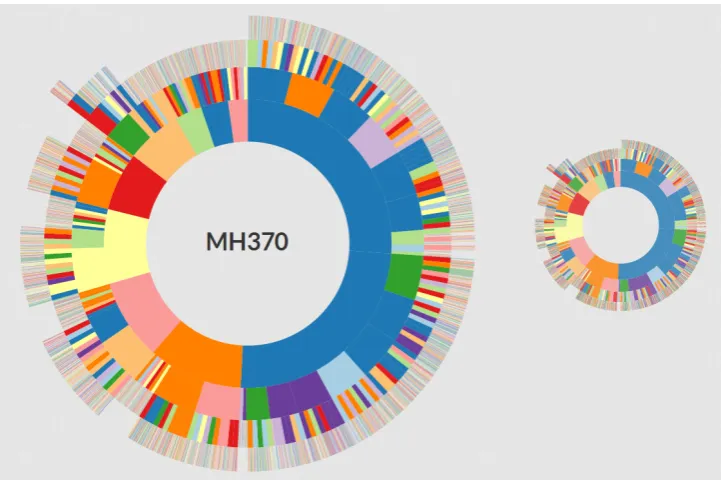
Figure 2 displays a top-level view of the Hi´erarchie visualization for a dataset of Tweets, Reddit comments, and news articles regarding the Malaysia Airlines flight. Each level of the hierar-chical topic model is represented as a ring of the Sunburst chart where the arcs comprising the rings represent the individual topics. By not labeling each arc, or “slice,” within the sunburst, the high-level overview of the hierarchical topic model is presented to the user with minimal complexity.
(Shnei-Figure 2: The top-level view of the Hi´erarchie visualization. This visualization uses a sunburst chart, which is optimal for displaying the topic hierarchy created by the HLDA algorithm without hiding or skewing the hierarchical structure.
derman, 1996) and does not display details for ev-ery topic, requiring user interaction to expose ad-ditional data. In our sunburst visualization, user interaction allows for exploration of the informa-tion at a finer granularity. When hovering over a topic of interest, the words of the topic are dis-played in the empty center of the sunburst. This is an efficient use of space and prevents disorienta-tion, since minimal eye movement is required be-tween the slice of interest (where the user’s mouse is located) and the center list of topics.
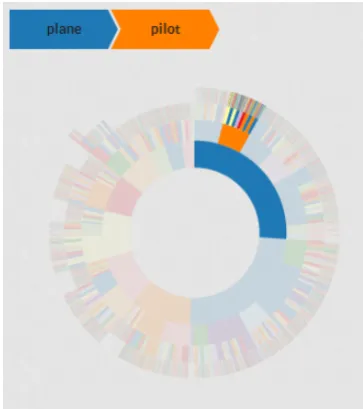
When a user selects a slice of interest, the sun-burst zooms in to display the selected topic and sub-topics. This allows the user to analyze a spe-cific section of the hierarchy. This interaction is shown in Figures 4 and 5. The sunburst has re-oriented to display the selected sub-topic, (plane, crash, crashed) as the visualization root.
To provide a clean and meaningful display of topic information for each slice, only one slice’s information can be shown at a time. As the sun-burst zooms to display selected topics, it is use-ful to provide context for the location of the topic within the overall topic hierarchy. Therefore, two contextual visualizations — a breadcrumb trail and a contextual anchor — are provided. Bread-crumb trails are often utilized to provide context during navigation, such as when navigating a file structure or large retail website. The breadcrumb
trail displays the hierarchical path leading to the current topic (Aery, 2007). A contextual anchor, or contextual snapshot (Mindek et al., 2013), is used to provide additional context to the user. The contextual anchor displays the entire hierarchical topic model to the user at all times. When the user selects a topic slice to view a section of the hier-archy in more detail, the contextual anchor high-lights the position of the selected topic within the hierarchical topic model. This offers context to the user, regardless of their location within the hi-erarchy. An example of the breadcrumb trail and contextual anchor is displayed in Figure 3.
5 Case Study
[image:4.595.119.480.61.301.2]pro-Figure 3: Our simple breadcrumb trail and conttual anchor offer constant context as the user ex-plores the visualization. Highlighted slices within the contextual anchor are those currently dis-played in the sunburst visualization.
cessed the corpus with HLDA using 10 topics for each level. This number of topics balances gran-ularity and accuracy. Using too many narrow top-ics results in information overload, whereas too few broad topics could be difficult to understand3.
We then visualized the resulting hierarchical topic model with Hi´erarchie as shown in Figure 2. As we were most interested in looking at the vari-ous theories surrounding the flight, we chose to explore one of the high-level topics, (plane, peo-ple, pilot, think, know), in more detail, because many of this topic’s sub-topics suggest specific theories related to the outcome of MH-370. Ta-ble 1 shows the 10 sub-topics for the “theory” topic represented by their 3 most probable terms. The bolded topics are those that suggest theories. Figure 4 shows the sunburst graph reoriented af-ter the selection of the main “theory” topic. The sunburst graph is labeled with the sub-topics that represent the selection of interesting theories.
These topics suggest four primary theories: that the plane landed, the plane crashed, the plane was hijacked by terrorists, or the pilot crashed the plane in an act of suicide. Hovering over the (plane,crash,crashed) topic shows the sub topics, and clicking the topic reorients the sunburst chart,
3Deviating from this number slightly may also be
effec-tive, and experimentation is required to determine the num-ber of topics that is the best fit for the current data set and end goal.
plane, crash, crashed plane, landed, land
plane, think, people
pilot, plane, hijacking terrorist, terrorism, passports
suicide, pilot, ocean
[image:5.595.339.494.60.203.2]Shah, Anwar, political plane, China, world phone, phones, cell evidence, think, make
Table 1: The 10 high-level topics of the model generated from running HLDA on the Malaysia Flight MH-370 corpus. The bolded topics suggest specific theories regarding the status of the plane.
crash, water, crashed failure, catastrophic, mayday
mechanical, failure, days plane, ocean, did
[image:5.595.89.271.62.267.2]plane, error, lost
Table 2: A selection of the sub-topics of discus-sion surrounding a plane crash scenario. These sub-topics suggest more detailed discussion. For example, that the plane crash may have resulted from a catastrophic mechanical failure or other er-ror.
as shown in Figure 5. The sub-topics under (plane,
crash, crashed) suggest more detailed discussion of a crash scenario, such as the plane crashing into the water, and that there may have been a catas-trophic mechanical failure or other error. Table 2 contains a selection of these sub-topics.
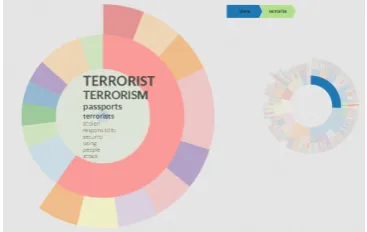
An alternate theory is suggested by the ( terror-ist,terrorism,passports) topic, which is shown in Figure 6. The sub-topics here suggest more de-tailed discussion involving terrorism as the cause for the plane’s disappearance. Table 3 contains a selection of these sub-topics.
[image:5.595.345.487.287.358.2]passports, stolen, using terrorists, crash, terrorist Muslim, Muslims, Islamic
[image:6.595.109.257.60.134.2]attack, going, terror responsibility, common, group
[image:6.595.322.510.144.260.2]Table 3: A selection of the sub-topics of discus-sion surrounding a terrorism scenario. These sub-topics include more details, such as the discussion of stolen passports, relevant to the theory that the plane disappearance is the result of an act of ter-rorism.
Figure 4: Sub-categories of interest have been purposely numbered for clarity. 1:(plane, crash,
crashed); 2: (plane, landed, land); 3: (terrorist,
terrorism,passports); 4: (suicide,pilot,ocean).
relevant information. Organizing all of this data by hand would be difficult and time consuming. This intuitive visualization in combination with our method for organizing the underlying data transforms a disparate corpus of documents into a useful and manageable information source. 6 Future Work and Conclusion
The Hi´earchie visualization and related hierarchi-cal topic modeling algorithm support the under-standing and exploration of text corpora that are too large to read. Although existing topic mod-eling algorithms effectively process large corpora, the resulting topic models are difficult to interpret in their raw format. Current visualization meth-ods only scale to a small number of topics, which cannot accurately represent a diverse corpus. Ad-ditional structure is required to organize a repre-sentative topic model of a large dataset into an
un-Figure 5: Clicking the (plane, crash, crashed) topic slice in the top-level (plane, people, pilot) visualization reorients the sunburst to display the slice as its root, enabling more detailed explo-ration of sub-topics.
[image:6.595.88.272.241.422.2] [image:6.595.324.508.513.629.2]derstandable and navigable analysis tool.
Our approach visualizes the hierarchical topic model produced by the HLDA algorithm to sup-port intuitive, directed browsing of topical struc-ture within a diverse collection of documents. As demonstrated in the Malaysia Airlines case study, this technique can be used to quickly gain insight about the diverse speculation surrounding a signif-icant, inconclusive event. Hi´earchie enables users to examine and gain insight from large, diverse datasets more efficiently than if they had to inter-pret complicated algorithmic output or read raw documents.
The sunburst visualization provides a clear overview of the structure of the model; however, individual topics are currently represented as lists of words ordered by their probability for the topic. This is non-optimal for topic understanding. Ad-ditionally, this topic information is displayed on hover, which does not easily support making com-parisons between topics. Future work includes im-plementing alternative techniques for displaying the topic information and performing an evalua-tion to determine which technique is most appro-priate for the intended use cases.
Future work also includes adding additional in-formation to the visualization through color and topic placement. In the current implementation, topic slices are currently colored by the most prevalent topic word. Coloring slices by sentiment or other topic-level metrics will enrich the visual-ization and improve the user’s ability to quickly discern different topics and their meaning within the model as a whole. Similarly, topic position in the sunburst does not currently provide any useful information. One possible layout is based on topic covariance, which is a metric of topic relatedness based on the frequency of topic pair co-occurrence within the documents of the corpus. An improved sunburst layout could take into account topic co-variance to optimize the layout such that related topics were positioned together at each level of the hierarchy.
Acknowledgements
We would like to thank Andrew McCallum for discussions related to the ideas behind our topic modeling approach. We would also like to thank Mark Frymire, Peter David, Jen Sikos, and Nic-hole Hansen for their support in the writing pro-cess. Additionally, we would like to
References
Sean C Aery. 2007. Breadcrumb navigation deploy-ment patterns in retail web sites.
David M Blei, Thomas L Griffiths, Michael I Jordan, and Joshua B Tenenbaum. 2003a. Hierarchical topic models and the nested chinese restaurant pro-cess. InNIPS, volume 16.
David M Blei, Andrew Y Ng, and Michael I Jordan. 2003b. Latent dirichlet allocation. the Journal of machine Learning research, 3:993–1022.
Mike Bostock. 2012a. Data Driven Documents (d3).
http://d3js.org.
Mike Bostock. 2012b. Zoomable sunburst. http:
//bl.ocks.org/mbostock/4348373.
Allison June-Barlow Chaney and David M Blei. 2012. Visualizing topic models. InICWSM.
Jason Chuang, Christopher D Manning, and Jeffrey Heer. 2012. Termite: Visualization techniques for assessing textual topic models. In Proceedings of the International Working Conference on Advanced Visual Interfaces, pages 74–77. ACM.
Jacob Eisenstein, Duen Horng Chau, Aniket Kittur, and Eric Xing. 2012. Topicviz: interactive topic explo-ration in document collections. InCHI’12 Extended Abstracts, pages 2177–2182. ACM.
Sara Irina Fabrikant and Andr´e Skupin. 2005. Cogni-tively plausible information visualization.
Matthew J Gardner, Joshua Lutes, Jeff Lund, Josh Hansen, Dan Walker, Eric Ringger, and Kevin Seppi. 2010. The topic browser: An interactive tool for browsing topic models. InNIPS Workshop on Chal-lenges of Data Visualization.
Thomas L Griffiths and Mark Steyvers. 2004. Find-ing scientific topics. Proceedings of the National academy of Sciences of the United States of Amer-ica, 101(Suppl 1):5228–5235.
Joseph B Kruskal and James M Landwehr. 1983. Ici-cle plots: Better displays for hierarchical clustering.
The American Statistician, 37(2):162–168.
Wei Li and Andrew McCallum. 2006. Pachinko allo-cation: Dag-structured mixture models of topic cor-relations.
David Mimno and Andrew McCallum. 2007. Orga-nizing the oca: learning faceted subjects from a li-brary of digital books. In Proceedings of the 7th ACM/IEEE-CS joint conference on Digital libraries, pages 376–385. ACM.
Peter Mindek, Stefan Bruckner, and M Eduard Gr¨oller. 2013. Contextual snapshots: Enriched visualization with interactive spatial annotations. InProceedings of the 29th Spring conference on Computer Graph-ics (SCCG 2013).
Kerry Rodden. 2013. Sequences sunburst. http:
//bl.ocks.org/kerryrodden/7090426.
Ben Shneiderman. 1996. The eyes have it: A task by data type taxonomy for information visualiza-tions. In Visual Languages, 1996. Proceedings., IEEE Symposium on, pages 336–343. IEEE.
Ben Shneiderman. 1998. Treemaps for
space-constrained visualization of hierarchies.
Alison Smith, Sana Malik, and Ben Shneiderman. 2014. Visual analysis of topical evolution in un-structured text: Design and evaluation of topicflow. John Stasko, Richard Catrambone, Mark Guzdial,