Sentence-Level Quality Estimation for MT System
Combination
Tsu yoshi Okita
1Rapha
ë
l Rubino
2J ose f van Genabith
3 (1) Dublin City University, Glasnevin, Dublin 9(2) NCLT, Dublin City University, Glasnevin, Dublin 9 (3) CNGL, Dublin City University, Glasnevin, Dublin 9
[email protected],[email protected]
A
BSTRACTThis paper provides the system description of the Dublin City University system combination module for our participation in the system combination task in the Second Workshop on Apply-ing Machine LearnApply-ing Techniques to Optimize the Division of Labour in Hybrid MT (ML4HMT-12). We incorporated a sentence-level quality score, obtained by sentence-level Quality Es-timation (QE), as meta information guiding system combination. Instead of using BLEU or (minimum average) TER, we select a backbone for the confusion network using the estimated quality score. For the Spanish-English data, our strategy improved 0.89 BLEU points absolute compared to the best single score and 0.20 BLEU points absolute compared to the standard system combination strategy.
1 Introduction
This paper describes a new extension to our system combination module in Dublin City Univer-sity. We deployed a Quality Estimation technique (Blatz et al., 2003; Rubino et al., 2012) in our system combination module for the system combination task in the ML4HMT-2012 work-shop.
System combination is a strategy (Bangalore et al., 2001; Matusov et al., 2006; Tromble et al., 2008; Du and Way, 2010; DeNero et al., 2009; Okita and van Genabith, 2012) that provides a way to combine multiple translation outputs from potentially very different MT systems includ-ing Rule-based MT (RBMT) and SMT. It is often the case that a practical system combination strategy involves a confusion network (Matusov et al., 2006), which is also the case in our sys-tem, in order to combine fragments from a number of systems. The standard process to build such confusion networks consists of two steps: (1) a selection of a backbone (or a skeleton), and (2) monolingual word alignment (Matusov et al., 2006; Sim et al., 2007; He et al., 2008; Karakos et al., 2008) between a backbone and other hypotheses in a pairwise manner. Once such a confusion network is built, we can search for the best path using a (monotonic) consen-sus network decoder. It is noted that there are also approaches which select multiple possible hypotheses as backbones (Leusch and Ney, 2010).
One important factor in the overall performance of such a system combination method resides in the selection of a backbone, which is the main focus in this paper. There are several rea-sons why a good backbone selection is very important. First, in practice, it is often the case that the final translation output is identical to the backbone even if the overall combination method includes a confusion network. Second, it depends on the backbone whether some seg-ments which do not match with the backbone will be discarded. In fact, important segseg-ments potentially contributing to good translation quality, may not be considered only because such fragments do not match with the backbone.
Rosti et al. (2007) propose (minimum average) TER to select a backbone. This alignment metric selects the hypotheses that agrees with the other hypotheses on average. Another com-mon alignment metric is BLEU (Tromble et al., 2008; Du and Way, 2010; Duh et al., 2011; Okita and van Genabith, 2012). This metric selects a hypothesis that performs best. This paper proposes a novel method to use (sentence-level) Quality Estimation (QE) to select a backbone. Since QE quantifies the confidence of the MT output (Specia et al., 2009), this selection would roughly in line with BLEU, which selects the best performing hypothesis as a backbone. Note that one difference is that BLEU and TER are used as a loss function in MBR decoding (Kumar and Byrne, 2002; Sim et al., 2007), while we select the best sentence in terms of (sentence-level) QE. Hence, in doing so, we do not minimize the worst case risk.
The main part of this paper provides an algorithm to use QE as the selection mechanism of a backbone of a confusion network. However, such a selection, by itself, can be considered as one method of (sentence-level) system combination. What is more, the two QE-based meth-ods yield translation outputs which differ in quality. Because of this, this paper presents two algorithms: (1) system combination via QE-selected backbone, and (2) QE-based sentence selection.
2 Our Method
We describe the QE-based backbone selection method used in our algorithm in Subsection 2.1. Following this, we briefly outline how we used QE as (sentence-level) system combination (the 2nd algorithm of this paper). Subsection 2.2 incorporates this QE method to select a backbone.
2.1 Sentence-Level QE
QE methods (Blatz et al., 2003) are developed for situations where references are not available, which contrasts with automatic MT evaluation using BLEU (Papineni et al., 2002) and TER (Snover et al., 2006). The approach described in this subsection is based on QE at the sentence level. To select one translation from the four systems participating in our system combination approach, we want to predict quality scores for all the translations and pick the translation with the best score. To obtain these scores, we first use the tuning dataset and compute TER scores at the sentence level for each translation output of the four systems individually. These scores, associated with feature vectors corresponding to the source and target sentence pairs, are used to train a regression model. This model is then used to predictTERscores on the test dataset.
2.1.1 Experimental Setup
The machine learning toolkit used in our experiments is LIBSVM (Chang and Lin, 2011), an
implementation of the Support Vector Regression (SVR) method. We use the Radial Basis Function (RBF) kernel as it is widely used in the QE for the MT community and it usually achieves good performance (Specia et al., 2009; Soricut et al., 2012). An important aspect of SVR with RBF kernel is hyper parameter optimization. In our setup, three parameters have to be optimized: c(the penalty factor),γ(the kernel parameter) andε(the approximated function accuracy level).
MAE=1n
n X
i=1
|re fi−predi| (1) RMSE= s
1
n
n X
i=1
re fi−predi2 (2)
We optimize these parameters usinggrid-search, an iterative process computingn-fold cross-validation on each possible triplet of parameters and selecting the best set of parameters ac-cording to a score (usually the Mean Absolute Error or the Root Mean Square Error, described in 1 and 2, wherenis the number of test instances,re f andpred are the reference and predicted TER scores of theith test instance respectively). This method is expensive in terms of computing time (we use 5-fold cross-validation at each iteration) and it is not feasible do do this in an acceptable amount of time for the whole tuning set provided by the shared task (20k
2.1.2 Feature Sets
In order to capture relevant information from the source sentences and their translations, we extract different types of features which capture information about the source sentence com-plexity, the target sentence fluency, but also the difference between the four MT systems’ out-puts.
Surface– These features are extracted directly by analyzing the source and the target sen-tences. 10 features are extracted from the source and the target sentences: sentence length, average word length, number of punctuation marks, number of upper-case letters and average number of words in the sentence. 5 features are given by the source and target ratio of the previous features. A total of 15 features are extracted from the surface information.
Language Model– A total of 6 LM features are extracted from the source and the target sen-tences according to 5-gram Kneser-Ney discounted LMs built using the SRILM toolkit (Stolcke, 2002) (2 log-probability scores, 4 perplexity scores with or without start and end of sequence tags).
MT Outputs Difference– To capture the difference between the four MT outputs given one source sentence, we consider iteratively each MT output as atranslation referenceand compare it to the three other MT outputs using the software TERCOM1. This method allows us to extract
detailed information about the number of insertions, deletions, substitutions, etc., as well as the TER scores between the current MT output and the others. A total of 30 features are extracted following this procedure.
From these three feature sources, we build two feature sets. The first feature set, corresponding to our first revision (R1), contains only target LM features and the MT Output Difference features, with a total of 33 features. The LM used to extract the features is built using the target side of the tuning set provided by the shared task organizers. The second feature set, corresponding to our second revision (R2), contains all the features presented in this section, with a total of 51 features. The LMs used to extract the features are built using EUROPARL2,
JRC-ACQUIS3, and UNCORPUS4whose size is around 160,000k sentence pairs.
2.2 System Combination
The first step is to select a backbone using the results of QE method described in the last Subsection 2.1. In the second step, based on the backbone selected in the first step, we build the confusion network by aligning the hypotheses with the backbone. In this process, we used the TER distance (Snover et al., 2006) between the backbone and the hypotheses. We do this for all the hypotheses sentence by sentence. Note that in this process, deleted words are substituted as NULL words (orε-arcs).
In the third step, the consensus translation is extracted as the best path in the confusion net-work. This (monotonic) consensus decoding selects the best wordˆekby the word posterior
probability via voting at each positionkin the confusion network, as in (3):
ˆ
Ek = arg maxe∈E pk(e|F) (3) 1http://www.cs.umd.edu/~snover/tercom/tercom-0.7.25.tgz
2http://www.statmt.org/europarl 3http://ipsc.jrc.ec.europa/
but with the following features as well: 4-gram and 5-gram target language model, word length penalty, and NULL word length penalty. Note that Minimum Error-Rate Training (MERT) is used to tune the weights of the confusion network.
3 Experiments
ML4HMT-2012 provides four translation outputs s1to s4 from APERTIUM, LUCY, PB-SMT
(MOSES) and HPB-SMT (MOSES). The tuning data consists of 20,000 sentence pairs while
the test data consists of 3,003 sentence pairs.
Our experimental setting is as follows. We use our system combination module (Du and Way, 2010; Okita and van Genabith, 2012) which includes a language modeling tool, a MERT pro-cess, and MBR decoding of its own. We use the BLEU metric as loss function in MBR decoding. We use TERP5as alignment metrics in monolingual word alignment.
3.1 Pre-study: Evaluation of QE Model
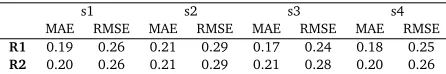
We evaluated our QE model on the test set by predicting TER scores at the sentence level and comparing them with the reference. We used two measures described by the equations 1 and 2. The scores are presented in Table 1. These results were quite surprising because the larger feature set (R2) did not reach the best results in terms of TER score prediction. Using only target LM features based on a small dataset and the MT output differences (R1) leads to MAE scores between 0.21 and 0.17. For this feature set, the most accurate sentence level score prediction was obtained on the MT systems3, which corresponds to the PBSMT implementation MOSES, while the systems2, which corresponds to the RBMT system LUCY, leads to the worse score prediction. In other words, it is more difficult to predict sentence-level scores ofs2compared tos3.
s1 s2 s3 s4
MAE RMSE MAE RMSE MAE RMSE MAE RMSE
R1 0.19 0.26 0.21 0.29 0.17 0.24 0.18 0.25
[image:5.420.105.328.325.362.2]R2 0.20 0.26 0.21 0.29 0.21 0.28 0.20 0.26
Table 1: Error scores of the QE model when predicting TER scores at the sentence level on the test set for the four MT systems.
3.2 Main Results
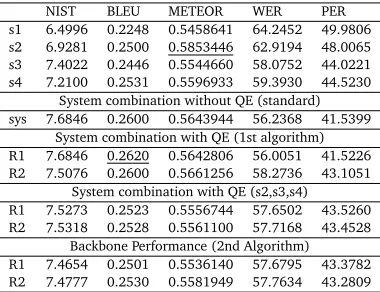
Table 2 shows the performance on the development set. Table 3 shows the results of Algorithm 1 and 2. The first four lines show the single best performance of each translation output where s4 achieves 25.31 BLEU points which is the best among four MT systems. The standard system combination results, shown in the next line, was 26.00 BLEU points, which improved 0.69 BLEU points absolute. We used two different feature set in the QE method: R1 corresponds to the small feature set, while R2 corresponds to the larger feature set.
Results for the first algorithm (system combination with QE) are shown in the next two lines. R1 achieved 26.20 BLEU points, which improved 0.89 BLEU points absolute compared to the best single system. R1 improved 0.20 BLEU points absolute compared to the standard
NIST BLEU METEOR WER PER s1 6.7456 0.2016 0.5712806 67.2881 54.7614 s2 7.3982 0.2388 0.6195136 63.9684 51.6444 s3 9.4167 0.3400 0.6650655 49.9341 37.4271 s4 9.1167 0.3273 0.6744035 52.0578 38.9179
[image:6.420.102.304.68.136.2]System combination without QE (standard) syscom 9.2912 0.3268 0.6531500 50.7681 37.2779
Table 2: Table shows the performance of translation outputs s1 to s4 and results of system combination on development set.
system combination results. R2 achieved 26.00 BLEU points, which improved 0.69 BLEU points absolute, which did not improve over the standard system combination results.
NIST BLEU METEOR WER PER
s1 6.4996 0.2248 0.5458641 64.2452 49.9806 s2 6.9281 0.2500 0.5853446 62.9194 48.0065 s3 7.4022 0.2446 0.5544660 58.0752 44.0221 s4 7.2100 0.2531 0.5596933 59.3930 44.5230
System combination without QE (standard) sys 7.6846 0.2600 0.5643944 56.2368 41.5399
System combination with QE (1st algorithm) R1 7.6846 0.2620 0.5642806 56.0051 41.5226 R2 7.5076 0.2600 0.5661256 58.2736 43.1051
System combination with QE (s2,s3,s4) R1 7.5273 0.2523 0.5556744 57.6502 43.5260 R2 7.5318 0.2528 0.5561100 57.7168 43.4528
[image:6.420.108.298.208.354.2]Backbone Performance (2nd Algorithm) R1 7.4654 0.2501 0.5536140 57.6795 43.3782 R2 7.4777 0.2530 0.5581949 57.7634 43.2809
Table 3: This table includes our results by 1st algorithm and 2nd algorithm.
Conclusion and perspectives
This paper presents the method to use QE for backbone selection in system combination. This strategy improved 0.89 BLEU points absolute compared to the best single system and 0.20 BLEU points absolute compared to the standard system combination strategy.
However, there are two issues. At first sight, our strategy seemed to work quite well as ex-plained in Section 3. Table 4 shows results using two other ways to select a backbone. The
NIST BLEU METEOR WER PER
min ave TER 7.6231 0.2638 0.5652795 56.3967 41.6092 s2 backbone 7.6371 0.2648 0.5606801 56.0077 42.0075
first method used the minimum average TER (Rosti et al., 2007) while the second method sim-ply selects the output of system 2 (Lucy LT RBMT system outputs). The second method is based on the intuition that the output of Lucy LT RBMT system is more likely to be grammatically well-formed compared to the other MT outputs. This is somewhat surprising but this result was the best among the methods.
Table 5 shows two examples where TER scores at the sentence-level are used to compare the QE and the system combination outputs. In Case A, the QE output has a higher TER score compared to that of the system combination, while it is the opposite in Case B. We observe in both cases that the QE output leads to a better translation adequacy, even when its TER score is lower than the system combination output. This is related to the features based on the target LM (log-probability and perplexities) used in our QE approach. In Case B particularly, the system combination leads to a better TER score but the negation “no” is replaced by “do”, which leads to a lower adequacy. These two cases emphasize the fact that a better automatic score does not necessarily means a better translation quality.
System Combination TER Degradation(Case A) src "Me voy a tener que apuntar a un curso de idiomas", bromea.
QE ’I am going to have to point to a language course "joke.
comb I am going to have to point to a of course ", kids.
ref "I’ll have to get myself a language course," he quips.
System Combination TER Improvement(Case B)
src Sorprendentemente, se ha comprobado que los nuevos concejales casi no comprenden esos conocidos conceptos.
QE Surprisingly, it appears that the new councillors almost no known under-stand these concepts.
comb Surprisingly, it appears that the new councillors almost do known under-stand these concepts.
ref Surprisingly, it turned out that the new council members do not understand the well-known concepts.
Table 5: Translation output comparison between the standalone Quality Estimation approach and the System Combination.
Further study is, thus, required to investigate these two issues. Especially regarding the first issue, we would like to examine the rationale behind why the backbone provided by Lucy RBMT achieves the highest score even though this system is not the best performing system, neither in terms of BLEU nor TER, but provides translation output which is more grammatical than the other MT outputs.
Additionally, it is also possible that the reason why our method did perform less than Lucy backbone may be related to the performance of monolingual word alignment. If this is the case, the monolingual version of MAP-based word aligner which can incorporate prior knowledge (Okita et al., 2010b,a; Okita and Way, 2011; Okita, 2012) may be the next target.
Acknowledgments
References
Bangalore, S., Bordel, G., and Riccardi, G. (2001). Computing consensus translation from multiple Machine Translation systems.In Proceedings of the IEEE Automatic Speech Recognition and Understanding Workshop (ASRU), pages 350–354.
Blatz, J., Fitzgerald, E., Foster, G., Gandrabur, S., Goutte, C., Kulesza, A., Sanchis, A., and Ueffing, N. (2003). Confidence Estimation for Machine Translation. InJHU/CLSP Summer Workshop Final Report.
Chang, C.-C. and Lin, C.-J. (2011). LIBSVM: A library for Support Vector Machines. ACM Transactions on Intelligent Systems and Technology, 2:27:1–27:27.
DeNero, J., Chiang, D., and Knight, K. (2009). Fast consensus decoding over translation forests. In proceedings of the Joint Conference of the 47th Annual Meeting of the ACL and the 4th International Joint Conference on Natural Language Processing of the AFNLP, pages 567– 575.
Du, J. and Way, A. (2010). An incremental three-pass system combination framework by combining multiple hypothesis alignment methods. International Journal of Asian Language Processing, 20(1):1–15.
Duh, K., Sudoh, K., Wu, X., Tsukada, H., and Nagata, M. (2011). Generalized minimum Bayes risk system combination. InProceedings of 5th International Joint Conference on Natural Language Processing, pages 1356–1360, Chiang Mai, Thailand. Asian Federation of Natural Language Processing.
He, X., Yang, M., Gao, J., Nguyen, P., and Moore, R. (2008). Indirect-HMM-based hypoth-esis alignment for combining outputs from Machine Translation systems. In Proceedings of Empirical Methods in Natural Language Processing (EMNLP08), page 98–107.
Karakos, D., Eisner, J., Khudanpur, S., and Dreyer, M. (2008). Machine Translation system combination using ITG-based alignments. In Proceedings of the 46th Annual Meeting of the Association for Computational Linguistics (ACL-08), page 81–84.
Kumar, S. and Byrne, W. (2002). Minimum Bayes-Risk word alignment of bilingual texts.In Proceedings of the Empirical Methods in Natural Language Processing (EMNLP 2002), pages 140–147.
Leusch, G. and Ney, H. (2010). The RWTH system combination system for WMT 2010. In Proceedings of the Joint 5th Workshop on Statistical Machine Translation and MetricsMATR, pages 315–320.
Matusov, E., Ueffing, N., and Ney, H. (2006). Computing consensus translation from multiple Machine Translation systems using enhanced hypotheses alignment.In Proceedings of the 11st Conference of the European Chapter of the Association for Computational Linguistics (EACL), pages 33–40.
pages 3241–3248, Istanbul, Turkey. European Language Resources Association (ELRA). ACL Anthology Identifier: L12-1655.
Okita, T., Graham, Y., and Way, A. (2010a). Gap Between Theory and Practice: Noise Sensitive Word Alignment in Machine Translation. In Proceedings of the Workshop on Applications of Pattern Analysis (WAPA2010). Cumberland Lodge, England.
Okita, T., Guerra, A. M., Graham, Y., and Way, A. (2010b). Multi-Word Expression sensi-tive word alignment. In Proceedings of the Fourth International Workshop On Cross Lingual Information Access (CLIA2010, collocated with COLING2010), Beijing, China., pages 1–8. Okita, T. and van Genabith, J. (2012). Minimum Bayes risk decoding with enlarged hy-pothesis space in system combination.In Proceedings of the 13th International Conference on Intelligent Text Processing and Computational Linguistics (CICLING 2012). LNCS 7182 Part II. A. Gelbukh (Ed.), pages 40–51.
Okita, T. and Way, A. (2011). Given Bilingual Terminology in Statistical Machine Translation: MWE-sensitve Word Alignment and Hierarchical Pitman-Yor Process-based Translation Model Smoothing. In Proceedings of the 24th International Florida Artificial Intelligence Research Society Conference (FLAIRS-24), pages 269–274.
Papineni, K., Roukos, S., Ward, T., and Zhu, W. (2002). BLEU: a method for automatic evaluation of Machine Translation. InACL, pages 311–318.
Rosti, A.-V. I., Matsoukas, S., and Schwartz, R. (2007). Improved Word-Level System Combi-nation for Machine Translation. In Proceedings of the 45th Annual Meeting of the Association for Computational Linguistics, pages 312–319.
Rubino, R., Foster, J., Wagner, J., Roturier, J., Kaljahi, R. S. Z., and Hollowood, F. (2012). DCU-Symantec submission for the WMT 2012 quality estimation task.In Proceedings of WMT. Sim, K. C., Byrne, W. J., Gales, M. J., Sahbi, H., and Woodland, P. C. (2007). Consensus network decoding for Statistical Machine Translation system combination. In Proceedings of the ICASSP, 4:105–108.
Snover, M., Dorr, B., Schwartz, R., Micciulla, L., and Makhoul, J. (2006). A study of Trans-lation Edit Rate with targeted human annotation. InProceedings of Association for Machine Translation in the Americas, pages 223–231.
Soricut, R., Bach, N., and Wang, Z. (2012). The SDL language weaver systems in the WMT12 quality estimation shared task. InProceedings of the Seventh Workshop on Statistical Machine Translation, pages 145–151, Montréal, Canada. Association for Computational Linguistics. Specia, L., Cancedda, N., Dymetman, M., Turchi, M., and Cristianini, N. (2009). Estimating the sentence-level quality of Machine Translation systems. InEAMT, pages 28–35.
Stolcke, A. (2002). SRILM-an extensible language modeling toolkit. InInterSpeech, volume 2, pages 901–904.