http://www.scirp.org/journal/ajor ISSN Online: 2160-8849
ISSN Print: 2160-8830
DOI: 10.4236/ajor.2017.75019 Sep. 1, 2017 272 American Journal of Operations Research
Developing a New Reformulation of Single
Level Capacitated Lot Sizing Problem (SLCLSP)
with Set up, Shortage and Inventory Costs
R. R. K. Sharma, Vimal Kumar, Nilanjan Das Khan
Department of Industrial & Management Engineering,Indian Institute of Technology, Kanpur, India
Abstract
Formulation of SLCLSP given by Pochet and Wolsey
[1]
had set up, variables,
inventory and shortage cost. We give a new reformulation where SLCLSP is
reduced to set up and inventory variables. We find that this reformulation has
less number of real variables than the reformulation of Pochet and Wolsey
[1]
.
It is argued that this leads to computations advantages, and this is supported
by the empirical investigation that we carried out.
Keywords
Reformulation of SLCLSP
1. Introduction and Literature Review
Capacitated lot sizing problem (CLSP) is well studied in literature, see Verma
[2]
,
and Verma and Sharma
[3]
[4]
[5]
for a summary of recent works on CLSP. For
literature on reformulation of CLSP, see Pochet and Wolsey
[1]
and Miller and
Nemhauser et al.
[6]
for a detailed exposition on reformulations of CLSP. In this
paper we give a new approach which leads to a better reformulation of CLSP.
2. Formulation by Pochet and Wolsey [1]
Indices Used
t: Set of the Time period from 1, ···, n, for which we are taking decisions;
Definition of Constant
t
f
: Fixed setup cost in time period “t”;
t
p
: Per unit production cost in time period “t”;
t
d
: Demand in time period “t”, here demand is independent;
How to cite this paper: Sharma, R.R.K., Kumar, V. and Khan, N.D. (2017) Devel-oping a New Reformulation of Single Level Capacitated Lot Sizing Problem (SLCLSP) with Set up, Shortage and Inventory Costs. American Journal of Operations Research, 7, 272-281.
https://doi.org/10.4236/ajor.2017.75019
Received: July 20, 2017 Accepted: August 29, 2017 Published: September 1, 2017
Copyright © 2017 by authors and Scientific Research Publishing Inc. This work is licensed under the Creative Commons Attribution-NonCommercial International License (CC BY-NC 4.0). http://creativecommons.org/licenses/by-nc/4.0/
DOI: 10.4236/ajor.2017.75019 273 American Journal of Operations Research
t
h
: Per unit inventory carrying cost in time period “t”;
t
sh
: Per unit shortage cost in time period “t”;
t
c
: Production capacity in the time period “t”;
Definition of Variables
t
x
: Number of product produced in time period “t”;
t
y
: Binary variable takes value “1” if machine setup to produce in time period
“t”, “0”, otherwise;
t
I
: In stock inventory at the end of time period “t”;
t
s
: Backlog in the end of period “t”;
Mathematical Model
1
1 1 0 1
Minimize
n n n n
t t t t t t t t
t t t t
Z
f
y
p
x
h
I
sh
s
−
= = = =
=
∑
∗ +
∑
∗ +
∑
∗ +
∑
∗
(1)
Production balance constraints
(
1)
(
1)
, 1
t t t t t t
x
+
s
−
s
−= +
d
I
−
I
−≤ ≤
t
n
(2)
Capacity constraints
, 1
t t t
x
≤ ∗
c
y
≤ ≤
t
n
(3)
0
o n
I
=
s
=
(4)
Pochet and Wolsey
[1]
gave the following constraint that lead to
reformula-tion:
t t t
x
= ∗
y
c
(5)
Non-negativity constraints
, ,
0
t t t
x r s
≥
(6)
SLCLSP as given by Pochet and Wolsey
[1]
is Model A1: Min (1); s.t. (2), (3),
(4) and (6). By using (5) in place of (3) lead to reformulation (called Model A2:
min (1); s.t. (2), (4), (5) and (6). Model A1 has less number of variables as
varia-ble “x” is eliminated.
We add a new constraint given below (see,
[7]
) that can be used in place of (2):
1 1
1 1
0 1
1 1
,
1,
,
t t
t t t t
t t
I
x
s
D
I
t
T
= =
+
∑
+
=
∑
+
∀ =
(7)
Using (5) we get the following (called Model A3): Min Z1 (or (8)); s.t. (4), (5),
(6), (7).
1 1 1 1
Min 1
T T T T
t t t t t t t t t
t t t t
Z
f
y
p
c
y
h
I
sh
s
= = = =
=
∑
∗ +
∑
∗ ∗ +
∑
∗ +
∑
∗
(8)
We use (7) to eliminate s
tfrom the problem A2 to get: Min Z2 (or (9)); s.t. (4),
(5), (6).
1 1
1 0
1 1 1 1 1 1
Min 2
t
T T T T
t t t t t
t
t t t
t
t t t t
t t t t t
Z
f
y
p
c
y
h
I
s
h
D
I
I
c
y
=
= = = = =
=
∗ +
∗ ∗ +
∗ +
∗
∗
+
− −
∑
∑
∑
∑
∑
∑
(9)
DOI: 10.4236/ajor.2017.75019 274 American Journal of Operations Research
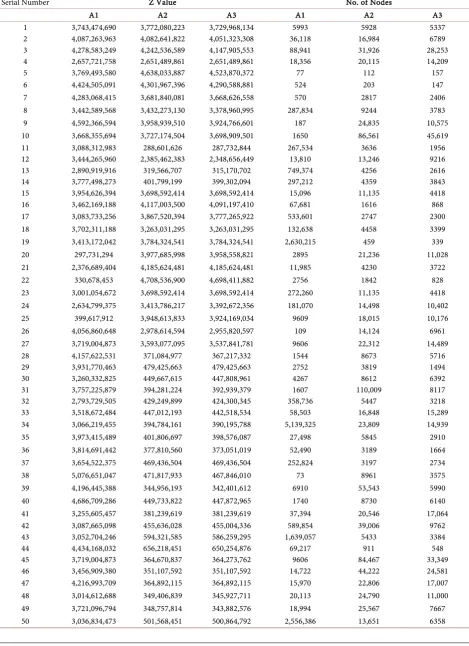
Table 1. Problem for 50 time period (Z value and No. of node processed in brand and bound procedure).
Serial Number Z Value No. of Nodes
A1 A2 A3 A1 A2 A3
1 3,743,474,690 3,772,080,223 3,729,968,134 5993 5928 5337
2 4,087,263,963 4,082,641,822 4,051,323,308 36,118 16,984 6789
3 4,278,583,249 4,242,536,589 4,147,905,553 88,941 31,926 28,253
4 2,657,721,758 2,651,489,861 2,651,489,861 18,356 20,115 14,209
5 3,769,493,580 4,638,033,887 4,523,870,372 77 112 157
6 4,424,505,091 4,301,967,396 4,290,588,881 524 203 147
7 4,283,068,415 3,681,840,081 3,668,626,558 570 2817 2406
8 3,442,589,568 3,432,273,130 3,378,960,995 287,834 9244 3783
9 4,592,366,594 3,958,939,510 3,924,766,601 187 24,835 10,575
10 3,668,355,694 3,727,174,504 3,698,909,501 1650 86,561 45,619
11 3,088,312,983 288,601,626 287,732,844 267,534 3636 1956
12 3,444,265,960 2,385,462,383 2,348,656,449 13,810 13,246 9216
13 2,890,919,916 319,566,707 315,170,702 749,374 4256 2616
14 3,777,498,273 401,799,199 399,302,094 297,212 4359 3843
15 3,954,626,394 3,698,592,414 3,698,592,414 15,096 11,135 4418
16 3,462,169,188 4,117,003,500 4,091,197,410 67,681 1616 868
17 3,083,733,256 3,867,520,394 3,777,265,922 533,601 2747 2300
18 3,702,311,188 3,263,031,295 3,263,031,295 132,638 4458 3399
19 3,413,172,042 3,784,324,541 3,784,324,541 2,630,215 459 339
20 297,731,294 3,977,685,998 3,958,558,821 2895 21,236 11,028
21 2,376,689,404 4,185,624,481 4,185,624,481 11,985 4230 3722
22 330,678,453 4,708,536,900 4,698,411,882 2756 1842 828
23 3,001,054,672 3,698,592,414 3,698,592,414 272,260 11,135 4418
24 2,634,799,375 3,413,786,217 3,392,672,356 181,070 14,498 10,402
25 399,617,912 3,948,613,833 3,924,169,034 9609 18,015 10,176
26 4,056,860,648 2,978,614,594 2,955,820,597 109 14,124 6961
27 3,719,004,873 3,593,077,095 3,537,841,781 9606 22,312 14,489
28 4,157,622,531 371,084,977 367,217,332 1544 8673 5716
29 3,931,770,463 479,425,663 479,425,663 2752 3819 1494
30 3,260,332,825 449,667,615 447,808,961 4267 8612 6392
31 3,757,225,879 394,281,224 392,939,379 1607 110,009 8117
32 2,793,729,505 429,249,899 424,300,345 358,736 5447 3218
33 3,518,672,484 447,012,193 442,518,534 58,503 16,848 15,289
34 3,066,219,455 394,784,161 390,195,788 5,139,325 23,809 14,939
35 3,973,415,489 401,806,697 398,576,087 27,498 5845 2910
36 3,814,691,442 377,810,560 373,051,019 52,490 3189 1664
37 3,654,522,375 469,436,504 469,436,504 252,824 3197 2734
38 5,076,651,047 471,817,933 467,846,010 73 8961 3575
39 4,196,445,388 344,956,193 342,401,612 6910 53,543 5990
40 4,686,709,286 449,733,822 447,872,965 1740 8730 6140
41 3,255,605,457 381,239,619 381,239,619 37,394 20,546 17,064
42 3,087,665,098 455,636,028 455,004,336 589,854 39,006 9762
43 3,052,704,246 594,321,585 586,259,295 1,639,057 5433 3384
44 4,434,168,032 656,218,451 650,254,876 69,217 911 548
45 3,719,004,873 364,670,837 364,273,762 9606 84,467 33,349
46 3,456,909,380 351,107,592 351,107,592 14,722 44,222 24,581
47 4,216,993,709 364,892,115 364,892,115 15,970 22,806 17,007
48 3,014,612,688 349,406,839 345,927,711 20,113 24,790 11,000
49 3,721,096,794 348,757,814 343,882,576 18,994 25,567 7667
DOI: 10.4236/ajor.2017.75019 275 American Journal of Operations Research
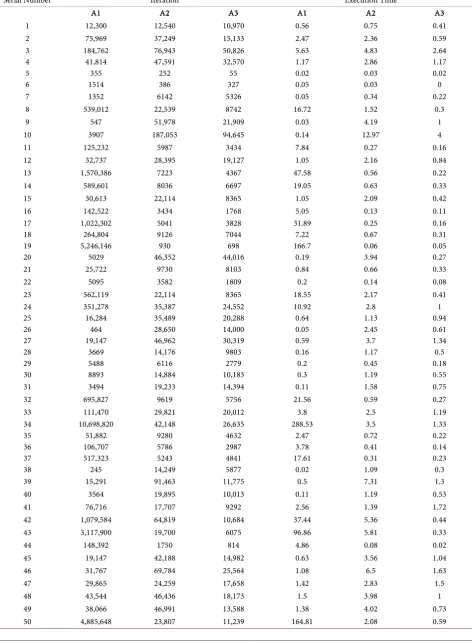
Table 2. Problem for 50 time period (Iteration and execution time in GAMS).
Serial Number Iteration Execution Time
A1 A2 A3 A1 A2 A3
1 12,300 12,540 10,970 0.56 0.75 0.41
2 75,969 37,249 15,133 2.47 2.36 0.59
3 184,762 76,943 50,826 5.63 4.83 2.64
4 41,814 47,591 32,570 1.17 2.86 1.17
5 355 252 55 0.02 0.03 0.02
6 1514 386 327 0.05 0.03 0
7 1352 6142 5326 0.05 0.34 0.22
8 539,012 22,539 8742 16.72 1.52 0.3
9 547 51,978 21,909 0.03 4.19 1
10 3907 187,053 94,645 0.14 12.97 4
11 125,232 5987 3434 7.84 0.27 0.16
12 32,737 28,395 19,127 1.05 2.16 0.84
13 1,570,386 7223 4367 47.58 0.56 0.22
14 589,601 8036 6697 19.05 0.63 0.33
15 30,613 22,114 8365 1.05 2.09 0.42
16 142,522 3434 1768 5.05 0.13 0.11
17 1,022,302 5041 3828 31.89 0.25 0.16
18 264,804 9126 7044 7.22 0.67 0.31
19 5,246,146 930 698 166.7 0.06 0.05
20 5029 46,352 44,016 0.19 3.94 0.27
21 25,722 9730 8103 0.84 0.66 0.33
22 5095 3582 1809 0.2 0.14 0.08
23 562,119 22,114 8365 18.55 2.17 0.41
24 351,278 35,387 24,552 10.92 2.8 1
25 16,284 35,489 20,288 0.64 1.13 0.94
26 464 28,650 14,000 0.05 2.45 0.61
27 19,147 46,962 30,319 0.59 3.7 1.34
28 3669 14,176 9803 0.16 1.17 0.5
29 5488 6116 2779 0.2 0.45 0.18
30 8893 14,884 10,183 0.3 1.19 0.55
31 3494 19,233 14,394 0.11 1.58 0.75
32 695,827 9619 5756 21.56 0.59 0.27
33 111,470 29,821 20,012 3.8 2.5 1.19
34 10,698,820 42,148 26,635 288.53 3.5 1.33
35 51,882 9280 4632 2.47 0.72 0.22
36 106,707 5786 2987 3.78 0.41 0.14
37 517,323 5243 4841 17.61 0.31 0.23
38 245 14,249 5877 0.02 1.09 0.3
39 15,291 91,463 11,775 0.5 7.31 1.3
40 3564 19,895 10,013 0.11 1.19 0.53
41 76,716 17,707 9292 2.56 1.39 1.72
42 1,079,584 64,819 10,684 37.44 5.36 0.44
43 3,117,900 19,700 6075 96.86 5.81 0.33
44 148,392 1750 814 4.86 0.08 0.02
45 19,147 42,188 14,982 0.63 3.56 1.04
46 31,767 69,784 25,564 1.08 6.5 1.63
47 29,865 24,259 17,658 1.42 2.83 1.5
48 43,544 46,436 18,173 1.5 3.98 1
49 38,066 46,991 13,588 1.38 4.02 0.73
DOI: 10.4236/ajor.2017.75019 276 American Journal of Operations Research
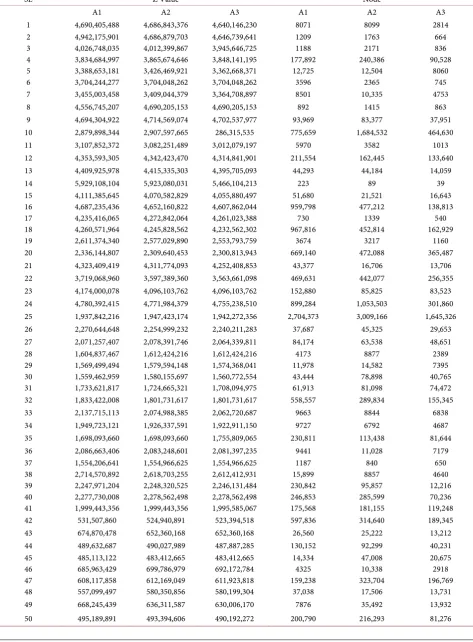
Table 3. Problem for 60 time period (Z value and No. of nodes).
SL Z Value Node
A1 A2 A3 A1 A2 A3
1 4,690,405,488 4,686,843,376 4,640,146,230 8071 8099 2814
2 4,942,175,901 4,686,879,703 4,646,739,641 1209 1763 664
3 4,026,748,035 4,012,399,867 3,945,646,725 1188 2171 836
4 3,834,684,997 3,865,674,646 3,848,141,195 177,892 240,386 90,528
5 3,388,653,181 3,426,469,921 3,362,668,371 12,725 12,504 8060
6 3,704,244,277 3,704,048,262 3,704,048,262 3596 2365 745
7 3,455,003,458 3,409,044,379 3,364,708,897 8501 10,335 4753
8 4,556,745,207 4,690,205,153 4,690,205,153 892 1415 863
9 4,694,304,922 4,714,569,074 4,702,537,977 93,969 83,377 37,951
10 2,879,898,344 2,907,597,665 286,315,535 775,659 1,684,532 464,630
11 3,107,852,372 3,082,251,489 3,012,079,197 5970 3582 1013
12 4,353,593,305 4,342,423,470 4,314,841,901 211,554 162,445 133,640
13 4,409,925,978 4,415,335,303 4,395,705,093 44,293 44,184 14,059
14 5,929,108,104 5,923,080,031 5,466,104,213 223 89 39
15 4,111,385,645 4,070,582,829 4,055,880,497 51,680 21,521 16,643
16 4,687,235,436 4,652,160,822 4,607,862,044 959,798 477,212 138,813
17 4,235,416,065 4,272,842,064 4,261,023,388 730 1339 540
18 4,260,571,964 4,245,828,562 4,232,562,302 967,816 452,814 162,929
19 2,611,374,340 2,577,029,890 2,553,793,759 3674 3217 1160
20 2,336,144,807 2,309,640,453 2,300,813,943 669,140 472,088 365,487
21 4,323,409,419 4,311,774,093 4,252,408,853 43,377 16,706 13,706
22 3,719,068,960 3,597,389,360 3,563,661,098 469,631 442,077 256,355
23 4,174,000,078 4,096,103,762 4,096,103,762 152,880 85,825 83,523
24 4,780,392,415 4,771,984,379 4,755,238,510 899,284 1,053,503 301,860
25 1,937,842,216 1,947,423,174 1,942,272,356 2,704,373 3,009,166 1,645,326
26 2,270,644,648 2,254,999,232 2,240,211,283 37,687 45,325 29,653
27 2,071,257,407 2,078,391,746 2,064,339,811 84,174 63,538 48,651
28 1,604,837,467 1,612,424,216 1,612,424,216 4173 8877 2389
29 1,569,499,494 1,579,594,148 1,574,368,041 11,978 14,582 7395
30 1,559,462,959 1,580,155,697 1,560,772,554 43,444 78,898 40,765
31 1,733,621,817 1,724,665,321 1,708,094,975 61,913 81,098 74,472
32 1,833,422,008 1,801,731,617 1,801,731,617 558,557 289,834 155,345
33 2,137,715,113 2,074,988,385 2,062,720,687 9663 8844 6838
34 1,949,723,121 1,926,337,591 1,922,911,150 9727 6792 4687
35 1,698,093,660 1,698,093,660 1,755,809,065 230,811 113,438 81,644
36 2,086,663,406 2,083,248,601 2,081,397,235 9441 11,028 7179
37 1,554,206,641 1,554,966,625 1,554,966,625 1187 840 650
38 2,714,570,892 2,618,703,255 2,612,412,931 15,899 8857 4640
39 2,247,971,204 2,248,320,525 2,246,131,484 230,842 95,857 12,216
40 2,277,730,008 2,278,562,498 2,278,562,498 246,853 285,599 70,236
41 1,999,443,356 1,999,443,356 1,995,585,067 175,568 181,155 119,248
42 531,507,860 524,940,891 523,394,518 597,836 314,640 189,345
43 674,870,478 652,360,168 652,360,168 26,560 25,222 13,212
44 489,632,687 490,027,989 487,887,285 130,152 92,299 40,231
45 485,113,122 483,412,665 483,412,665 14,334 47,008 20,675
46 685,963,429 699,786,979 692,172,784 4325 10,338 2918
47 608,117,858 612,169,049 611,923,818 159,238 323,704 196,769
48 557,099,497 580,350,856 580,199,304 37,038 17,506 13,731
49 668,245,439 636,311,587 630,006,170 7876 35,492 13,932
DOI: 10.4236/ajor.2017.75019 277 American Journal of Operations Research
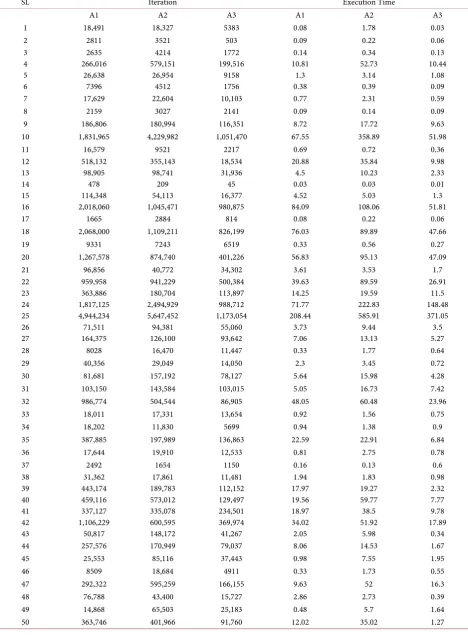
Table 4. Problem for 60 time period (Iteration and execution time).
SL Iteration Execution Time
A1 A2 A3 A1 A2 A3
1 18,491 18,327 5383 0.08 1.78 0.03
2 2811 3521 503 0.09 0.22 0.06
3 2635 4214 1772 0.14 0.34 0.13
4 266,016 579,151 199,516 10.81 52.73 10.44
5 26,638 26,954 9158 1.3 3.14 1.08
6 7396 4512 1756 0.38 0.39 0.09
7 17,629 22,604 10,103 0.77 2.31 0.59
8 2159 3027 2141 0.09 0.14 0.09
9 186,806 180,994 116,351 8.72 17.72 9.63
10 1,831,965 4,229,982 1,051,470 67.55 358.89 51.98
11 16,579 9521 2217 0.69 0.72 0.36
12 518,132 355,143 18,534 20.88 35.84 9.98
13 98,905 98,741 31,936 4.5 10.23 2.33
14 478 209 45 0.03 0.03 0.01
15 114,348 54,113 16,377 4.52 5.03 1.3
16 2,018,060 1,045,471 980,875 84.09 108.06 51.81
17 1665 2884 814 0.08 0.22 0.06
18 2,068,000 1,109,211 826,199 76.03 89.89 47.66
19 9331 7243 6519 0.33 0.56 0.27
20 1,267,578 874,740 401,226 56.83 95.13 47.09
21 96,856 40,772 34,302 3.61 3.53 1.7
22 959,958 941,229 500,384 39.63 89.59 26.91
23 363,886 180,704 113,897 14.25 19.59 11.5
24 1,817,125 2,494,929 988,712 71.77 222.83 148.48
25 4,944,234 5,647,452 1,173,054 208.44 585.91 371.05
26 71,511 94,381 55,060 3.73 9.44 3.5
27 164,375 126,100 93,642 7.06 13.13 5.27
28 8028 16,470 11,447 0.33 1.77 0.64
29 40,356 29,049 14,050 2.3 3.45 0.72
30 81,681 157,192 78,127 5.64 15.98 4.28
31 103,150 143,584 103,015 5.05 16.73 7.42
32 986,774 504,544 86,905 48.05 60.48 23.96
33 18,011 17,331 13,654 0.92 1.56 0.75
34 18,202 11,830 5699 0.94 1.38 0.9
35 387,885 197,989 136,863 22.59 22.91 6.84
36 17,644 19,910 12,533 0.81 2.75 0.78
37 2492 1654 1150 0.16 0.13 0.6
38 31,362 17,861 11,481 1.94 1.83 0.98
39 443,174 189,783 112,152 17.97 19.27 2.32
40 459,116 573,012 129,497 19.56 59.77 7.77
41 337,127 335,078 234,501 18.97 38.5 9.78
42 1,106,229 600,595 369,974 34.02 51.92 17.89
43 50,817 148,172 41,267 2.05 5.98 0.34
44 257,576 170,949 79,037 8.06 14.53 1.67
45 25,553 85,116 37,443 0.98 7.55 1.95
46 8509 18,684 4911 0.33 1.73 0.55
47 292,322 595,259 166,155 9.63 52 16.3
48 76,788 43,400 15,727 2.86 2.73 0.39
49 14,868 65,503 25,183 0.48 5.7 1.64
DOI: 10.4236/ajor.2017.75019 278 American Journal of Operations Research
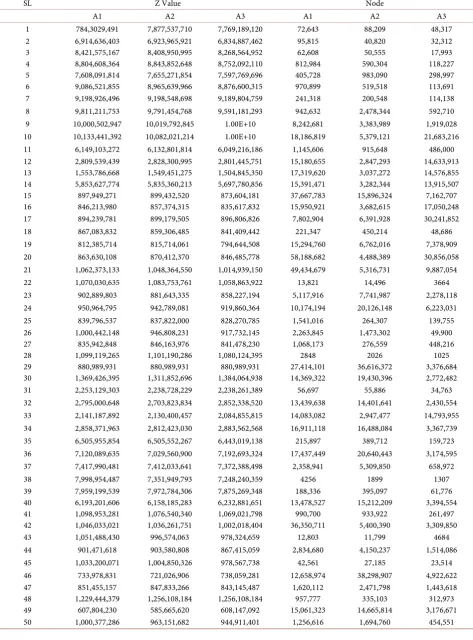
Table 5. Problem for 100 time period (Z value and No. of nodes).
SL Z Value Node
A1 A2 A3 A1 A2 A3
1 784,3029,491 7,877,537,710 7,769,189,120 72,643 88,209 48,317
2 6,914,636,403 6,923,965,921 6,834,887,462 95,815 40,820 32,312
3 8,421,575,167 8,408,950,995 8,268,564,952 62,608 50,555 17,993
4 8,804,608,364 8,843,852,648 8,752,092,110 812,984 590,304 118,227
5 7,608,091,814 7,655,271,854 7,597,769,696 405,728 983,090 298,997
6 9,086,521,855 8,965,639,966 8,876,600,315 970,899 519,518 113,691
7 9,198,926,496 9,198,548,698 9,189,804,759 241,318 200,548 114,138
8 9,811,211,753 9,791,454,768 9,591,181,293 942,632 2,478,344 592,710
9 10,000,502,947 10,019,792,845 1.00E+10 8,242,681 3,383,989 1,919,028
10 10,133,441,392 10,082,021,214 1.00E+10 18,186,819 5,379,121 21,683,216
11 6,149,103,272 6,132,801,814 6,049,216,186 1,145,606 915,648 486,000
12 2,809,539,439 2,828,300,995 2,801,445,751 15,180,655 2,847,293 14,633,913
13 1,553,786,668 1,549,451,275 1,504,845,350 17,319,620 3,037,272 14,576,855
14 5,853,627,774 5,835,360,213 5,697,780,856 15,391,471 3,282,344 13,915,507
15 897,949,271 899,432,520 873,604,181 37,667,783 15,896,324 7,162,707
16 846,213,980 857,374,315 835,617,832 15,950,921 3,682,615 17,050,248
17 894,239,781 899,179,505 896,806,826 7,802,904 6,391,928 30,241,852
18 867,083,832 859,306,485 841,409,442 221,347 450,214 48,686
19 812,385,714 815,714,061 794,644,508 15,294,760 6,762,016 7,378,909
20 863,630,108 870,412,370 846,485,778 58,188,682 4,488,389 30,856,058
21 1,062,373,133 1,048,364,550 1,014,939,150 49,434,679 5,316,731 9,887,054
22 1,070,030,635 1,083,753,761 1,058,863,922 13,821 14,496 3664
23 902,889,803 881,643,335 858,227,194 5,117,916 7,741,987 2,278,118
24 950,964,795 942,789,081 919,860,364 10,174,194 20,126,148 6,223,031
25 839,796,537 837,822,000 828,270,785 1,541,016 264,307 139,755
26 1,000,442,148 946,808,231 917,732,145 2,263,845 1,473,302 49,900
27 835,942,848 846,163,976 841,478,230 1,068,173 276,559 448,216
28 1,099,119,265 1,101,190,286 1,080,124,395 2848 2026 1025
29 880,989,931 880,989,931 880,989,931 27,414,101 36,616,372 3,376,684
30 1,369,426,395 1,311,852,696 1,384,064,938 14,369,322 19,430,396 2,772,482
31 2,253,129,303 2,238,728,229 2,238,261,389 56,697 55,886 34,763
32 2,795,000,648 2,703,823,834 2,852,338,520 13,439,638 14,401,641 2,430,554
33 2,141,187,892 2,130,400,457 2,084,855,815 14,083,082 2,947,477 14,793,955
34 2,858,371,963 2,812,423,030 2,883,562,568 16,911,118 16,488,084 3,367,739
35 6,505,955,854 6,505,552,267 6,443,019,138 215,897 389,712 159,723
36 7,120,089,635 7,029,560,900 7,192,693,324 17,437,449 20,640,443 3,174,595
37 7,417,990,481 7,412,033,641 7,372,388,498 2,358,941 5,309,850 658,972
38 7,998,954,487 7,351,949,793 7,248,240,359 4256 1899 1307
39 7,959,199,539 7,972,784,306 7,875,269,348 188,336 395,097 61,776
40 6,193,201,606 6,158,185,283 6,232,881,651 13,478,527 15,212,209 3,394,554
41 1,098,953,281 1,076,540,340 1,069,021,798 990,700 933,922 261,497
42 1,046,033,021 1,036,261,751 1,002,018,404 36,350,711 5,400,390 3,309,850
43 1,051,488,430 996,574,063 978,324,659 12,803 11,799 4684
44 901,471,618 903,580,808 867,415,059 2,834,680 4,150,237 1,514,086
45 1,033,200,071 1,004,850,326 978,567,738 42,561 27,185 23,514
46 733,978,831 721,026,906 738,059,281 12,658,974 38,298,907 4,922,622
47 851,455,157 847,833,266 843,145,487 1,620,112 2,471,798 1,443,618
48 1,229,444,379 1,256,108,184 1,256,108,184 957,777 335,103 312,973
49 607,804,230 585,665,620 608,147,092 15,061,323 14,665,814 3,176,671
DOI: 10.4236/ajor.2017.75019 279 American Journal of Operations Research
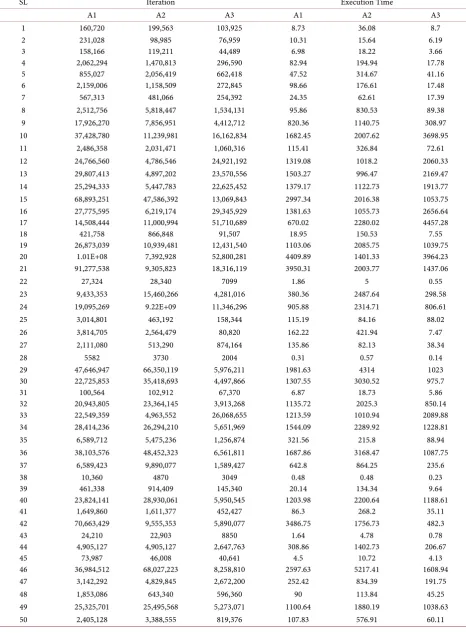
Table 6. Problem for 100 time period (Iteration and execution time).
SL Iteration Execution Time
A1 A2 A3 A1 A2 A3
1 160,720 199,563 103,925 8.73 36.08 8.7
2 231,028 98,985 76,959 10.31 15.64 6.19
3 158,166 119,211 44,489 6.98 18.22 3.66
4 2,062,294 1,470,813 296,590 82.94 194.94 17.78
5 855,027 2,056,419 662,418 47.52 314.67 41.16
6 2,159,006 1,158,509 272,845 98.66 176.61 17.48
7 567,313 481,066 254,392 24.35 62.61 17.39
8 2,512,756 5,818,447 1,534,131 95.86 830.53 89.38
9 17,926,270 7,856,951 4,412,712 820.36 1140.75 308.97
10 37,428,780 11,239,981 16,162,834 1682.45 2007.62 3698.95
11 2,486,358 2,031,471 1,060,316 115.41 326.84 72.61
12 24,766,560 4,786,546 24,921,192 1319.08 1018.2 2060.33
13 29,807,413 4,897,202 23,570,556 1503.27 996.47 2169.47
14 25,294,333 5,447,783 22,625,452 1379.17 1122.73 1913.77
15 68,893,251 47,586,392 13,069,843 2997.34 2016.38 1053.75
16 27,775,595 6,219,174 29,345,929 1381.63 1055.73 2656.64
17 14,508,444 11,000,994 51,710,689 670.02 2280.02 4457.28
18 421,758 866,848 91,507 18.95 150.53 7.55
19 26,873,039 10,939,481 12,431,540 1103.06 2085.75 1039.75
20 1.01E+08 7,392,928 52,800,281 4409.89 1401.33 3964.23
21 91,277,538 9,305,823 18,316,119 3950.31 2003.77 1437.06
22 27,324 28,340 7099 1.86 5 0.55
23 9,433,353 15,460,266 4,281,016 380.36 2487.64 298.58
24 19,095,269 9.22E+09 11,346,296 905.88 2314.71 806.61
25 3,014,801 463,192 158,344 115.19 84.16 88.02
26 3,814,705 2,564,479 80,820 162.22 421.94 7.47
27 2,111,080 513,290 874,164 135.86 82.13 38.34
28 5582 3730 2004 0.31 0.57 0.14
29 47,646,947 66,350,119 5,976,211 1981.63 4314 1023
30 22,725,853 35,418,693 4,497,866 1307.55 3030.52 975.7
31 100,564 102,912 67,370 6.87 18.73 5.86
32 20,943,805 23,364,145 3,913,268 1135.72 2025.3 850.14
33 22,549,359 4,963,552 26,068,655 1213.59 1010.94 2089.88
34 28,414,236 26,294,210 5,651,969 1544.09 2289.92 1228.81
35 6,589,712 5,475,236 1,256,874 321.56 215.8 88.94
36 38,103,576 48,452,323 6,561,811 1687.86 3168.47 1087.75
37 6,589,423 9,890,077 1,589,427 642.8 864.25 235.6
38 10,360 4870 3049 0.48 0.48 0.23
39 461,338 914,409 145,340 20.14 134.34 9.64
40 23,824,141 28,930,061 5,950,545 1203.98 2200.64 1188.61
41 1,649,860 1,611,377 452,427 86.3 268.2 35.11
42 70,663,429 9,555,353 5,890,077 3486.75 1756.73 482.3
43 24,210 22,903 8850 1.64 4.78 0.78
44 4,905,127 4,905,127 2,647,763 308.86 1402.73 206.67
45 73,987 46,008 40,641 4.5 10.72 4.13
46 36,984,512 68,027,223 8,258,810 2597.63 5217.41 1608.94
47 3,142,292 4,829,845 2,672,200 252.42 834.39 191.75
48 1,853,086 643,340 596,360 90 113.84 45.25
49 25,325,701 25,495,568 5,273,071 1100.64 1880.19 1038.63
DOI: 10.4236/ajor.2017.75019 280 American Journal of Operations Research
model A3 by using student version of GAMS available at IIT Kanpur; and find
that our reformulations (model A3 and A2) have superior computational
ad-vantages than model has A1.
3. Preparing Test Problems and Results
We created problem instances with set up, inventory carrying, shortage and
production cost are normally distributed with mean and variance given below:
Fixed cost:
mean 100000 and variance 10000
Shortage cost:
mean 5000 and variance 500
Inventory carrying cost: mean 600 and variance 60
Variable Production cost: mean1500 and variance 100
Demand and capacity were chosen from uniform distribution in the range of
10,000 - 15,000. In the case of infeasible solution, the capacity values are
in-creased or demand values are dein-creased keeping other costs same. We created 50
problem instances each for periods 50, 60 and 100. Models A1, A2 and A3 were
coded in GAMS and were solved in GAMS; and they were run in branch and
bound mode. The GAMS solver returns a satisfactory solution obtainable in
rea-sonable time. It is to be noted that these problems are NP-HARD and will take
few billion centuries to come to optimal solution. Detailed data are given in
ap-pendix see
Tables 1-6
; and consolidated results of “t” test are given in
Tables 7-9
below. Models A1, A2 and A3 are compared on the criteria of execution time,
Table 7. 50 Time period: t values.
A1 A3 A2 A3 A1 A2
Iteration 3.078** 5.179*** −1.406
Execution Time 2.742** 5.78*** 4.81***
No. of Nodes
[image:9.595.205.540.420.489.2]Processed 2.736** 3.833*** −0.207
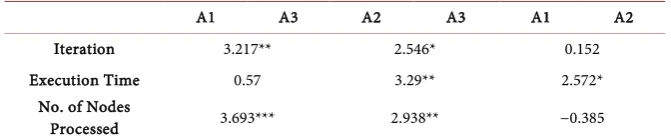
Table 8. 60 Time period: t values.
A1 A3 A2 A3 A1 A2
Iteration 3.217** 2.546* 0.152
Execution Time 0.57 3.29** 2.572*
No. of Nodes
Processed 3.693*** 2.938** −0.385
Table 9. 100 time period: t values.
A1 A3 A2 A3 A1 A2
Iteration 4.147*** 4.409*** −1.942
Execution Time 2.735** 4.596*** 2.776**
No. of Nodes
Produced 3.691*** 4.582*** −0.686
[image:9.595.205.541.522.592.2]DOI: 10.4236/ajor.2017.75019 281 American Journal of Operations Research
number of iterations and number of nodes evaluated in the search tree). On an
average, A3 is superior to A1 and A2 and A2 is superior to A1 on most criteria;
and large positive “t” values in the
Tables 7-9
give adequate support in favor of
A3.
4. Discussion and Conclusion
Thus it can be seen that model A3 has superior results in general (except for the
case of execution time in 60 period problems) (here A3 is better than A1, but not
statistically significant). This shows that the new formulation given by us is
supe-rior to models available in literature. This is the useful contribution we make.
The three reformulations presented in this paper use Equation (5) and this leads
to
1 1
T T
t t
t t
x
D
= =
≥
∑
∑
To get
1 1
T T
t t
t t
x
D
= =
=
∑
∑
, we need to develop good heuristics, and
show that the duality gap is as less as possible. We have already started work on
this, and will come back with results as soon as possible.
References
[1] Pochet, Y. and Wolsey, L.A. (1991) Solving Multi-Item Lot-Sizing Problems Using
Strong Cutting Planes.
Management Science
, 37, 53-67.https://doi.org/10.1287/mnsc.37.1.53
[2] Mayank, V. (2012) Capacitated Lot Sizing with Back Orders in Multilevel
Situa-tions. Ph.D. Thesis, Indian Institute of Technology, Kanpur.
[3] Mayank, E. and Sharma, R.R.K. (2009) Relaxations and Equivalence of Two
For-mulations of the Capacitated Lot Sizing Problem with Back-Orders and Setup
Times.
Proceedings of the Global Conference on Business and Finance
, 4, 42-53.[4] Mayank, V. and Sharma, R.R.K. (2010) A New Lagrangian Relaxation Based
Ap-proach to solve Capacitated Lot-Sizing Problem with Backlogging.
Global Business
and Management Research
, Universal-Publishers, Boca Raton, Vol. 2, 285-295.[5] Mayank, V. and Sharma, R.R.K. (2015) Lagrangian Based Approach to Solve a Two
Level Capacitated Lot Sizing Problem.
Cogent Engineering
, 2, 108861.[6] Miller, A.J., Nemhauser, G.L. and Savelsbergh, M.W.P (2000) On the Capacitated
Lot Sizing and Continuous 0-1 Knapsack Polyhedral.
European Journal of
opera-tional Research
, 125, 298-315. https://doi.org/10.1016/S0377-2217(99)00461-0[7] Kumar, V. (2012) Equal Distribution of Shortages in Supply Chain of Food
Submit or recommend next manuscript to SCIRP and we will provide best
service for you:
Accepting pre-submission inquiries through Email, Facebook, LinkedIn, Twitter, etc. A wide selection of journals (inclusive of 9 subjects, more than 200 journals)
Providing 24-hour high-quality service User-friendly online submission system Fair and swift peer-review system
Efficient typesetting and proofreading procedure
Display of the result of downloads and visits, as well as the number of cited articles Maximum dissemination of your research work