Alan Barrett, Adele Bergin, John FitzGerald,
Derek Lambert, Daire McCoy, Edgar Morgenroth,
Iulia Siedschlag and Zuzanna Studnicka
November
201
5
Implications of Brexit on Ireland
RESEARCH SERIES
Scoping the Possible Economic
Implications of Brexit on Ireland
Alan Barrett, Adele Bergin, John FitzGerald, Derek Lambert,
Daire McCoy, Edgar Morgenroth, Iulia Siedschlag and
Zuzanna Studnicka
RESEARCH SERIES
NUMBER 48
November 2015
Available to download from www.esri.ie.
The Authors
Alan Barrett is Director and Research Professor, Edgar Morgenroth and Iulia Siedschlag are Associate Research Professors and Adele Bergin is Senior Research Officer, at the Economic and Social Research Institute (ESRI) and all also have adjunct positions at the Department of Economics, Trinity College Dublin. Daire McCoy and Zuzanna Studnicka are Post-Doctoral Fellows and Derek Lambert is Research Assistant at the Economic and Social Research Institute. John FitzGerald is Research Affiliate at the ESRI and Adjunct Professor at Trinity College, Dublin.
Acknowledgements
We gratefully acknowledge useful comments and suggestions from Gary Tobin, Niamh Campbell, David Hegarty, Brendan O’Connor, Ronald B. Davies, two anonymous referees and participants at presentations at the Department of Finance. We thank Martina Lawless and Conor O’Toole who together with two of the authors of this study conducted an analysis of the impact of corporation tax rates on location choices of multinational firms (Lawless et al., 2014) for kindly making available their data and software code. The research was conducted under the joint Department of Finance and ESRI Research Programme on The Macro-economy and Taxation.
Table of Contents
LIST OF FIGURES ... iii
LIST OF TABLES ... iv
EXECUTIVE SUMMARY ... v
CHAPTER 1 INTRODUCTION ... 1
CHAPTER 2 TRADE ... 5
2.1 Total Merchandise Trade ... 8
2.2 Total Services Trade ... 10
2.3 Detailed Analysis of Trade Flows: The Role of Sectors, Products, Ownership and Firm Size ... 12
2.3.1 Sectors and Products ... 12
2.3.2 Ownership and Size of Firms ... 21
2.3.3 Value-Added Trade ... 23
2.3.4 Northern Ireland ... 24
2.4 Potential Impacts of Brexit ... 26
CHAPTER 3 BREXIT: FDI-RELATED IMPLICATIONS ... 29
3.1 Current Patterns of Inward FDI in the UK... 30
3.2 Brexit: Possible FDI-related Channels and Implications on the UK’s and Ireland’s Economies ... 32
3.3 Possible Brexit Scenarios ... 34
CHAPTER 4 BRITISH EXIT AND THE ENERGY SECTOR IN IRELAND... 42
4.1 All-Island Electricity Market ... 43
4.2 Irish and UK Electricity Markets ... 44
4.3 Climate Change Policy ... 46
4.4 Energy Security ... 48
4.5 Oil Storage ... 51
4.6 Gas Storage ... 51
CHAPTER 5 MIGRATION/LABOUR MARKET BREXIT AND MIGRATION ... 52
5.1 Flows between Ireland and the UK ... 53
5.3 Quantifying the Impacts ... 57
CHAPTER 6 SUMMARY AND CONCLUSIONS ... 60
APPENDIX 1 THE UK - EU FUTURE RELATIONSHIP: THE LANDSCAPE OF ALTERNATIVES ... 70
List of Figures
FIGURE 2.1 Real Merchandise Exports by Destination, 1973 to 2014 ... 9
FIGURE 2.2 Real Imports by Destination, 1973 to 2014 ... 10
FIGURE 2.3 Real Services Exports by Destination, 2003 to 2013 ... 11
FIGURE 2.4 Real Services Imports by Destination, 2003 to 2013 ... 12
FIGURE 2.5 Export and Import Shares to and from the UK by Sector, 2009 ... 14
FIGURE 2.6 Share of Exports by Industry Destined for the UK, 2009 ... 15
FIGURE 2.7 Top 10 Export Products to the UK, 2014 ... 17
FIGURE 2.8 Top 10 Import Products from the UK, 2014 ... 17
FIGURE 2.9 Services Exports by Type of Service, 2013 ... 19
FIGURE 2.10 Services Imports by Type of Service, 2013 ... 19
FIGURE 2.11 Visitor Numbers to Ireland by Origin. ... 21
FIGURE 2.12 Output Exported by Irish and Foreign Industrial Firms by Destination, 2012 ... 22
FIGURE 2.13 Total Exports, Value-Added Exports and Net Value-Added Exports to the UK by Sector, 2009 ... 24
FIGURE 3.1 Inward FDI Stock in the UK by Sector ... 31
FIGURE 3.2 Regional Distribution of New FDI Projects in the UK, 2013-2014 ... 31
FIGURE 3.3 EU Countries’ Attractiveness to New FDI Projects at 18 per cent Corporate Tax Rate in the UK ... 36
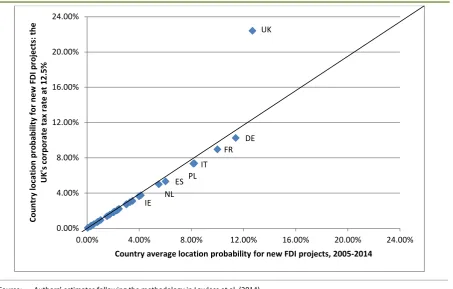
FIGURE 3.4 EU Countries’ Attractiveness to New FDI Projects at 12.5 per cent Corporate Tax Rate in the UK ... 37
FIGURE 3.5 EU Countries’ Attractiveness to New FDI Projects at 18 per cent Corporate Tax Rate in the UK and Reduced EU Market Access by 25 per cent ... 39
FIGURE 3.6 EU Countries’ Attractiveness to New FDI Projects at 18 per cent Corporate Tax Rate in the UK and Reduced EU Market Access by 50 per cent ... 39
FIGURE 3.7 Indicators of FDI Attractiveness: The UK, Ireland, and the Best EU Performer ... 40
FIGURE 4.1 Interconnection Flows as a Percentage of Consumption, 2013 ... 45
FIGURE 5.1 Emigration in Thousands, 1987 to 2014 ... 54
FIGURE 5.2 Immigration in Thousands, 1987 to 2014 ... 54
FIGURE 5.3 Overseas Trips by Irish Residents in Thousands, 2009 to 2014 ... 55
List of Tables
TABLE 3.1 Brexit: Possible FDI-related Implications in the UK and Ireland ... 33
TABLE 5.1 Results of a Simulation in which 60,000 Labour Force Participants are Added to
Ireland’s Labour Force ... 59
TABLE A.1 EU Countries’ Attractiveness to New FDI Projects under Possible Brexit Scenarios ... 72
Executive Summary
With the election success of the Conservative Party in the UK in the recent general election, the new UK government is committed to holding a referendum on EU membership following negotiations between the UK and the EU on key issues of concern to the UK government. While the outcome of these negotiations and the possible referendum are uncertain, a number of scenarios for the future relationship between the UK and the EU can be identified. These include situations in which the UK remains in a reformed EU and situations where it leaves. In the latter case, further sets of possibilities exist which differ in terms of the extent to which current arrangements with respect to free trade, for example, are maintained or dismantled.
A changed relationship between the UK and the EU could potentially have far-reaching consequences for Ireland especially if there were changes in areas such as trade and migration. Given this, the goals of this study are as follows:
• to describe and quantify the key economic linkages which have developed over time between Ireland and the UK in the context of EU membership, and • arising from the above, to make an initial assessment of the risks and
opportunities to these economic linkages in the context of potential future developments at EU-level, in particular a UK exit from the EU.
The following areas are covered in the analysis: trade, foreign direct investment, energy and migration. While the focus of the analysis in the report is within those four areas, a broader macroeconomic view is included. As most analyses suggest that a Brexit will have negative implications for the UK economy, a simulation is included which shows how reduced GDP in the UK leads to reduced demand for Irish exports and hence reduced GDP in Ireland.
The main findings are as follows:
Trade
• While the 20 per cent estimate is an average figure, the impact would differ significantly across sectors and products. For merchandise trade in particular, trade is very concentrated in a few product types, which implies that increased trade barriers for the most important products would have a particularly significant impact on total trade volumes.
• Some sectors such as Chemicals and Pharmaceuticals account for a large share of exports to the UK; however sectors such as Agriculture, Food and Beverages and Basic Metals are relatively more dependent on exports to the UK and so the impacts on them would be more severe.
• Trade between Ireland and Northern Ireland has been declining as a share and the overall volume is below the level expected for two trading partners located on an island. Overall Ireland is more important to Northern Irish exporters than Northern Ireland is for Irish exporters so, again, there would be differing impacts of a Brexit.
Foreign Direct Investment
• The UK outside the EU would be less attractive to FDI because of uncertainty and reduced access to the EU Single Market. Less FDI in the UK would be likely to translate into a lower potential growth in the UK with negative consequences on Ireland’s economic growth.
• It might be thought that this negative effect could be counterbalanced by a positive boost for Ireland through additional FDI projects relocating from the UK. However, on the basis of patterns of the location choice of new FDI projects in Europe over the past ten years, the expected additional attractiveness of Ireland to new FDI projects is likely to be small.
• Corporate tax reforms in the UK are likely to increase the attractiveness of the UK to FDI while the magnitude of their negative impact on Ireland’s attractiveness is expected to be small.
Energy
• The first point that needs to be noted is the fact that an all-island electricity market has existed since 2007. Interconnection between Ireland and Northern Ireland is particularly important for Northern Ireland which relies on electricity imports from Ireland to make up for insufficient local electricity generation capacity.
• If the electricity market in Britain remains independent of the rest of the EU, enhanced interconnection with Britain would leave Ireland vulnerable to any problems in the British market. Under these circumstances enhanced interconnection by Ireland with the rest of the EU, most probably to France, could provide useful diversification, reducing risk for Irish consumers. However, this would require a large infrastructural investment.
• If the UK left the EU, it would no longer be subject to EU rules on climate change policy and renewables. Outside the EU, there would be a lower chance that they would reopen discussions on trade in renewables.
• If the UK left the EU it would no longer be subject to EU regulatory measures to deal with a possible crisis situation in the case of a gas or oil shortage. Ireland would then have to consider how best to provide protection from very unlikely, but potentially catastrophic outcomes.
Migration
• A UK exit from the EU opens up the possibility of restrictions on the free movement of people between Ireland and the UK for the purposes of work. As the UK remains an important destination for Irish emigrants especially at times of high unemployment, such restrictions could have implications for the Irish labour market.
• More broadly, the imposition of passport controls at the border with Northern Ireland would be at best inconvenient and at worst a worryingly regressive step in terms of facilitating cooperation between both parts of the island. This is possibly the strongest reason which can be advanced when arguing in favour of the maintenance of the CTA.
Chapter 1
Introduction
With the election success of the Conservative Party in the UK in the recent general election, the new UK government is committed to holding a referendum on EU membership following negotiations between the UK and the EU on key issues of concern to the UK government. While the outcome of these negotiations and the referendum are uncertain, a number of possible scenarios for the future relationship between the UK and the EU can be identified. These have been outlined in a number of recent publications such as The CityUK (2014), and O’Ceallaigh and Gillespie (2015). The landscape of alternatives includes:
• The UK remains inside the EU:
o The UK remains inside a reformed EU within the existing treaties; o The UK remains inside a reformed EU following Treaty change;
o The UK remains inside the EU and obtains opt-outs in certain policy areas
and/or initiates institutional changes to repatriate competences to all Member States;
o The UK remains inside a more integrated EU by giving up its current
opt-outs.
• The UK leaves the EU:
o Membership of the European Economic Area (EEA) and the European
Free Trade Area (EFTA) – similar to Norway’s relationship with the EU;
o Bilateral agreements with the EU and membership of EFTA – similar to
Switzerland’s model;
o Membership of a Customs Union with the EU – similar to Turkey’s
relationship with the EU;
o Bilateral Free Trade Agreement with the EU;
o No preferential trade agreement with the EU (most favoured nation
tariffs will be applied in line with membership of the World Trade Organisation).
the changes, it is easier to focus on a worst case scenario; an exit of the UK from the EU – Brexit. The best case scenario would involve either the status quo or indeed continued UK membership based on renegotiated terms which benefits all Member States including Ireland.
Recent assessments of the economic consequences for the UK of a Brexit under alternative scenarios indicate that the economic losses are likely to outweigh savings from cancelled annual payments to the EU budget (Ottaviano et al., 2014). Depending on the assumptions underlying the UK’s future relationship outside the EU, Ottaviano et al. (2014) estimate that real GDP losses in the UK would be between 1.1 and 3.1 per cent.1 If additional dynamic effects due to lower
productivity growth are taken into account, the economic loss to the UK would range between 6.3 to 9.5 per cent. The Ifo Institute in Germany (as reported in Bertelsmann Stiftung, 2015) estimates that if the UK exits the EU in 2018, its GDP per capita in 2030 will be lower by 0.6 to 3.0 per cent relative to its GDP per capita inside the EU. The same study finds that among EU countries, Ireland will be hardest hit, with anticipated GDP per capita losses of 0.8 to 2.7 per cent. These estimates are linked to the effects of trade losses while additional effects due to other channels associated with EU membership (higher research and development intensity, integration in European and global value chains) are more difficult to assess. As a consequence, the real resulting total economic losses are likely to be larger.
The trade impact of exiting the EU would be more significant for the UK than individual EU Member States as the UK’s trade with 27 EU Member States would be affected compared to the bilateral impact between the remaining Member States and the UK (Morgenroth, 2015). However, given the significant economic linkages between the UK and Ireland, a reduction in the UK’s GDP will have a negative impact on Ireland. At the aggregate level these demand effects can be quantified using the ESRI’s HERMES model, in which the UK is the main driver of demand in the traditional Manufacturing and Food sectors, thereby capturing the tendency for exports to the UK to come from these sectors, while the more modern sectors export to countries beyond the UK. Model simulations suggest that the effect of a 1 per cent reduction in UK GDP is to reduce Ireland’s GDP and GNP by 0.3 per cent in the medium term. Employment would fall by 0.2 per cent and unemployment would rise by 0.2 per cent. The general government balance
would be 0.1 per cent lower.2 These estimated effects can be scaled in a linear
manner.
These simulations only capture the effect of lower UK GDP growth on Ireland. Given the close economic, cultural and social links between the UK and Ireland, and the fact that some of the key relationships are significantly framed by EU treaties and Directives, any change to the relationship between the UK and the EU is also likely to have a significant impact on the relationship between the UK and Ireland. In this report the key channels through which a changed relationship between the UK and the EU might impact on Ireland are explored. Following the terms of reference for this study, the channels are:
1. Trade (including merchandise and services, with services sub-divided into financial and non-financial services);
2. Foreign Direct Investment flows between Ireland and the UK; 3. Energy;
4. Migration and the labour market.
The goals of this study are: (a) to describe and quantify the key economic linkages which have developed over time between Ireland and the UK in the context of EU membership and (b) arising from the above, to make an initial assessment of the risks and opportunities to these economic linkages in the context of potential future developments at EU level. This is achieved with reference to the existing Irish and international literature and by using existing analytical models where they are available to provide simulation results.
The report is structured as follows. Chapter 2 analyses the trade linkages between the UK and Ireland in the context of the overall patterns of trade, and considers both merchandise and services trade. This encompasses a more detailed analysis of sectors and types of firm as well as the trade links with Northern Ireland. Trade patterns are closely linked to Foreign Direct Investment (FDI) through the location choices and activities of multinational corporations and FDI plays a particularly important role in the Irish economy. Chapter 3 considers the possible impacts of a changed UK relationship with the EU on FDI. Ireland has strong links with the UK and particularly Northern Ireland in relation to energy supply which are analysed in Chapter 4 on energy. There is a long history of migration flows between Ireland and the UK and there are close links between the labour markets of the two countries, which are explored in Chapter 5. Chapter 6 summarises the findings
Chapter 2
Trade
Key Points:
• Both merchandise exports to, and particularly imports from the UK continue to account for a significant share of Irish trade, although that importance has been declining.
• Overall, Ireland has a merchandise trade deficit with the UK.
• The UK is a more important destination for services exports than merchandise exports, but is less important for services imports than merchandise imports.
• The importance of the UK as a trading partner differs significantly across sectors and products. For merchandise trade in particular, trade is very concentrated in a few product types, which implies that increased trade barriers for the most important products would have a particularly significant impact on total trade volumes as these account for a very significant share of exports to the UK.
• While some sectors such as Chemicals and Pharmaceuticals account for a large share of exports to the UK, sectors such as Agriculture, Food and Beverages and Basic Metals are more dependent on exports to the UK.
• Financial services and Business services constitute the most important services exports to and imports from the UK.
• The sectoral trade patterns are significantly driven by FDI, but the UK is a more important export destination for Irish firms.
• Trade between Ireland and Northern Ireland has been declining as a share and the overall volume is below the level expected for two trading partners located on an island. Overall Ireland is more important to Northern Irish exporters than Northern Ireland is for Irish exporters.
• Estimates from the literature suggest that a Brexit is likely to significantly reduce bilateral trade flows between Ireland and the UK. The impact could be 20 per cent or more.
David Ricardo in the eighteenth century, has shown that trade tends to benefit both trading partners. This also implies that a reduction in trade tends to have a negative impact on both partners. While in the past trade was largely concentrated on trade in goods, or what is referred to as merchandise trade, services trade has grown rapidly over recent decades, and in 2013 services exports from Ireland exceeded merchandise exports. Merchandise trade comprises manufactured goods, raw materials, energy, live animals and unprocessed animal carcasses, fish and timber. Services trade is also diverse and covers tourism, computer services, communications, transport, insurance, leasing, merchanting, financial services and other business services. A further component of services trade relates to royalties.
As outlined above, the outcome of the UK referendum on EU membership and the negotiations between the UK and the EU before and after the referendum are uncertain. However a number of possible scenarios would impact significantly on trade flows between the UK and the EU and thus on the bilateral trade flows between the UK and Ireland, while others would have no significant impact on trade. In particular a situation where the UK would leave the EU, with or without a subsequent bilateral trade agreement, is likely to significantly impact on trade, as non-tariff barriers such as customs controls, or technical barriers would be reintroduced and there may also be specific tariffs liable on imports from the UK. In 2013 the average tariff on imports from outside the EU into the EU was 5.2 per cent (WTO, 2014), which while low by international standards contrasts with the zero tariff for trade within the EU.
The EU maintains a range of quotas and/or tariffs with respect to a number of products originating in either all third countries or specific non-EU countries. This relates particularly to agricultural products, food and beverages but also metals such as aluminium, chemicals, electrical and optical equipment, textiles and many other products. Thus, under the more extreme scenarios, imports from the UK would be treated as third-country imports and would therefore automatically be subject to the existing tariff and quota regime of the EU. The UK in turn might introduce tariff or other restrictions in addition to non-tariff barriers such as customs controls. Furthermore, the UK might remove trade barriers from what are now third countries, for example on agricultural and food products,3 which
would impact on Irish exports of such products to the UK by increasing competition and reducing prices.
The impact of tariff and non-tariff barriers has been studied extensively in the international trade literature. This literature has found that, while the pass-through of tariff and non-tariff barriers into prices is not necessarily complete and varies by product (see Feenstra, 1989), there are substantial welfare losses due to trade barriers (e.g. Bradford 2003).
While common technical standards have been found to increase trade, country-specific standards are more likely to reduce trade, with standards having a more negative impact on the Agriculture and Food sectors than other sectors (Li and Beghin, 2012). One of the dimensions of the development of the EU Single Market has been the development of single standards that apply throughout the EU. Brexit would allow the UK to set separate standards that may hinder imports. Border and related costs between the US and Canada where a free trade agreement is in place have been estimated to amount to 2.7 per cent of the value of merchandise trade (see Taylor et al., 2004).
Importantly Free Trade Agreements (FTA) have been found to yield significant benefits in terms of the trade volume, doubling the volume of trade over the ten years following an integration agreement (Baier and Bergstrand, 2007; Bergstrand et al., 2015). Disintegration can therefore be expected to lead to reductions in trade volumes. An interesting study on the trade patterns among former member republics of the Soviet Union that broke up in 1991, the constituent parts of Yugoslavia that broke up in 1990/1991 and Czechoslovakia that split into the Czech Republic and the Slovak Republic in 1993, shows that following their break-up the trade intensities between these declined significantly (Firdrmuc and Fidrmuc, 2003). Nevertheless the intensities were still larger than the expected level in 1998. These results suggest that even though disintegration leads to significant reductions in trade, the disproportionately large levels of trade that are observed among members of an FTA persist for some time, perhaps due to similarities in tastes or familiarity with suppliers and brands. This suggests that the full impact of Brexit on trade flows would arise over a longer time period.
2.1 TOTAL MERCHANDISE TRADE
Ever since independence the UK has been an important trading partner. Figures 2.1 shows real merchandise exports to the UK, the EU excluding the UK, and the US and Canada, over the period 1973 to 2014. The figure shows the significant growth in trade over time. The average annual growth in real exports to EU members other than the UK was 9.8 per cent over the period 1973 to 2014, that for exports to the US and Canada was 10.5 per cent, while exports to the UK have grown by just 4.6 per cent.
Thus, while total merchandise export volumes to the UK have grown, the relative importance of the UK as an export destination has diminished over time. The share of Irish exports destined for the UK reached 56.3 per cent in 1974 but by 2014 the proportion of exports destined for the UK was just over 15 per cent. The UK is now the second largest export destination for Irish merchandise exports, with the US accounting for over 22 per cent of merchandise exports in 2014. Other major destinations of Irish merchandise exports include Belgium (13.2 per cent), Germany (6.6 per cent), Switzerland (5.9 per cent), France (5.2 per cent), Netherlands (3.8 per cent), Spain (2.8 per cent), Italy (2.4 per cent), Japan (2 per cent) and China (1.7 per cent).
Real merchandise imports have also increased significantly over the period 1973 to 2014 (see Figure 2.2). However, the scale of the increase is less than that seen for merchandise exports, as merchandise exports to the EU other than the UK, and to the US and Canada, grew significantly faster than merchandise imports from these regions. While imports to the UK grew by an average of almost 9 per cent per year over the period 1973 to 2014, those to the EU other than the UK and the US and Canada grew by 20 per cent per annum. Thus, while the UK has become less important as an import source this decline has been less marked than the decline as an export destination. The UK continues to be the most important source for merchandise imports and accounted for 32.2 per cent of merchandise imports. Other significant import source countries include the US (10.8 per cent), Germany (7.9 per cent), China (6.3 per cent), Netherlands (4.9 per cent), France (4.7 per cent), Japan (3.3 per cent), Switzerland (2.3 per cent) and Belgium (2.1 per cent).
supplier of intermediate and consumption goods for Ireland, which is important in the context of a possible Brexit.
Any increase in tariff and/or non-tariff barriers would increase the price of imports, although the pass-through need not necessarily be perfect. In the case of a larger market like the UK there is a greater possibility to switch to locally produced goods as a larger country tends to produce a larger variety of goods and services. This implies that the impact of an increase of import prices into the UK is likely to result in reduced export volumes from Ireland. As a small country, Ireland does not produce as big a range of goods as larger countries,4 which limits the
possibility of substituting local goods for foreign ones. Furthermore strong supply chain linkages with the UK, particularly in relation to consumer goods, similar tastes and familiarity with brands, would reduce the likelihood of switching to goods produced in other EU countries at least in the short term. Thus, the impact would be to raise prices in Ireland.
FIGURE 2.1 Real Merchandise Exports by Destination, 1973 to 2014
Source: CSO Trade Statistics.
FIGURE 2.2 Real Imports by Destination, 1973 to 2014
Source: CSO Trade Statistics.
2.2 TOTAL SERVICES TRADE
The available data series for services trade is more limited so that the long-term trends cannot be easily identified. Overall real services exports have grown significantly since 2003, but this growth has been largely confined to exports to the EU other than the UK and to the Rest of the World (see Figure 2.3). Real services exports to the UK grew on average by just 3.4 per cent per year, while those to the rest of the EU grew by 10.7 per cent and those to the Rest of the World grew by 16.3 per cent per annum.
Nevertheless, the UK accounts for a greater share of services exports than of merchandise exports with 17.8 per cent of services exports destined for that market. The rest of the EU also accounts for a slightly larger share of services exports than merchandise exports suggesting that geographic or cultural proximity are more important for services trade than merchandise trade. In addition to the UK the most important single services export destinations include Germany (9.8 per cent), US (9.4 per cent), Italy (6.3 per cent), France (5.4 per cent), Netherlands (3.8 per cent), Switzerland (2.9 per cent), Spain (2.8 per cent), Japan (2.7 per cent) and China (2.6 per cent).
is just the third largest source of total services imports. The most important source countries for services imports include US (24.1 per cent), Netherlands (16.0 per cent), UK (10.6 per cent), Luxembourg (8.0 per cent), Bermuda (4.6 per cent), Germany (2.9 per cent), France (2.5 per cent), Italy (2.5 per cent), Switzerland (2.3 per cent), and Spain (1.9 per cent). As will be shown below, the geography of services imports is strongly influenced by particular types of services imports and in particular the royalties and licences which are counted as services trade. Overall Ireland has a significant services trade surplus with the UK, the rest of the EU and the Rest of the World but a services trade deficit with the US.
FIGURE 2.3 Real Services Exports by Destination, 2003 to 2013
FIGURE 2.4 Real Services Imports by Destination, 2003 to 2013
Source: CSO Balance of Payments Statistics.
2.3 DETAILED ANALYSIS OF TRADE FLOWS: THE ROLE OF SECTORS, PRODUCTS, OWNERSHIP AND FIRM SIZE
The size and trend of merchandise and services trade flows is likely to be significantly shaped by the sectors or products that are traded, and the type of firm that engages in trading activity. For example transport costs vary significantly across products and this will shape the geography of merchandise trade. Indigenous enterprises may have different trade patterns than foreign-owned enterprises. These aspects are further analysed below.
2.3.1 Sectors and Products
and they also found significant technical barriers and high transport costs for low value-to-weight industries.
Figure 2.5 below shows total trade with the UK (merchandise and services) broken down by broad sectors. This shows the significant differences across sectors. For exports to the UK the top four sectors, Food and Beverages (26.4 per cent), Chemicals, Pharmaceuticals and Non-Metallic Minerals (24.8 per cent), Financial Intermediation (11.9 per cent) and Business Services (10.2 per cent) together accounted for 73.3 per cent of total exports to the UK. The top four sectors for imports from the UK, Other Business Services (16.5 per cent), Financial Intermediation (15.7 per cent), Chemicals, Pharmaceuticals and Non-Metallic Minerals (13.4 per cent) and Wholesale, Retail, Hotels and Restaurants (9.3 per cent) together account for 54.9 per cent of total imports from the UK. This shows that exports are concentrated in a few sectors while imports are more evenly distributed.
Figure 2.5 considers the share of total exports that is destined for the UK. It thus does not take into account the relative size of the sectors and the importance of the UK for specific sectors. This is shown in Figure 2.6 which shows the share of exports of each sector accounted for by the UK. This shows clearly that the UK is a particularly important destination for the Basic and Fabricated Metals, Agriculture, Forestry and Fishing, Food and Beverages and the Textiles and Textile products sectors where exports to the UK account for over 30 per cent of total exports from that sector.
The particular concentration of merchandise trade in particular sectors might also result in regionally differentiated impacts of Brexit. Using a special tabulation from the CSO Census 2011 Travel to Work data (POWSCAR), it is possible to identify the geographic distribution of jobs by county.5 This shows that for
Agriculture, Forestry and Fishing employment is disproportionately large in counties Kilkenny, Laois, Tipperary, Waterford county, Roscommon, Cavan and Monaghan. The Food and Beverages sector is particularly important in counties Kilkenny, Longford, Cavan and Monaghan.6 Textiles are important in Wicklow and
Donegal. The Basic and Fabricated Metal Products sector is disproportionately represented in counties Offaly, Limerick county, Waterford county and Monaghan. Finally the Chemicals and Pharmaceuticals sector is more important in
5 See Morgenroth (2008/2009) for an outline of the methodology and a detailed analysis of the economic geography of Ireland in 2006.
South Dublin, Wicklow, Cork, Waterford and Roscommon. Thus, for Waterford county and Monaghan three important sectors would be particularly vulnerable while for Kilkenny, Roscommon, Cavan and Wicklow two important sectors might be particularly vulnerable to Brexit.
FIGURE 2.5 Export and Import Shares to and from the UK by Sector, 2009
FIGURE 2.6 Share of Exports by Industry Destined for the UK, 2009
Source: OECD-WTO: Statistics on Trade in Value Added.
It is possible to analyse the composition of merchandise trade in more detail as the trade flows for individual product types are available.7 In 2014 Ireland
exported products in 3,217 product categories to the UK and imported products in 4,527 categories from the UK. The 10 most important product types out of this large list of traded products account for 30.9 per cent of exports and 31 per cent of imports (see Figures 2.7 and 2.8). The top 50 products accounted for 58.3 per cent and the top 100 products accounted for 70.4 per cent of total merchandise exports in 2014 indicating the very heavy concentration of exports to the UK in a limited number of narrow product categories. While this may appear as extremely concentrated, the data show that exports to the UK are less concentrated in specific products than total exports to all countries, where the top 10 products accounted for 45.7 per cent and the top 50 products accounted for 73.6 per cent
of total merchandise exports in 2014. In contrast, total imports from all sources are less concentrated in particular products than imports from the UK with 24.3 per cent accounted for by the top 10 products and 45.5 per cent accounted for by the top 50 products.
In relation to exports, Packaged Medicines accounted for 8.8 per cent of total merchandise exports to the UK. This constitutes 8.5 per cent of the Packaged Medicines exports from Ireland which in total accounted for 15.2 per cent of all Irish merchandise exports in 2014. A number of other important products also originated from the Chemicals and Pharmaceuticals sector and together these account for 12.6 per cent of merchandise exports to the UK. Aromas for Food and Drink, Beef, Cheese and Chicken Preparations account for 12 per cent of exports. Importantly, while Boneless Beef exports to the UK accounted for just 3.9 per cent of total exports to the UK, this constitutes 43.9 per cent of Chilled Boneless Beef exports from Ireland. Similarly while Other Cheese accounts for 2.7 per cent of exports to the UK, this represents 58.1 per cent of all exports of that product. Overall, the UK is a particularly important export destination for food products and in many products the share of exports accounted for by the UK is in excess of 50 per cent and as high as 100 per cent. For imports the key product group relates to energy imports which together account for 24 per cent of imports from the UK. Particularly noteworthy is the fact that with respect to gas imports 100 per cent are sourced from the UK. The remainder of the more important import products is quite heterogeneous.
The implication of the concentrated nature of Irish exports to the UK is that narrowly applied trade barriers on the products/sectors where Irish exports are concentrated could have very significant implications. The UK market is particularly important for some sectors such as Agriculture, Food and Textiles, which have been found to benefit particularly from free trade through EU memberships (see Nahuis, 2004), which suggests that these may be particularly exposed to the negative impacts of Brexit.
FIGURE 2.7 Top 10 Export Products to the UK, 2014
Source: UN COMTRADE database.
FIGURE 2.8 Top 10 Import Products from the UK, 2014
Services trade can also be disaggregated into different types of service. Unfortunately detailed data for some subsectors are not available for all major trading partners. Figures 2.9 and 2.10 show services exports and imports for those services for which data are available for all trading partners. This shows that for transport services the UK is the most important export destination. Indeed, over 57 per cent of transport services exports go to the UK. Travel and Tourism account for a relatively small proportion of total services exports. For Insurance services the UK is an important destination (23.2 per cent) and the UK is almost as important an export destination for Financial services (27.5 per cent) as the remainder of the EU and the Rest of the World. This highlights the significance of the UK and in particular the City of London in the global financial system, along with the linkages between the financial institutions based in Ireland and the City of London. Business services exports including operational leasing constitute the most important group of services exports and they are destined significantly for the EU other than the UK, and for the Rest of the World. Computer services which are not shown in the graph, as data for the US are not available, account for over 42 per cent of services exports overall and 31.3 per cent of exports to the UK.
A significant proportion of services imports are royalties and licences which account for 38.8 per cent of total services imports. However these are largely from other EU countries (principally Luxembourg). The other major component of services imports relates to other business services which account for 39.7 per cent of total services imports. Travel and Tourism, Insurance and Financial services account for roughly similar proportions of services imports, and for each of these the UK is an important import source although in the case of Travel and Tourism and Insurance the rest of the EU is the most important source of imports, and in the case of financial services the US is the most important source of imports. The UK is also the most important supplier of transport services (32.6 per cent) to Ireland but these account only for a very small share of services imports (just 1.8 per cent).
FIGURE 2.9 Services Exports by Type of Service, 2013
Source: CSO International Trade in Services.
FIGURE 2.10 Services Imports by Type of Service, 2013
Tourism does not rank among the most significant services exports from Ireland but is important both in terms of regional impacts and since this sector employs a greater share of lower skilled workers than for example Financial Services. For example in 2013, 62.5 per cent of visitors travelled to counties outside of Dublin.
Figure 2.11 shows that Great Britain is the single most important origin of visitors to Ireland, accounting for almost 42 per cent of all visitors in 2014. However, that share had been as high as 63.5 per cent in 1983. Nevertheless, for counties such as Carlow, Cavan, Kildare, Leitrim, Longford, Monaghan, Tipperary N.R. and Wexford visitors from Great Britain accounted for more than half the total number of visitors. In addition to the visitors to Ireland from Great Britain, data from InterTradeIreland suggest that an additional 1,574,000 visitors travelled to Ireland from Northern Ireland in 2013.
The absolute numbers of visitors together with their length of stay and expenditure determine the ultimate economic impact. The average length of stay of visitors has been decreasing over time and visitors from Great Britain stay for a shorter period than visitors from the rest of Europe, North America and the Rest of the World. While visitors from Great Britain traditionally spent less per day than other visitors, their expenditure has been higher than that for visitors from the rest of Europe. Taking all factors together, tourism revenue from British visitors to Ireland amounts to €847 million (26 per cent) compared to €1,234 million (37.8 per cent) from visitors from the rest of Europe and €822 million (25.2 per cent) from visitors from North America in 2013.
Assessing the degree to which tourist flows would be impacted by Brexit is not easy, as the impact of EU membership on tourism does not appear to have been estimated. However, research has shown that the introduction of the Euro increased the volume of tourism in Euro Zone countries (see Gil-Pareja et.al. 2007), which suggests that EU integration also had a positive impact on tourist numbers, by facilitating free movement of people within the EU without a need for visas. This might suggest that Brexit could impact negatively on tourist numbers from the UK in the unlikely event that any impediments to travel were introduced.8 However, reduced visitor numbers might arise through reduced
business travel due to lower trade intensities as a causal relationship between the volume of trade and business travel has been found in the literature (see Kulendran and Wilson, 2000 or Park and Jang, 2014). Just over 20 per cent of British visitors to Ireland travel for business purposes and over 40 per cent travel
to visit friends and family which is unlikely to be affected by Brexit. Thus, overall it is possible that Brexit would not lead to a significant decline tourist numbers from the UK.
FIGURE 2.11 Visitor Numbers to Ireland by Origin.
Source: CSO Tourism and Travel Statistics.
2.3.2 Ownership and Size of Firms
The sectoral analysis revealed significant heterogeneity with respect to the importance of the UK as an export destination and source of imports. These patterns are strongly related to the significance of multinational firms in individual sectors. The literature has identified significant heterogeneity across firms with respect to their trade participation probability (Melitz, 2003, Melitz and Redding, 2014). In particular this literature also shows that larger and more productive firms are more likely to export. The effect of this is to increase overall productivity within a sector since the more productive firms push out the less productive firms as the former make use of the benefits of a larger market. Increasing trade costs have been shown to increase productivity in lagging firms but reduce productivity in more efficient firms with the overall effect being to reduce productivity (Konings and Vandenbussche, 2008). Here only the trade patterns of firms of different ownership and firm size are considered as the data for this are readily
available. Further research using micro-data would be required to provide a more complete analysis of the potential impact of Brexit at the firm level in Ireland.
A number of interesting findings emerge from an analysis of the published data on trade by industrial (manufacturing) firms broken down by country or region of ownership (see Figure 2.12). Indigenous firms export less (just 52.9 per cent) than foreign-owned firms (94.4 per cent) but they export a greater proportion to the UK (43.5 per cent) than owned firms (10.6 per cent). Among foreign-owned firms, those foreign-owned by a corporation outside the EU export almost all of their output but a relatively small share of this is destined for the UK. Overall, foreign-owned firms account for the majority of industrial exports to the UK but Irish firms are considerably more dependent on the UK as an export market. This is likely to be due to the fact that the fixed costs associated with exporting to the UK are lower, due to a shared language, legal system and culture, making it easier for smaller indigenous firms to trade with the UK. In contrast multinational firms tend to trade extensively with other plants of the same company located in other countries and also tend to serve larger international markets. Thus the pattern of trade for multinational firms is significantly determined by the location of other plants owned by the same corporation and particularly the location of the headquarters. This explains the significant proportion of exports to the UK and the rest of the EU.
FIGURE 2.12 Output Exported by Irish and Foreign Industrial Firms by Destination, 2012
Considering industrial firms by size of firm reveals a slightly surprising picture in that the smallest firms (less than 20 employees), both Irish and foreign owned, tend to export substantially more to the rest of Europe than the UK when compared to medium sized firms (between 20 and 49 employees) which are significantly dependent on the UK as an export market. For Irish firms with less than 20 employees, 43.7 per cent of exports are destined for the rest of the EU, while 25.2 per cent are exported to the UK, compared to 27.9 per cent and 47.3 per cent for Irish firms with between 20 and 49 employees. For small foreign firms the respective shares are 82.2 per cent and 8.5 per cent and for medium sized firms 49.0 per cent and 20.2 per cent. For Irish firms with more than 50 employees 43.5 per cent of exports are destined for the UK and 37.5 per cent go to the rest of the EU. For foreign firms the respective shares are 10.6 per cent and 40.7 per cent.
2.3.3 Value-Added Trade
The production of exports often requires the use of imported intermediate goods and services. Thus the - that is produced in one country and exported to another is typically less than the total value of the export flow. This is particularly important in countries and sectors which have a significant presence of multinational firms since these tend to have internationally fragmented production structures where intermediates are sourced from other plants of the same company located abroad.
Figure 2.13 shows the total exports to the UK by sector, the value added created in Ireland that is exported, and the net position where the value added imported from the UK is subtracted from the value of exports to the UK. The difference between gross exports and net exports thus highlights the importance of the UK as a destination for exports as well as the importance of imports from the UK in the sector. For sectors where the net exports are lower than the value-added exports, value-added imports from the UK are particularly significant, which is important as potential effects of Brexit would have an impact not just on the export side but also in terms of intermediate imports.
There are also differences across sectors with the lowest Irish value-added share of exports being recorded in Transport Equipment, where just 35 per cent of exports are Irish value added while the domestic value-added share is highest in the Basic and Fabricated Metals sector with 73.5 per cent of exports being Irish value added. These sectoral differences are reflected in the graph by the gap between the gross exports and the value-added exports.
Overall the graph shows that the Irish value added exported is considerably smaller than the value of gross exports. Thus, the impact of any export reduction on Ireland will be less than implied by the total flows. There are some sectors where imports from the UK are particularly important, which implies that there will also be an import effect of an imposition of any trade barriers. These sectors include Chemicals and Pharmaceuticals, Electrical and Optical Equipment, Transport Equipment, and Financial services.
FIGURE 2.13 Total Exports, Value-Added Exports and Net Value-Added Exports to the UK by Sector, 2009
Source: OECD-WTO: Statistics on Trade in Value Added.
2.3.4 Northern Ireland
Assessing the trade relationship between Ireland and Northern Ireland is not straightforward as there are significant data discrepancies with respect to
-1,000 2,000 3,000 4,000 5,000 6,000 7,000 Ag ri cul tur e, F or es tr y, F ishi ng Food , B ev er ag es , T ob ac co Te xti le s, L ea th er , F oo tw ea r W oo d, P ape r, P rint ing , P ub lis hi ng Ch em ic al s, N on -m et al lic M in er al … Ba si c a nd F abr ic at ed M et al P ro duc ts M ac hi ne ry a nd E qui pm en t, ne c El ec tr ic al a nd O pt ic al E qui pm en t Tr ans po rt e qui pm ent W ho le sal e, R et ai l, H ot el s, R es tau ran ts Tr an sp or t, S tor ag e, P os
t, T
el ec om s Fi na nc ia l i nt er m edi at io n Bu si ne ss se rv ic es O th er S er vi ce s U S$ M illio n Gross Exports Net Exports
merchandise trade (Anyadike-Danes and Morgenroth, 2003; Love et al., 2009) and no data on bilateral services trade between Ireland and Northern Ireland exist. Nevertheless a number of important features of the trade relationship between the two parts of Ireland can be identified.
While in 1974, 47 per cent of Irish merchandise exports were destined for Great Britain and 9.3 per cent destined for Northern Ireland, this share has declined to 13.3 per cent and 1.8 per cent respectively. The share of exports going to Northern Ireland declined more over the 1973 to 2014 period than that going to the UK, and there is little evidence of any increase in the Northern Ireland share since the Good Friday Agreement.
Likewise the share of imports into Ireland from Northern Ireland peaked in 1981, accounting for 5.1 per cent but has declined to just 1.8 per cent by 2014, while that from Great Britain peaked in 1980 (46.7 per cent) and declined to 30.5 per cent in 2014. Statistics on the sales destination of the Northern Ireland Manufacturing sector for the 2013/2014 financial year show that the Republic of Ireland accounted for over 25 per cent of sales (exports) by firms in Northern Ireland outside the UK (see NISRA, 2014).
Overall Northern Ireland has a merchandise trade deficit with Ireland, which contrasts with the significant merchandise trade surplus of the UK with respect to Ireland. However, separate analysis on business links between firms from Ireland and Northern Ireland has shown that Northern Irish firms are more dependent on the Irish market than firms from the Republic of Ireland are on the Northern Irish market (InterTradeIreland, 2007). This suggests that Northern Irish firms are more exposed to the impact by any trade barriers that might emerge if the UK left the EU than those from Ireland.
The only data source for services trade between Ireland and Northern Ireland is a study by the Northern Ireland Statistics and Research Agency (NISRA 2013). It focuses on the services sectors with export potential and firms that employ more than 10 persons in Northern Ireland. These data show that Ireland is a very important destination for services exports from Northern Ireland, accounting for between 37.9 per cent and 29 per cent of services exports from Northern Ireland. While no data are available to assess the importance of Northern Ireland as a services export destination, with services exports from Ireland to the whole UK accounting for 17.8 per cent of total Irish services exports, Northern Ireland is not as important a services export destination for Irish services exports as Ireland is for Northern Irish services exports.
2.4 POTENTIAL IMPACTS OF BREXIT
The preceding sections have outlined in detail the trade relationship between Ireland and the UK. This showed that regarding merchandise trade that both exports to and particularly imports from the UK continue to account for a significant share of Irish trade, although that importance has been declining. The more detailed analysis showed that the importance of the UK as a trading partner differs significantly across sectors and products and that these patterns are also significantly driven by FDI. Irish firms are more dependent on the UK as an export market. Financial services and Business services constitute the most important services exports to and imports from the UK.
The impact of Brexit on trade depends on the ultimate position that is reached. If this only encompasses minor impacts on trade barriers then the impact will be very limited. However, in a worst case scenario the UK would be outside the EU, which is likely to be associated with a significant increase in trade barriers. Trade barriers can impact on prices and/or quantities. Furthermore, in the extreme example the UK may negotiate trade agreements with non-EU countries, particularly for certain sectors such as Agriculture and Food. This would result in additional competition in the UK market, which is likely to put Irish exporters under pressure (Mathews, 2015). Of course UK exports to the EU will also be affected and this may lead to opportunities for Irish exporters to capture some of this market share within the EU.
likely to be more challenging for smaller Irish firms. Similarly for imports trade barriers will impact on import prices, and sourcing imports from other markets may be difficult at least in the short-run especially given the deep supply chain linkages between the UK and Ireland, including the significant role of UK retailers in the Irish market.9 Given the fact that the share of imports from the UK is double
the export share, the exposure on the import side could be more significant than that on exports.
In order to assess the magnitude of the potential impacts the results from the literature on the impact of membership of the EU and other trade agreements can be utilised. This approach was used in Morgenroth (2015) who used estimates from a study by Hufbauer and Schott (2009) to assess the impact on aggregate trade flows between Ireland and the UK. Hufbauer and Schott (2009) estimate the impact of a range of different trade agreements, including EU membership, EFTA membership and a bilateral trade agreement with the EU, using a gravity model estimated with a large cross country dataset covering bilateral trade flows over the period 1976 to 2005. Their results indicate that bilateral trade between the UK and EU countries would be reduced by 21.6 per cent in the event of a Brexit where the EU and the UK would negotiate a bilateral trade agreement. Baier and Bergstrand (2007) found that a free trade agreement between two countries increases the bilateral trade between the two countries by 100 per cent in 10 years, and in their subsequent research they estimated the effect of creating the EEC was an increase in trade among the founding members by 8 per cent per annum in the period up to 1970 (Baier and Bergstrand, 2009). Another estimate by Eicher and Henn (2011) suggests that joining the EU increases trade by 37 per cent.10
While most studies consider the impact of joining a customs union or the signing of a trade agreement, one study analysed the impact of the disintegration of trade blocks including the Soviet Union, Yugoslavia and Czechoslovakia (Fidrmuc and Fidrmuc, 2003). This analysis showed that trade within the three countries was up to 43 times greater than that with third countries i.e. a strong home country bias. While this home bias diminished following disintegration it did persist such that trade between the constituent parts was still between double and thirty times more than expected. This result implies that while trade volumes would decline following Brexit, the strong trade relationship between Ireland and the UK is likely to persist for some time.
9 The literature has shown that exchange rate changes are passed through to more significantly in markets where the supplier has a higher market share (Feenstra et al., 1996). It is therefore likely that price increases due to other factors such as tariff or non-tariff barriers are also passed through more completely.
Given the fact that some sectors are more dependent on the UK as a market it is also important to consider the sectoral impact of EU membership. The EU internal market has been found to be particularly trade enhancing for agricultural products, textiles, trade service and transport equipment (Nahuis, 2004).
Overall, the results from the literature suggest that the impacts of Brexit on trade are likely to be substantial. A 21.6 per cent reduction in merchandise exports to the UK as suggested by the results of Hufbauer and Schott (2009) when applied to merchandise exports from Ireland to the UK would amount to a 3.3 per cent drop in total merchandise exports from Ireland. The more detailed description of the trade linkages between Ireland the UK suggest that the incidence of this impact will vary across sectors and is likely to be more substantial for Irish firms as these are more dependent on the UK market. Given the importance of imports from the UK, which may be more difficult to source from other EU Members at least in the short term is likely to put upward pressure on prices in Ireland.
Chapter 3
Brexit: FDI-related Implications
Key Points:
• The UK is a leading destination for FDI. Its inward FDI stock is the largest in Europe and the second largest in the world after the US.
• EU membership has played a key role in attracting FDI to the UK from inside as well as from outside the EU.
• The UK’s inward FDI stock is a source of technology diffusion and productivity growth that is likely to be beneficial to Ireland also via trade and investment linkages with the UK.
• Further EU integration, as well as additional trade and investment if the Transatlantic Trade and Investment Partnership (TTIP) is successfully negotiated, are likely to have positive effects on the UK’s and Ireland’s economies.
• The UK outside the EU would be less attractive to FDI because of uncertainty and reduced EU market access. Less FDI is likely to translate into lower productivity growth and a lower potential growth in the UK with negative consequences on Ireland’s economic growth.
• Ireland may attract additional FDI projects including some relocation of FDI from the UK. However, on the basis of patterns of the location choice of new FDI projects in Europe over the past ten years, the expected additional attractiveness of Ireland to new FDI projects is likely to be small.
• Corporate tax reforms in the UK are likely to increase the attractiveness of the UK to FDI while the magnitude of their negative impact on Ireland’s attractiveness is expected to be small.
• Relative to Ireland, the UK has a number of attractiveness advantages due to a larger market size and better performance with respect to financial market development, technological and innovation capacity, macroeconomic environment, and labour market efficiency. Ireland’s advantage relative to the UK’s attractiveness to FDI is its more competitive corporate taxation.
considers implications of a more competitive corporate tax rate in the UK and of reductions in the UK’s access to the EU Single Market. Finally, on the basis of these findings, this chapter identifies FDI-related issues to be further analysed in the context of Brexit.
3.1 CURRENT PATTERNS OF INWARD FDI IN THE UK
Before examining possible FDI-related implications of Brexit on Ireland’s economy, it is useful to look at current patterns of inward FDI in the UK and their link to the UK’s EU membership.
The UK is a leading location for FDI. The UK’s inward FDI stock is the largest in Europe and the second in the world after the US. In 2014, the inward FDI stock in the UK amounted to $1,662.9 billion (UNCTAD, 2015). Existing evidence indicates that EU membership has been a key factor in attracting FDI to the UK from outside as well as from inside the EU (Barrell and Pain, 1997). As documented in the World Investment Report 2015, other EU countries account for 50 per cent of the UK’s inward FDI stock. Major holders of the UK’s FDI stock from the EU are: the Netherlands (15 per cent), France (8 per cent), and Germany (7 per cent). Ireland’s share in the UK’s inward FDI stock is 1.5 per cent. The US is the largest investing country in the UK, holding 29 per cent of the UK’s FDI stock.
FIGURE 3.1 Inward FDI Stock in the UK by Sector
Source: Office for National Statistics (ONS), 2014. Estimates as end of 2012.
The geographical distribution of the inward FDI stock inside the UK is also highly concentrated, England being by far the leading destination. As shown in Figure 3.2, in 2013-2014, England attracted 85 per cent of all new FDI projects of which 44 per cent went to London. Over the same period, Scotland attracted 7 per cent while Wales accounted for 5 per cent and Northern Ireland for 3 per cent of all new FDI projects located in the UK.
FIGURE 3.2 Regional Distribution of New FDI Projects in the UK, 2013-2014
Source: UK Trade and Investment, Inward Investment Report 2013/14.
45%
9% 8%
6% 6% 4%
4% 3%
15% Financial services
Mining and quarrying
ICT
Oil, pharmaceuticals and chemicals
Utilities
Food and drink
Professional services
Metals and machinery
Other
656
840 122
79 50
0 200 400 600 800 1000
London England (without London)
Further integration of EU markets, particularly in services, is likely to continue to have a positive effect on FDI and productivity growth in the UK. Ireland’s output growth is likely to benefit from these positive effects of FDI via increased demand for trade with the UK.
The UK and Ireland would also benefit from additional liberalisation of trade and investment with the US if a successful conclusion of the Transatlantic Trade and Investment Partnership (TTIP) is reached. A recent study (CEPR 2013) has estimated that the implementation of the TTIP would increase the UK’s GDP by 0.14-0.35 per cent annually over a ten-year period compared to a baseline scenario without an agreement.11 The largest gains would come from the
lowering of the non-trade barriers (NTBs) for trade in goods. In manufacturing, the highest output increase would be in motor vehicles (2.7-7.3 per cent). In the services sector, Financial Services, Insurance, and Business Services would benefit most, with anticipated output increases of 0.6-1.14 per cent, 0.4-0.7 per cent and 0.1-0.2 per cent, respectively. The UK’s aggregate exports to all countries would increase by 1.2-2.9 per cent while imports would increase by 1.0-2.5 per cent. A similar study for the impact of the TTIP on Ireland12 estimated that the gains from
a potential TTIP would increase Ireland’s GDP by 1.1 per cent. Ireland’s exports would increase by 3.8 per cent and its investment by 1.5 per cent. Export expansion linked to the TTIP is expected to generate 5,000 -10,000 additional jobs in Ireland.
3.2 BREXIT: POSSIBLE FDI-RELATED CHANNELS AND IMPLICATIONS ON THE UK’S AND IRELAND’S ECONOMIES
Existing empirical evidence indicates that multinational enterprises are more productive than domestic enterprises (Griffith and Simpson 2001; Helpman et al., 2004; Girma and Görg 2007; Temouri et al., 2008). It has also been documented that FDI is an important channel for advanced technology transfer which contributes to substantial productivity gains and long-term economic growth (Borensztein et al., 1998; Branstetter 2001; Javorcik 2004; Lee 2006; Haskel et al., 2007; Keller and Yeaple 2009). Depending on their motivation, FDI could substitute trade (‘market-seeking’ or ‘horizontal’ FDI) or complement trade (‘efficiency-seeking’ or ‘vertical’ FDI). Recent evidence highlights that multinational enterprises are major drivers of the emergence of global value chains which enable countries to benefit from their comparative advantages and
11 The expected gains from the TTIP for the EU are estimated to be larger, between 0.4 and 0.8 per cent of the EU’s GDP. This result is linked to the higher removable trade and investment barriers between the EU and US.
associated productivity gains (OECD 2013). In the context of European integration, FDI in EU countries, including the UK and Ireland, has been linked to exporting to other European countries (‘export-platform’ FDI).
Given the important role FDI has on economic growth and its linkages to trade, one important question to examine is how Brexit would impact on the UK’s attractiveness to FDI and what the associated implications would be on the UK’s and Ireland’s economies. On the basis of existing relevant evidence (see for example, Ottaviano et al., 2014), Table 3.1 summarises FDI-related channels and potential implications on the UK’s and Ireland’s economies in the case of Brexit.
TABLE 3.1 Brexit: Possible FDI-related Implications in the UK and Ireland
FDI-related effects in the UK Anticipated impact on the
UK’s economy Anticipated impact on Ireland’s economy
Less attractiveness to FDI projects due to uncertainty and reduced EU market access
Lower productivity growth Lower potential growth Lower demand for imports of goods and services Lower export activity
Lower trade and investment activity with the UK
Lower output and employment growth Location/relocation of FDI to Ireland in manufacturing and financial services Less integration in European
and global value chains (trade – FDI
complementarities)
Lower trade activity Lower productivity and economic growth
Lower trade and investment activity with the UK
Lower output and employment growth Location/relocation of FDI to Ireland to replace UK in global production chains Increased attractiveness to
FDI following reforms of the corporate taxation system or trade – FDI substitution
Higher productivity
growth Higher trade and investment activity with the UK Less FDI projects located in Ireland
The UK outside the EU would be less attractive to vertical FDI due to uncertainty and loss of access to the EU Single Market. In particular this would affect new investments in industries with large and irreversible fixed costs (i.e. heavy manufacturing). This loss of FDI would affect negatively the UK’s productivity growth as well as its long-term potential growth. Lower potential growth in the UK is likely to affect negatively economic growth in Ireland via less demand for imports from Ireland.
As discussed above, following the implementation of the TTIP, the UK’s GDP would increase annually by 0.14-0.35 per cent over a ten-year period.
Following the loss of the UK’s attractiveness to vertical FDI due to reduced access to the EU market, Ireland may attract additional FDI, possibly in manufacturing and financial services. However, given large sunk costs, disinvestment in the UK is less likely, particularly in large fixed cost sectors.
In the case of Brexit, to compensate for the loss of attractiveness to FDI linked to reduced access to the EU market, the UK might consider to further reform its tax system in order to make its corporation tax system more competitive. Currently at 20 per cent, the UK’s corporation tax rate is one of the lowest in the G20. Further reductions of the UK’s corporate tax rate have been already announced in the Summer Budget in July 2015. Thus, the corporation tax rate will be reduced to 19 per cent from 1 April 2017 and 18 per cent from 1 April 2020. A more competitive corporate tax rate is likely to attract more FDI to the UK which would impact positively on the UK’s productivity growth. While the UK’s increased attractiveness to FDI might divert some FDI away from Ireland, its overall effect would depend on gains generated by Ireland’s additional trade and investment with the UK.
In the case of Brexit, trade between the UK and other EU countries would face higher costs. Depending on the extent and nature of trade agreements between the UK and the EU, such trade costs would be in the form of non-tariff barriers (rules of origin, product standards, and licensing requirements) and tariffs (custom duties). In the presence of higher trade costs, firms willing to serve the UK market might decide to do this via FDI rather than trade. As a result, the UK would attract more horizontal FDI to substitute trade. This gain would have to be balanced against losses in vertical FDI. As nearly all studies find that the net effect of trade barriers is to lower FDI (see Blonigen and Piger, 2011, for a survey), a priori our expectation is that Brexit would reduce FDI in the UK, a result supported by our analysis below.
3.3 POSSIBLE BREXIT SCENARIOS