Linguistic Features for Quality Estimation
Mariano Felice
Research Group in Computational Linguistics University of Wolverhampton
Stafford Street
Wolverhampton, WV1 1SB, UK [email protected]
Lucia Specia
Department of Computer Science University of Sheffield Regent Court, 211 Portobello
Sheffield, S1 4DP, UK [email protected]
Abstract
This paper describes a study on the contribu-tion of linguistically-informed features to the task of quality estimation for machine trans-lation at sentence level. A standard regression algorithm is used to build models using a com-bination of linguistic and non-linguistic fea-tures extracted from the input text and its ma-chine translation. Experiments with English-Spanish translations show that linguistic fea-tures, although informative on their own, are not yet able to outperform shallower features based on statistics from the input text, its translation and additional corpora. However, further analysis suggests that linguistic infor-mation is actually useful but needs to be care-fully combined with other features in order to produce better results.
1 Introduction
Estimating the quality of automatic translations is becoming a subject of increasing interest within the Machine Translation (MT) community for a num-ber of reasons, such as helping human translators post-editing MT, warning users about non-reliable translations or combining output from multiple MT systems. Different from most classic approaches for measuring the progress of an MT system or compar-ing MT systems, which assess quality by contrast-ing system output to reference translations such as BLEU (Papineni et al., 2002), Quality Estimation (QE) is a more challenging task, aimed at MT sys-tems in use, and therefore without access to refer-ence translations.
From the findings of previous work on reference-dependent MT evaluation, it is clear that metrics exploiting linguistic information can achieve sig-nificantly better correlation with human judgments on quality, particularly at the level of sentences (Gim´enez and M`arquez, 2010). Intuitively, this should also apply for quality estimation metrics: while evaluation metrics compare linguistic repre-sentations of the system output and reference trans-lations (e.g. matching of n-grams of part-of-speech tags or predicate-argument structures), quality esti-mation metrics would perform the (more complex) comparison og linguistic representations of the input and translation texts. The hypothesis put forward in this paper is therefore that using linguistic informa-tion to somehow contrast the input and translainforma-tion texts can be beneficial for quality estimation.
We test this hypothesis as part of the WMT-12 shared task on quality estimation. The system sub-mitted to this task (WLV-SHEF) integrates linguis-tic information to a strong baseline system using only shallow statistics from the input and transla-tion texts, with no explicit informatransla-tion from the MT system that produced the translations. A variant also tests the addition of linguistic information to a larger set of shallow features. The quality esti-mation problem is modelled as a supervised regres-sion task using Support Vector Machines (SVM), which has been shown to achieve good performance in previous work (Specia, 2011). Linguistic features are computed using a number of auxiliary resources such as parsers and monolingual corpora.
The remainder of this paper is organised as fol-lows. Section 2 gives an overview of previous work
on quality estimation, Section 3 describes the set of linguistic features proposed in this paper, along with general experimental settings, Section 4 presents our evaluation and Section 5 provides conclusions and a brief discussion of future work.
2 Related Work
Reference-free MT quality assessment was ini-tially approached as aConfidence Estimation task, strongly biased towards exploiting data from a Sta-tistical MT (SMT) system and the translation pro-cess to model the confidence of the system in the produced translation. Blatz et al. (2004) attempted sentence-level assessment using a set of 91 features (from the SMT system input and translation texts) and automatic annotations such as NIST and WER. Experiments on classification and regression using different machine learning techniques produced not very encouraging results. More successful experi-ments were later run by Quirk (2004) in a similar setting but using a smaller dataset with human qual-ity judgments.
Specia et al. (2009a) used Partial Least Squares regression to jointly address feature selection and model learning using a similar set of features and datasets annotated with both automatic and human scores. Black-box features (i.e. those extracted from the input and translation texts only) were as discrim-inative as glass-box features (i.e. those from the MT system). Later work using black-box features only focused on finding an appropriate threshold for dis-criminating ‘good’ from ‘bad’ translations for post-editing purposes (Specia et al., 2009b) and investi-gating more objective ways of obtaining human an-notation, such as post-editing time (Specia, 2011).
Recent approaches have started exploiting lin-guistic information with promising results. Specia et al. (2011), for instance, used part-of-speech (PoS) tagging, chunking, dependency relations and named entities for English-Arabic quality estimation. Hard-meier (2011) explored the use of constituency and dependency trees for English-Swedish/Spanish quality estimation. Focusing on word-error detec-tion through the estimadetec-tion of WER, Xiong et al. (2010) used PoS tags of neighbouring words and a link grammar parser to detect words that are not con-nected to the rest of the sentence. Work by Bach et
al. (2011) focused on learning patterns of linguis-tic information (such as sequences of part-of-speech tags) to predict sub-sentence errors. Finally, Pighin and M`arquez (2011) modelled the expected projec-tions of semantic roles from the input text into the translations.
3 Method
Our work focuses on the use of a wide range of linguistic information for representing different as-pects of translation quality to complement shallow, system-independent features that have been proved to perform well in previous work.
3.1 Linguistic features
Non-linguistic features, such as sentence length or n-gram statistics, are limited in their scope since they can only account for very shallow aspects of a translation. They convey no notion of meaning, grammar or content and as a result they could be very biased towards describing only superficial as-pects. For this reason, we introduce linguistic fea-tures that account for richer aspects of translations and are in closer relation to the way humans make their judgments. All of the proposed features, lin-guistic or not, are MT-system independent.
The proposal of linguistic features was guided by three main aspects of translation: fidelity, fluency and coherence. The number of features that were eventually extracted was inevitably limited by the availability of suitable tools for the language pair at hand, mainly for Spanish. As a result, many of the features that were initially devised could not be implemented (e.g. grammar checking). A total of 70linguistic features were extracted, as summarised below, where S and T indicate whether they refer to the source/input or translation texts respectively:
• Sentence 3-gram log-probability and perplexity using a language model (LM) of PoS tags [T]
• Number, percentage and ratio of content words (N, V, ADJ) and function words (DET, PRON, PREP, ADV) [S & T]
• Percentage of nouns, verbs and pronouns in the sentence and their ratios between [S & T]
• Number and difference in deictic elements in [S & T]
• Number and difference in specific types of named entities (person, organisation, location, other) and the total of named entities [S & T]
• Number and difference in noun, verb and prepositional phrases [S & T]
• Number of “dangling” (i.e. unlinked) deter-miners [T]
• Number of explicit (pronominal, non-pronominal) and implicit (zero pronoun) subjects [T]
• Number of split contractions in Spanish (i.e. al=a el,del=de el) [T]
• Number and percentage of subject-verb dis-agreement cases [T]
• Number of unknown words estimated using a spell checker [T]
While many of these features attempt to check for general errors (e.g. subject verb disagreement), others are targeted at usual MT errors (e.g. “dan-gling” determiners, which are commonly introduced by SMT systems and are not linked to any words) or target language peculiarities (e.g. Spanish contrac-tions, zero subjects). In particular, studying deeper aspects such as different types of subjects can pro-vide a good indication of how natural a translation is in Spanish, which is a pro-drop language. Such a distinction is expected to spot unnatural expressions, such as those caused by unnecessary pronoun repe-tition.1
For subject classification, we identified all VPs and categorised them according to their preceding
1E.g. (1)The girl beside me was smiling rather brightly.
She thought it was an honor that the exchange student should be seated next to her. →*La ni˜na a mi lado estaba sonriente bastante bien. Ella pens´o que era un honor que el intercambio de estudiantes se encuentra pr´oximo a ella.(superfluous) (2)She is thought to have killed herself through suffocation us-ing a plastic bag.→*Ella se cree que han matado a ella medi-ante asfixia utilizando una bolsa de pl´astico.(confusing)
NPs. Thus, explicit subjects were classified as pronominal (PRON+VP) or non-pronominal (NON-PRON-NP+VP) while implicit subjects only in-cluded elided (zero) subjects (i.e. a VP not preceded by an NP).
Subject-verb agreement cases were estimated by rules analysing person, number and gender matches in explicit subject cases, considering also inter-nal NP agreement between determiners, nouns, ad-jectives and pronouns.2 Deictics, common coher-ence indicators (Halliday and Hasan, 1976), were checked against manually compiled lists.3 Unknown words were estimated using the JMySpell4 spell checker with the publicly available Spanish (es ES) OpenOffice5 dictionary. In order to avoid incorrect estimates, all named entities were filtered out before spell-checking.
TreeTagger (Schmid, 1995) was used for PoS tag-ging of English texts, while Freeling (Padr´o et al., 2010) was used for PoS tagging in Spanish and for constituency parsing, dependency parsing and named entity recognition in both languages.
In order to compute n-gram statistics over PoS tags, two language models of general and more detailed morphosyntactic PoS were built using the SRILM toolkit (Stolcke, 2002) on the PoS-tagged AnCora corpus (Taul´e et al., 2008).
3.2 Shallow features
In a variant of our system, the linguistic features were complemented by a set of 77 non-linguistic features:
• Number and proportion of unique tokens and numbers in the sentence [S & T]
• Sentence length ratios [S & T]
• Number of non-alphabetical tokens and their ratios [S & T]
• Sentence 3-gram perplexity [S & T]
2
E.g. *Algunas de estas personas se convertir´a en h´eroes. (number mismatch), *Barricadas fueron creados en la calle Cortlandt.(gender mismatch), *Buena mentirosos est´an cuali-ficados en lectura.(internal NP gender and number mismatch).
3
These included common deictic terms compiled from vari-ous sources, such ashoy,all´ı,t´u(Spanish) orthat,noworthere (English).
4
• Type/Token Ratio variations: corrected TTR (Carroll, 1964), Log TTR (Herdan, 1960), Guiraud Index (Guiraud, 1954), Uber Index (Dugast, 1980) and Jarvis TTR (Jarvis, 2002) [S & T]
• Average token frequency from a monolingual corpus [S]
• Mismatches in opening and closing brackets and quotation marks [S & T]
• Differences in brackets, quotation marks, punc-tuation marks and numbers [S & T]
• Average number of occurrences of all words within the sentence [T]
• Alignment score (IBM-4) and percentage of different types of word alignments by GIZA++ (from the SMT training alignment model pro-vided)
Our basis for comparison is the set of17baseline features, which are shallow MT system-independent features provided by the WMT-12 QE shared task organizers.
3.3 Building QE models
We created two main feature sets from the features listed above for the WMT-12 QE shared task:
WLV-SHEF FS: all features, that is, baseline fea-tures, shallow features (Section 3.2) and lin-guistic features (Section 3.1).
WLV-SHEF BL: baseline features and linguistic features (Section 3.1).
Additionally, we experimented with other variants of these feature sets using 3-fold cross validation on the training set, such as only linguistic features and only non-linguistic features, but these yielded poorer results and are not reported in this paper.
We address the QE problem as a regression task by building SVM models with an epsilon regressor and a radial basis function kernel using the LibSVM toolkit (Chang and Lin, 2011). Values for the cost, epsilon and gamma parameters were optimized us-ing 5-fold cross validation on the trainus-ing set.
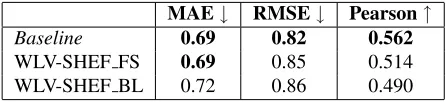
MAE↓ RMSE↓ Pearson↑
Baseline 0.69 0.82 0.562
WLV-SHEF FS 0.69 0.85 0.514 WLV-SHEF BL 0.72 0.86 0.490
Table 1: Scoring performance
The training sets distributed for the shared task comprised1,832English sentences taken from news texts and their Spanish translations produced by an SMT system, Moses (Koehn et al., 2007), which had been trained on a concatenation of Europarl and news-commentaries data (from WMT-10). Transla-tions were accompanied by a quality score derived from an average of three human judgments of post-editing effort using a1-5scale.
The models built for each of these two feature sets were evaluated using the official test set of422 sentences produced in the same fashion as the train-ing set. Two sub-tasks were considered: (i) scor-ing translations using the 1-5 quality scores, and (ii)rankingtranslations from best to worse. While quality scores were directly predicted by our mod-els, sentence rankings were defined by ordering the translations according to their predicted scores in de-scending order, with no additional criteria to resolve ties other than the natural ordering given by the sort-ing algorithm.
4 Results and Evaluation
Table 1 shows the official results of our systems in the scoring task in terms of Mean Absolute Error (MAE) and Root Mean Squared Error (RMSE), the metrics used in the shared task, as well as in terms of Pearson correlation.
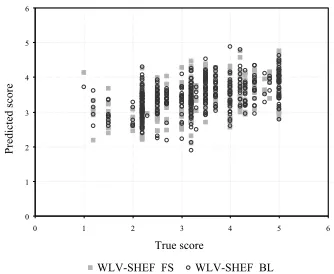
com-Figure 1: Comparison of true versus predicted scores
bination of features that outperforms the baseline, as is later described in this section.
A correlation analysis between our predicted scores and the gold standard (Figure 1) shows some dispersion, especially for the WLV-SHEF FS set, with lower Pearson coefficients when compared to the baseline. The fluctuation of predicted values for a single score is also very noticeable, spanning more than one score band in some cases. However, if we consider the RMSE achieved by our models, we find that, on average, predictions deviate less than0.9 ab-solute points.
A closer look at the score distribution (Figure 2) reveals our models had some difficulty predicting scores in the 1-2 range, possibly affected by the lower proportion of these cases in the training data. In addition, it is interesting to see that the only sen-tence with a true score of 1 is predicted as a very good translation (with a score greater than3.5). The reason for this is that the translation has isolated grammatical segments that our features might regard as good but it is actually not faithful to the original.6 Although the cause for this behaviour can be traced to inaccurate tokenisation, this reveals that our fea-tures assess fidelity only superficially and deeper semantically-aware indicators should be explored.
Results for the ranking task also fall below the baseline as shown in Table 2, according to the two official metrics: DeltaAvg and Spearman rank cor-relation coefficient.
4.1 Further analysis
At first glance, the performance of our models seems to indicate that the integration of linguistic
infor-6
[image:5.612.343.510.52.189.2]I won’t give it away.→*He ganado ’ t darle.
Figure 2: Scatter plot of true versus predicted scores
DeltaAvg↑ Spearman↑
Baseline 0.55 0.58
WLV-SHEF FS 0.51 0.52
WLV-SHEF BL 0.50 0.49
Table 2: Ranking performance
mation is not beneficial, since both linguistically-informed feature sets lead to poorer performance as compared to the baseline feature set, which contains only shallow, language-independent features. How-ever, there could be many factors affecting perfor-mance so further analysis was necessary to assess their contribution.
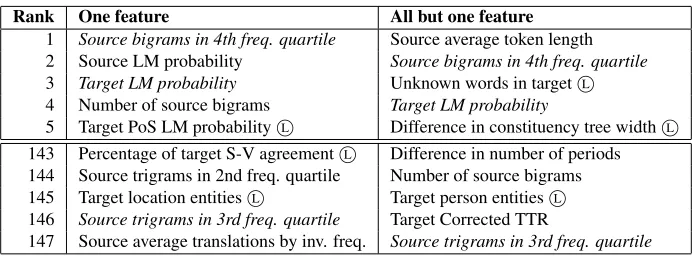
Our first analysis focuses on the performance of individual features. To this end, we built and tested models using only one feature at a time and repeated the process afterwards using the full WLV-SHEF FS set without one feature at a time. In Table 3 we re-port the 5-best and 5-worst performing features. Al-though purely statistical features lead the rank, lin-guistic features also appear among the top five (as indicated byL), showing that they can be as good
as other shallow features. It is interesting to note that a few features appear as the top performing in both columns (e.g. source bigrams in 4th frequency quar-tile and target LM probability). These constitute the truly top performing features.
[image:5.612.80.291.52.172.2] [image:5.612.318.533.235.292.2]Rank One feature All but one feature
1 Source bigrams in 4th freq. quartile Source average token length 2 Source LM probability Source bigrams in 4th freq. quartile 3 Target LM probability Unknown words in targetL
4 Number of source bigrams Target LM probability
5 Target PoS LM probabilityL Difference in constituency tree widthL
143 Percentage of target S-V agreementL Difference in number of periods
144 Source trigrams in 2nd freq. quartile Number of source bigrams 145 Target location entitiesL Target person entitiesL
146 Source trigrams in 3rd freq. quartile Target Corrected TTR
[image:6.612.133.481.52.181.2]147 Source average translations by inv. freq. Source trigrams in 3rd freq. quartile Table 3: List of best and worst performing features
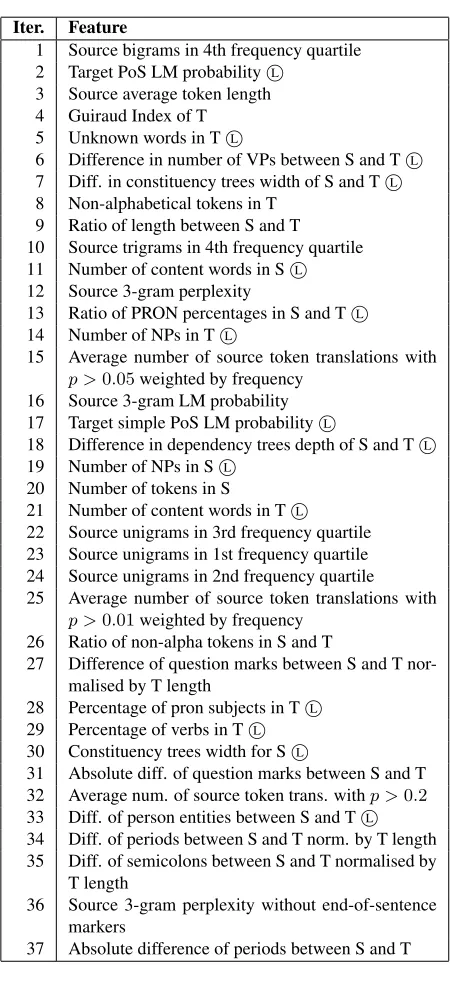
full feature set,7 it is infeasible in practice so we adopted the Sequential Forward Selection method instead (Alpaydin, 2010). Using this method, we start from an empty set and add one feature at a time, keeping in the set only the features that decrease the error until no further improvement is possible. This strategy decreases the number of iterations substan-tially8but it does not guarantee finding a global op-timum. Still, a local optimum was acceptable for our purpose. The optimal feature set found by our selection algorithm is shown in Table 4.
Error rates are lower when using this optimal fea-ture set (MAE=0.62and RMSE=0.76) but the differ-ence is only statistically significant when compared to the baseline with93% confidence level (paired t-test withp <= 0.07). However, this analysis allows us to see how many linguistic features get selected for the optimal feature set.
Out of the total 37 features in the optimal set, 15 are linguistic (40.5%), showing that they are in fact informative when strategically combined with other shallow indicators. This also reveals that fea-ture selection is a key issue for building a quality estimation system that combines linguistic and shal-low information. Using a sequential forward selec-tion method, the optimal set is composed of both lin-guistic and shallow features, reinforcing the idea that they account for different aspects of quality and are not interchangeable but actually complementary.
7
For 147 features:2147 8
For 147 features, worst case is 147×(147 + 1)/2 = 10,878.
5 Conclusions and Future Work
We have explored the use of linguistic informa-tion for quality estimainforma-tion of machine translainforma-tions. Our approach was not able to outperform a baseline with only shallow features. However, further feature analysis revealed that linguistic features are comple-mentary to shallow features and must be strategi-cally combined in order to be exploited efficiently.
The availability of linguistic tools for processing Spanish is limited, and thus the linguistic features used here only account for a few of the many aspects involved in translation quality. In addition, comput-ing lcomput-inguistic information is a challengcomput-ing process for a number of reasons, mainly the fact that trans-lations are often ungrammatical, and thus linguistic processors may return inaccurate results, leading to further errors.
In future work we plan to integrate more global linguistic features such as grammar checkers, along with deeper features such as semantic roles, hybrid n-grams, etc. In addition, we have noticed that rep-resenting information for input and translation texts independently seems more appropriate than con-trasting input and translation information within the same feature. This representation issue is somehow counter-intuitive and is yet to be investigated.
Acknowledgements
Iter. Feature
1 Source bigrams in 4th frequency quartile 2 Target PoS LM probabilityL
3 Source average token length 4 Guiraud Index of T 5 Unknown words in TL
6 Difference in number of VPs between S and TL
7 Diff. in constituency trees width of S and TL
8 Non-alphabetical tokens in T 9 Ratio of length between S and T 10 Source trigrams in 4th frequency quartile 11 Number of content words in SL
12 Source 3-gram perplexity
13 Ratio of PRON percentages in S and TL
14 Number of NPs in TL
15 Average number of source token translations with
p >0.05weighted by frequency 16 Source 3-gram LM probability 17 Target simple PoS LM probabilityL
18 Difference in dependency trees depth of S and TL
19 Number of NPs in SL
20 Number of tokens in S
21 Number of content words in TL
22 Source unigrams in 3rd frequency quartile 23 Source unigrams in 1st frequency quartile 24 Source unigrams in 2nd frequency quartile 25 Average number of source token translations with
p >0.01weighted by frequency 26 Ratio of non-alpha tokens in S and T
27 Difference of question marks between S and T nor-malised by T length
28 Percentage of pron subjects in TL
29 Percentage of verbs in TL
30 Constituency trees width for SL
31 Absolute diff. of question marks between S and T 32 Average num. of source token trans. withp >0.2 33 Diff. of person entities between S and TL
34 Diff. of periods between S and T norm. by T length 35 Diff. of semicolons between S and T normalised by
T length
36 Source 3-gram perplexity without end-of-sentence markers
[image:7.612.73.298.104.599.2]37 Absolute difference of periods between S and T
Table 4: An optimal set of features for the test set. The number of iteration indicates the order in which features were selected, giving a rough ranking of features by their performance.
References
Ethem Alpaydin. 2010. Introduction to Machine Learn-ing. Adaptive Computation and Machine Learning. The MIT Press, Cambridge, MA, 2nd edition. Nguyen Bach, Fei Huang, and Yaser Al-Onaizan. 2011.
Goodness: A method for measuring machine transla-tion confidence. InProceedings of the 49th Annual Meeting of the Association for Computational Linguis-tics: Human Language Technologies, pages 211–219, Portland, Oregon, USA, June. Association for Compu-tational Linguistics.
John Blatz, Erin Fitzgerald, George Foster, Simona Gan-drabur, Cyril Goutte, Alex Kulesza, Alberto Sanchis, and Nicola Ueffing. 2004. Confidence estimation for machine translation. Final Report of Johns Hop-kins 2003 Summer Workshop on Speech and Lan-guage Engineering, Johns Hopkins University, Balti-more, Maryland, USA, March.
John Bissell Carroll. 1964. Language and Thought. Prentice-Hall, Englewood Cliffs, NJ.
Chih-Chung Chang and Chih-Jen Lin. 2011. Libsvm: A library for support vector machines. ACM Trans. Intell. Syst. Technol., 2(3):1–27, May.
Daniel Dugast. 1980. La statistique lexicale. Slatkine, Gen`eve.
Jes´us Gim´enez and Llu´ıs M`arquez. 2010. Linguistic measures for automatic machine translation evalua-tion. Machine Translation, 24(3):209–240.
Pierre Guiraud. 1954. Les Caract`eres Statistiques du Vocabulaire. Presses Universitaires de France, Paris. Michael A. K. Halliday and Ruqaiya Hasan. 1976.
Co-hesion in English. Longman, London.
Christian Hardmeier. 2011. Improving machine transla-tion quality predictransla-tion with syntactic tree kernels. In
Proceedings of the 15th conference of the European Association for Machine Translation (EAMT 2011), pages 233–240, Leuven, Belgium.
Gustav Herdan. 1960. Type-token Mathematics: A Text-book of Mathematical Linguistics. Mouton & Co., The Hague.
Scott Jarvis. 2002. Short texts, best-fitting curves and new measures of lexical diversity. Language Testing, 19(1):57–84, January.
Llus Padr´o, Miquel Collado, Samuel Reese, Marina Lloberes, and Irene Castell´on. 2010. Freeling 2.1: Five years of open-source language process-ing tools. In Nicoletta Calzolari (Conference Chair), Khalid Choukri, Bente Maegaard, Joseph Mariani, Jan Odijk, Stelios Piperidis, Mike Rosner, and Daniel Tapias, editors,Proceedings of the Seventh conference on International Language Resources and Evaluation (LREC’10), Valletta, Malta, May. European Language Resources Association (ELRA).
Kishore Papineni, Salim Roukos, Todd Ward, and Wei-Jing Zhu. 2002. Bleu: a method for automatic eval-uation of machine translation. InProceedings of the 40th Annual Meeting on Association for Computa-tional Linguistics, pages 311–318.
Daniele Pighin and Llu´ıs M`arquez. 2011. Automatic projection of semantic structures: an application to pairwise translation ranking. In Fifth Workshop on Syntax, Semantics and Structure in Statistical Trans-lation (SSST-5), Portland, Oregon.
Christopher B. Quirk. 2004. Training a sentence-level machine translation confidence metric. In Proceed-ings of the International Conference on Language Re-sources and Evaluation, volume 4 of LREC 2004, pages 825–828, Lisbon, Portugal.
Helmut Schmid. 1995. Improvements in part-of-speech tagging with an application to german. In In Pro-ceedings of the ACL SIGDAT-Workshop, pages 47–50, Dublin, Ireland, August.
Lucia Specia, Marco Turchi, Nicola Cancedda, Marc Dymetman, and Nello Cristianini. 2009a. Estimating the sentence-level quality of machine translation sys-tems. InProceedings of the 13th Annual Conference of the European Association for Machine Translation (EAMT), pages 28–35, Barcelona, Spain, May. Lucia Specia, Marco Turchi, Zhuoran Wang, John
Shawe-Taylor, and Craig Saunders. 2009b. Improv-ing the confidence of machine translation quality esti-mates. InProceedings of the Twelfth Machine Transla-tion Summit (MT Summit XII), pages 136–143, Ottawa, Canada, August.
Lucia Specia, Najeh Hajlaoui, Catalina Hallett, and Wilker Aziz. 2011. Predicting machine translation adequacy. InMachine Translation Summit XIII, pages 19–23, Xiamen, China, September.
Lucia Specia. 2011. Exploiting objective annotations for measuring translation post-editing effort. In Proceed-ings of the 15th Conference of the European Associa-tion for Machine TranslaAssocia-tion, pages 73–80, Leuven. Andreas Stolcke. 2002. Srilman extensible language
modeling toolkit. In Proceedings of the 7th Inter-national Conference on Spoken Language Process-ing (ICSLP 2002), volume 2, pages 901–904, Denver, USA, November.
Mariona Taul´e, M. Antnia Mart´ı, and Marta Recasens. 2008. Ancora: Multilevel annotated corpora for cata-lan and spanish. In Nicoletta Calzolari (Conference Chair), Khalid Choukri, Bente Maegaard, Joseph Mar-iani, Jan Odijk, Stelios Piperidis, Mike Rosner, and Daniel Tapias, editors, Proceedings of the Sixth In-ternational Conference on Language Resources and Evaluation (LREC’08), Marrakech, Morocco, May. European Language Resources Association (ELRA). Deyi Xiong, Min Zhang, and Haizhou Li. 2010.