Automatic Grading of Scientific Inquiry
Avirup Sil
Computer and Information Sciences Temple University
Philadelphia, PA
Angela Shelton
College of Education Temple University
Philadelphia, PA [email protected]
Diane Jass Ketelhut
Teaching and Learning, Policy and Leadership University of Maryland
College Park, MD [email protected]
Alexander Yates
Computer and Information Sciences Temple University
Philadelphia, PA [email protected]
Abstract
The SAVE Science project is an attempt to ad-dress the shortcomings of current assessments of science. The project has developed two vir-tual worlds that each have a mystery or natu-ral phenomenon requiring scientific explana-tion; by recording students’ behavior as they investigate the mystery, these worlds can be used to assess their understanding of the scien-tific method. Currently, however, the scoring of the assessment depends either on manual grading of students’ written responses, or, on multiple choice questions. This paper presents an automated grader that can combine with SAVE Science’s virtual worlds to provide a cheap mechanism for assessments of the abil-ity to apply scientific methodology. In experi-ments on over 300 middle school students, our best automated grader improves by over 50% relative to the closest system from previous work in predicting grades supplied by human judges.
1 Introduction
Education researchers criticize current standardized tests of science on many grounds. First, they lack context (Behrens et al., 2007), which complicates a student’s task of applying classroom-based learning, as the theory of situated cognition suggests (Brown et al., 1989). Second, many have criticized such tests for failing to engage students long enough to apply their understanding to the question. Further-more and perhaps worst of all, standardized tests fail to assess scientific inquiry—the ability of students to apply the scientific method—authentically rather
than as scientific content (National Research Coun-cil, 2005; Singley and Taft, 1995).
We consider an assessment conducted by the Situated Assessment using Virtual Environments for Science Content and Inquiry (SAVE Science) project (Ketelhut et al., 2010; Ketelhut et al., 2009), whose long-term goal is to address the shortcomings of current standardized tests of science. The assess-ments from SAVE Science have produced an abun-dance of data on how students interact with a vir-tual world, when trying to conduct scientific inquiry. Observing student behavior in virtual environments offers the potential for new insights into both how students learn and what they know. However, this benefit can only be realized if we can make sense of the stream of data and text produced by the students.
In this paper, we attempt to automate the process of grading students in SAVE Science assessments, to make the evaluations as cost-effective as standard-ized tests. Unlike most previous systems for au-tomated grading (Sukkarieh and Stoyanchev, 2009; Sukkarieh et al., 2004; Higgins et al., 2004; Wang et al., 2008), the data for this task includes a short paragraph (usually 50-60 words) natural language response stating a hypothesis and evidence in sup-port of it. In addition, there is a wealth of relational data about student behavior in a virtual environment. We develop novel predictors for automatically grad-ing the written responses usgrad-ing a wide variety of nat-ural language features, as well as features from the data on student behavior in the virtual world. On student data from two virtual worlds, our best
auto-mated grader has correlations ofr = 0.58and 0.44
with human judgments, improving over the closest
technique from previous work by 56% for the first world, and by 120% for the second.
The rest of the paper is organized as follows. The next section contrasts this project with previ-ous work. Section 3 describes the SAVE Science project and the student data it has produced. Section 4 details our automated grading models. Section 5 reports on experiments, and Section 6 concludes.
2 Previous Work
Wang et al. (2008) have previously conducted a study on assessing creative problem-solving in sci-ence education by automatically grading student
es-says. Our techniques improve substantially over
theirs, as we demonstrate empirically. In part, we improve by including more sophisticated language-processing features in our model than the unigram and bigram features they use; as others have noted, bag-of-words representations and latent semantic indexing become less useful as word order and causal relationships become important for judging an essay’s quality (Malatesta et al., 2002; Wiemer-Hastings et al., 2005). A secondary reason for our improvement is that we also have access to non-linguistic data about the students that we can mine for additional patterns.
Most previous research on automated grading of written text focuses on short, factual text (Wiemer-Hastings et al., 1999; Mohler and Mihalcea, 2009; Leacock and Chodorow, 2003; Sukkarieh and Stoy-anchev, 2009; Sukkarieh et al., 2004; Mitchell et al., 2002; Pulman and Sukkarieh, 2005), whereas SAVE Science’s texts are only partly factual. Responses are meant to convey a scientific explanation of a mystery, and therefore, correct responses contain in-ferences, observations of the world, and causal links between observations and inferences.
Automatic systems for grading longer responses typically grade essays for coherence and discourse structure (Burstein et al., 2001; Higgins et al., 2004), but these global discourse criteria are only partially indicative of the quality of a student’s response to the SAVE Science assessments. To be considered fully correct in these tests, student responses must contain factually correct information, as well as causal rela-tionships that justify the student’s inferences, such as “The balls don’t bounce outside because it’s cold,
and lower temperatures decrease pressure.”
3 Assessing Scientific Inquiry Using Virtual Worlds
We now give a brief overview of SAVE Science, which aims to complement (or even replace) cur-rent standardized tests for evaluating students’ un-derstanding of science. We first present the project’s goals and methodology, and then describe the chal-lenges involved in creating an automated evalua-tion of student performance for this new assessment paradigm.
3.1 The SAVE Science Project
SAVE Science (Ketelhut et al., 2010; Ketelhut et al., 2009; Ketelhut et al., 2012) is a novel project for evaluating students’ understanding of the scientific method — problem identification, gathering data, analyzing data, developing a hypothesis, and com-municating results — by asking students to solve a mystery in a virtual world through the applica-tion of the scientific method to a content-based prob-lem. Using immersive virtual environments for as-sessments is a current area of focus among educa-tion researchers (Clarke-Midura, 2010); SAVE Sci-ence is unique in its attempt to assess
understand-ing of bothinquiry as well ascontent. That is, the
test is designed to assess students’ ability to apply their knowledge of the scientific inquiry processes to a problem they have never seen before, but within a content area they have just studied. To be suc-cessful, students must explore a virtual environment, collect appropriate data about it, and find evidence that supports their inference about the cause of the mystery. Part of the reasoning for a particular con-clusion draws on scientific knowledge learned in the classroom, but for these mysteries such knowledge of scientific content is insufficient. Students must also be able to explore the virtual world and create a hypothesis about the cause of the problem, based on their observations and analysis of collected data.
For this study, we concentrate on two virtual worlds produced by the SAVE Science project team,
Basketball and Weather Trouble. Screenshots of
the two virtual worlds are shown in Figure 1.
Stu-dents are represented by anavatar, or virtual
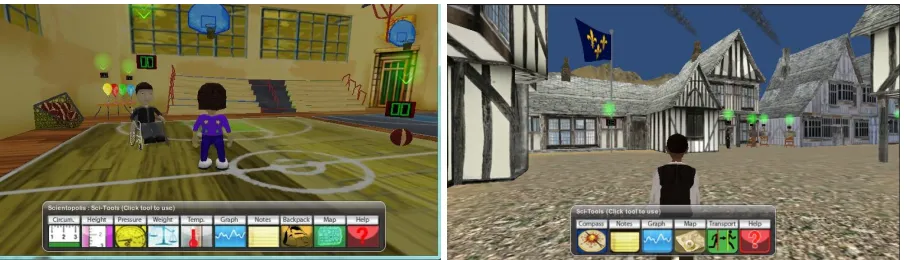
Figure 1: Screenshots from SAVE Science’s virtual environments. Left: the Basketball module. Right: the Weather Trouble module. The bar of icons along the bottom of the screen shows various tools that students may choose to use in the world, including a map, compass, graphing tool, note pad, and instruments like a barometer and thermometer, among others. Glowing green arrows indicate “objects” (sometimes including people) with which the student’s avatar may interact, by making observations, by taking measurements, or through conversation.
with a mouse or key presses. When the test be-gins, one character in the world informs the student of a mystery that the student needs to explain. In the Weather Trouble world, citizens of Scientopolis are concerned with the lack of rain recently, and ask the avatar to determine whether it will rain soon. In the Basketball world, a basketball tournament staffer is concerned that students cannot play basketball on the outdoor playground, because the balls will not bounce high enough outdoors, even though the same balls bounce just fine indoors.
Once informed of the mission, the student (through her or his avatar) explores the world, and interacts with objects or other characters in the vir-tual world by “colliding” with them. Interactions with characters mostly involve the character telling the avatar some part of the story of the world through
their eyes (e.g., “It hasn’t rained here in weeks; I
hope it rains soon!”). The conversation may yield
useful clues, or it may be “folk science” (e.g., “The
sheep are lying down, so it is probably going to rain soon”). When the avatar interacts with an object, the student can choose from a set of tools to determine measurements of the object. Measurements that a student deems interesting can be recorded in the stu-dent’s clipboard, and a graphing tool allows students to construct charts from the data in the clipboard.
Once students have finished exploring, collect-ing data, and analyzcollect-ing the data, they are asked to communicate the results by writing a brief expla-nation for the cause of the mystery for the world.
In addition, students are asked to provide what they consider to be the top three pieces of evidence for
their explanation. Both the explanation and the
ranked evidence are written in freeform text, con-sisting of 48.5 words on average for Basketball, and 62.4 for Weather Trouble. We refer to the expla-nation and ranked evidence collectively as the
stu-dent’s freeform response. These texts are critical
components of the overall data about the student, as they can be used to assess the student’s ability to communicate findings.
3.2 Assessing the ability to make scientific
inquiries
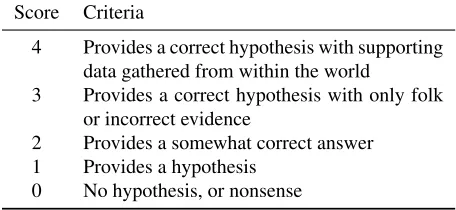
Score Criteria
4 Provides a correct hypothesis with supporting data gathered from within the world
3 Provides a correct hypothesis with only folk or incorrect evidence
2 Provides a somewhat correct answer 1 Provides a hypothesis
0 No hypothesis, or nonsense
Table 1: Rubric for manual scoring of freeform re-sponses.
Score Example
3 it’s because the air outside is more colder than the air inside here the cold air causes the air molecules to gather up toghter tight toghter causeing the ball to deflate and have less bounce . . .
[image:4.612.71.299.58.163.2]1 the wieght isnt up to regulations but the bouce is ok everyball i bouce it bouced according to regulartion but almost every ball has the weight of 1.25 . . .
Figure 2: Example portions of two freeform responses from Basketball, presented as written by the students.
below as gold standards for automated predictors for assessment.
Manual grading of the freeform responses uses a rubric of integer scores from 0 to 4. Guidelines for the rubric scores are shown in Table 1, and two ex-ample responses are shown in Figure 2. Two anno-tators, the first holding a PhD in education and the second a PhD student in computer science, indepen-dently judged each response, achieving a high
inter-annotator agreement — for Basketball, Cohen’sκ=
0.95, Pearson’sρ = 0.98; and for Weather Trouble
κ = 0.8, ρ = 0.93. For our experiments, we use
the judgments of the first annotator, who helped de-sign the virtual worlds and has experience in grading student essays, but the choice of which annotator’s judgments to use makes little difference to the re-sults.
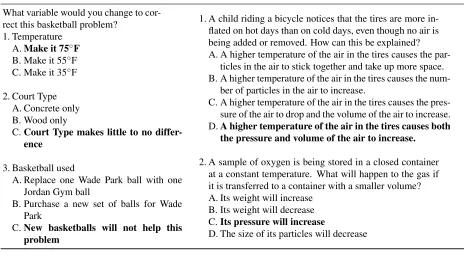
The multiple choice questions, which we callquiz
questions, consist of two types, as shown in Table
2. The first type, which we callcontextualized
ques-tions, directly test students’ understanding of the sci-entific issues that arise in the virtual environment
of the module.Non-contextualized questionsare
re-lated to the topic of the module, but they can be an-swered correctly using general scientific knowledge rather than specific knowledge gleaned from explo-ration of the virtual world. The non-contextualized questions are taken from the benchmark exams of a major urban school district.
4 Predictors for Scientific Inquiry Grades
We now focus on the task of building automated pre-dictors for assessing students’ ability to make scien-tific inquiries. To do this, we turn the grading task into a classical machine learning problem, in which the system must learn from a set of training data (students and their grades) how to predict a grade for new students included in separate test data. We focus on two main types of models: ones that can grade by predicting how many multiple-choice ques-tions (contextualized, non-contextualized, or both) a student will answer correctly, and ones that can predict the manual grade assigned to a freeform re-sponse.
Unlike typical automated-grading systems for grading written or spoken natural language, our task includes a large additional source of evidence for the predictions: data about the students’ behavior in the virtual world. Our prediction models therefore make extensive use of both the freeform response and data from the students’ behavior in the world, which we refer to as world data.
4.1 Models
We use Support Vector Machines with Radial Ba-sis Function kernels (RBF-SVM) (Pang-Ning et al., 2006; Smola and Sch¨olkopf, 1998) for learning
non-linear regression models of grading. LetS be
the set of students evaluated through SAVE
Sci-ence’s virtual environment, and letf:S → Rn be
a vector-valued feature function providing n
real-valued features for each student, based on the stu-dent’s freeform response and behavior in the virtual
world. Letg:S → Rbe the target grading
func-tion, which provides a real-valued grade for each
student. The hypothesis spaceHfor RBF-SVMs
in-cludes functionsh:S→Rof the form
h(s) =
m
X
i=1
Contextualized Questions Non-Contextualized Questions
What variable would you change to cor-rect this basketball problem?
1. Temperature A.Make it 75◦F
B. Make it 55◦F C. Make it 35◦F
2. Court Type A. Concrete only B. Wood only
C.Court Type makes little to no differ-ence
3. Basketball used
A. Replace one Wade Park ball with one Jordan Gym ball
B. Purchase a new set of balls for Wade Park
C.New basketballs will not help this problem
1. A child riding a bicycle notices that the tires are more in-flated on hot days than on cold days, even though no air is being added or removed. How can this be explained? A. A higher temperature of the air in the tires causes the
par-ticles in the air to stick together and take up more space. B. A higher temperature of the air in the tires causes the
num-ber of particles in the air to increase.
C. A higher temperature of the air in the tires causes the pres-sure of the air to drop and the volume of the air to increase. D.A higher temperature of the air in the tires causes both
the pressure and volume of the air to increase.
2. A sample of oxygen is being stored in a closed container at a constant temperature. What will happen to the gas if it is transferred to a container with a smaller volume? A. Its weight will increase
B. Its weight will decrease C.Its pressure will increase
[image:5.612.73.537.69.328.2]D. The size of its particles will decrease
Table 2: Complete list of Basketball contextualized and non-contextualized quiz questions.Boldindicates the correct answer.
where the xi are the support vectors, andK is the
RBF kernel function, given by:
K(x,x0) = exp(−γkx−x0k2) (2)
Here,αi, b, γ ∈Rare parameters to be learned from
the training data. We use the Weka (Hall et al., 2009) toolkit for running standard training and prediction algorithms with the SVM.
We train models for four distinct prediction tasks,
each defined by a different grading function g(s):
1) g(s) is the manually-assessed grade on
stu-dent s’s freeform responses; 2) g(s) is the
num-ber of correctly-answered contextualized questions;
3) g(s) is the number of correctly-answered
non-contextualized questions; and 4) g(s) is the total
number of correctly-answered quiz questions (the
sum ofg(s)from 2 and 3). We use the same feature
functionffor all models, which we describe next.
4.2 World Features
From the database that records a student’s activity in the immersive virtual environment, we extract fea-tures describing the frequency and types of activi-ties in which students engaged. For both modules,
we include features for the number of object interac-tions, the number of distinct objects interacted with, the total number of measurements made, the number of measurements saved in the student’s clipboard, and the number of graphs made. We also include module-specific features: for example, in the Bas-ketball assessment module, we counted how many distinct basketballs were interacted with, how many measurements were made using each type of tool available in the Basketball world, whether a given student created graphs of temperature inside vs.
out-side, or graphs of temperature vs. pressure,etc. In
total, the model contains 69 world features in the Weather module, and 65 in the Basketball module. All features conform to the pattern of counts over particular types of actions the avatar might take. We
call the features from the virtual environmentworld
features.
this paper we are primarily interested in features of the freeform responses, which we now turn to.
4.3 Natural Language Features
We investigate standard text mining features from bag-of-words representations and Latent Semantic Analysis, as well as a variety of features tailored to the grading task. Spelling is a major problem for this type of prediction task, but spelling-correctors are investigated elsewhere (Kernighan et al., 1990) and are not a focus of this research. We therefore manually corrected spelling errors throughout the texts before extracting features and conducting ex-periments. No correction of grammar or punctuation was performed.
4.3.1 Latent Semantic Analysis Features
After removing 34 common stopwords, we extract a bag-of-words representation from the freeform responses (Manning and Sch¨utze, 1999). We apply Latent Semantic Analysis (LSA) (Lan-dauer and Dumais, 1997; Steyvers and Griffiths, 2006) to this set of features to produce a smaller set of 72 latent features for Basketball, and 94 for Weather Trouble, based on a threshold of retaining 90% of the variance in the data.
4.3.2 Features from Hidden Markov Models
LSA and other topic models identify latent struc-ture based on document-level cooccurrence statis-tics, but the “documents” in our data are short for topic-modeling purposes, and we have less than
200 of them for each world. As a result,
stan-dard topic modeling techniques may have difficulty identifying the appropriate structure. We therefore also consider Hidden Markov Models (HMMs) (Ra-biner, 1989), generative models which rely both on cooccurrence within a sentence and on sequence in-formation for determining model parameters.
Fol-lowing recent work by Huang et al. (2011) on
using HMMs to build representations, we esti-mate parameters for a fully-connected HMM with 100 latent states over the freeform responses us-ing Expectation-Maximization. We then decode the HMM over the corpus to produce a Viterbi-optimal latent state for each word. Finally, we use counts of these 100 latent states to produce 100 new features for each freeform response.
4.3.3 Detecting disengagement
A small number of students show little enthusi-asm for the test, and their responses and general per-formance are quite poor. Often their freeform re-sponses are short, or they repeat the same text mul-tiple times. We include three features that help iden-tify such cases: the overall length of the response, the number of times a full sentence is repeated ex-actly, and the number of tokens that are repeated across multiple sentences.
4.3.4 Ngram and Pattern Features
While HMM and LSA features help combat spar-sity in the predictive model, they may ignore the strong signal from a few expressions that are par-ticularly important for a domain. By soliciting ad-vice from domain experts, we selected important unigrams, bigrams, and trigrams for each module, and created features that count each of these. Like-wise, we selected important two-word and
three-word sets, which we callloose patterns, that weakly
indicate that a student understood the problem, if they all occur in the same response but not neces-sarily near one another. Again, these words were se-lected as a result of combination of empirical obser-vations and expert domain knowledge from design-ers. For instance, if a response contains the three words “temperature,” “pressure,” and “because,” it would match one of these loose patterns. For each pattern, we create a feature to count the number of matches in a response.
The selected patterns and ngrams both consist of three kinds of words: ones that indicate types of
measurable phenomena or properties (e.g.,
“temper-ature”), locations (e.g., “outside”), or causal or
com-parative words (e.g., “causes,” “higher,” “than,” or
“decrease”). Because the responses discuss numer-ical observations like temperature and pressure val-ues, we also allow a wildcard for matching any num-ber as part of the loose patterns.
4.3.5 Semantic Features
We use the Senna1 semantic role labeling (SRL)
system (Collobert et al., 2011) to automatically iden-tify predicate-argument relationships in the freeform responses. In general, the SRL system is only able
to identify predicate-argument structures in well-crafted sentences, which on its own is a good indi-cator that the student will do well in the evaluation.
In addition, we extractsemantic features(SFs) that
count how often certain predicate-argument struc-tures appear which are indicative of a good answer:
SF1 Count how often the freeform response
con-tains any predicate.
SF2 Count how often the response contains
predi-cates that involve causality, such as “causes” or change-of-value predicates like “increase.”
SF3 Count how often measurement words (e.g.,
temperature, pressure) appear as arguments to any predicate.
SF4 Count how often measurement words appear as
arguments to the predicates related to causality.
4.4 Feature Selection
We perform feature selection using a correlation-based technique that tries to identify maximally-relevant and minimally-redundant features (Hall, 1998; Deng and Moore, 1998). The algorithm eval-uates the value of a subset of features by considering the individual correlation between each feature and the gold standard, as well as the correlation between features. We use the default parameter settings for feature selection, as specified in Weka.
5 Experiments
5.1 Experimental Setup
We use a dataset collected by the SAVE Science project, consisting of the world data, freeform re-sponses, and quiz answers from public middle-school students in a major urban area of the United States. 120 students completed the Weather Trou-ble module, and 184 students completed Basket-ball. After manually correcting spelling errors in the freeform responses, we extracted features as de-scribed above.
Following Wang et al. (2008), we evaluate our re-gression models using Pearson correlation between the predicted outcome and the gold standard
out-come. Four different gold standards are
consid-ered for each module: manually-assigned grades for
the freeform text, and three versions of the num-ber of correctly-answered quiz questions (contextu-alized only, non-contextu(contextu-alized only, and all). We
use aχ2 test with a threshold ofp < 0.05 to
deter-mine statistical significance. We train and test mod-els using 10-fold cross-validation to reduce variabil-ity, and the results are averaged over the folds.
We evaluate several variants of our system, in-cluding a World variant that only includes features from the world data; an NLP variant that only in-cludes features from the freeform responses; and a combined World+NLP variant that includes all fea-tures before feature selection is performed.
Our evaluation compares against the essay grad-ing technique by Wang et al. Like ours, their sys-tem uses RBF-SVM regression with default param-eter settings as implemented in Weka, and like ours the system is trained on student texts proposing so-lutions to a science problem (in their case, a high school chemistry problem). The system is trained on human judgments of the quality of the student answers. The major difference between our tech-nique and theirs lies in the representation of the data; Wang et al. use two types of features: unigrams, and bigrams that occur at least five times during train-ing. In our implementation of their technique, we use a lower threshold for bigrams — they must oc-cur at least twice. This is because we have less text to work with, and the higher threshold yields too few bigrams. Using the lower threshold improved performance slightly, so we report only those results below.
5.2 Results and Discussion
The full system for automatic grading is accurate, across both worlds and all gold standards. Figure 3 shows the results of predicting human judgments of the freeform responses, where the World+NLP system achieves a correlation of 0.58 for Basket-ball and 0.44 for Weather Trouble. The same sys-tem achieves 0.55 and 0.54 on the World ques-tions of Basketball and Weather Trouble, respec-tively (Figures 4 and 5). Our best models are sta-tistically significantly different from the Wang et al. model (for predicting contextualized questions for
basketball: p = .009, χ2 = 6.87162; for grading
freeform responses: p ≈ 0, χ2 = 14.21725).
0.26
0.37
0.58 0.58
0.15 0.20
0.43 0.44
0.0 0.1 0.2 0.3 0.4 0.5 0.6 0.7
World Wang et al. NLP World+NLP
Cor rela tion Coe ffic ien t
Correlation: Predicted vs Human Rubric Scores
Basketball
[image:8.612.75.544.52.177.2]Weather
Figure 3: Our NLP features dramatically improve predic-tion over the Wang et al. model for grading freeform sci-ence essays, by a margin of 0.21 on Basketball and 0.23 on Weather Trouble.
0.33 0.34
0.45
0.55
0.09 0.12
0.34 0.40 0.20 0.33 0.40 0.46 0 0.1 0.2 0.3 0.4 0.5 0.6
Wang et al. World NLP World+NLP
Cor rela tion Coe ffic ien
t of Basketball Quiz Answers Automatic Grading
Contextualized Non-contextualized All
Figure 4: The World+NLP model outperforms both World and NLP, and substantially outperforms the Wang et al. system.
non-contextualized and all questions — were
some-what lower, but still statistically significant (p =
.002, χ2= 10.05986).
The language features are currently the major fac-tor in the predictive models for automated grad-ing. The NLP model substantially outperforms both the simpler Wang et al. model and the World-only model in predicting quiz answers for both worlds. It achieves correlations that are statistically signifi-cantly different from the baseline, for all gold stan-dards and both worlds.
The story in the case of grading freeform essays is similar. Our NLP model beats the Wang et al. model and the World-only model. Our full model World+NLP, however, outperforms the NLP model by only a small fraction. Also, the Wang et al. model performs slightly better than the World-only model on freeform responses. For Basketball, the correla-tion coefficient of their model is greater by 0.11 and for Weather by 0.05. We believe that the NLP-based
0.13
0.06
0.53 0.54
0.00 0.06
0.46
0.30
0.10 0.12
0.38 0.41
-0.1 0 0.1 0.2 0.3 0.4 0.5 0.6
Wang et al. World NLP World+NLP
Cor rel at ion Coe ffi cie n t Automatic Grading of Weather Trouble Quiz Answers
Contextualized Non-contextualized All
Figure 5: The NLP model substantially outperforms World and Wang et al. on predicting quiz questions for Weather Trouble, and the combined World+NLP model achieves a 0.54 correlation for contextualized questions.
models, including Wang et al.’s, are outperforming the World model because the current representation of the World data fails to capture all of the pertinent information from students’ behavior in the virtual environments. Our plans for future work include the development of features that can capture temporal patterns in student activity.
Each type of language feature appears to pro-vide a beneficial and complementary source of ev-idence. We tested the model using only individual subsets of the NLP features, such as HMM features only, LSA features only, ngrams and loose patterns only, and features from semantic role labeling only. On their own, each set of features provides only a small improvement over the mean predictor. When combined with the world features, each subset of the NLP features again provides only a small im-provement over the World-only model. For exam-ple, for predicting Basketball world quiz questions,
World features achiever = 0.34, World+HMM and
[image:8.612.69.302.247.360.2]for developing grading systems for science essays is therefore to construct a large number of possible features using a variety of techniques, and then train a model for a particular task and gold standard. In-cluding significantly more varieties of features, per-haps from additional kinds of language models or NLP pipeline tools, is an important future direction for further improving the grading accuracy.
While the accuracies of the models for contextu-alized and non-contextucontextu-alized questions are broadly similar, the models themselves are not. For the con-textualized questions, 4 important world behavior features were deemed important and non-redundant by the feature selection algorithm: the number of distinct collisions, the number of people collided with, the number of distinct objects (basketballs or balloons) whose pressure was measured, and the number of distinct temperature measurements that were recorded into clipboards. The essential task in this virtual world is to discover that a decrease in the temperature of several gas systems (basket-balls and balloons filled with air) is causing their
pressure to decrease. The model for the
contex-tualized questions thus includes variables that are highly relevant to a student’s understanding of the core problem in the world, which in turn indicates that automated data mining techniques are capable of identifying when students are learning to prac-tice the scientific method, by observing student be-havior. On the other hand, the model for the non-contextualized questions includes only 2 world fea-tures: The number of collisions made and number of different objects whose circumference was mea-sured. The first one is an indicator of the activity level of a student and the second variable is an indi-cator for whether the student has identified the prob-lem (the basketballs are not bouncing because they are deflated), but not for the underlying cause of the problem (the outside temperature causes a drop in pressure, which causes the basketball circumfer-ence to decrease). Thus the model that predicts non-contextualized questions very accurately has little information about whether the student understood the core problem of the world or not; instead, it has information about whether the student is active in the world. These observations lend some support to the criticism that the standardized tests are not prop-erly assessing inquiry.
Performance on the Weather Trouble module is consistently lower than on Basketball. In part, this reflects the increased difficulty of this world; human
inter-annotator agreement is a bit lower (κ = 0.8
vs. 0.95 on Basketball). However, another large part of the difference is that the world features pro-vide far less information in Weather Trouble — the World-only model has less than half the correlation on Weather than on Basketball, for all quiz ques-tion types. We suspect that the cause is the nature of the task on the Weather Trouble world, where temporal information plays a bigger role as measure-ments of air pressure and wind direction may change over time. Investigating world features that can dis-tinguish different patterns of student behavior over time is an important area for further investigation.
6 Conclusion
Our automated grader uses a wide variety of NLP pipeline tools to produce features for students’
es-says on the answers to scientific mysteries. The
grader achieves significant correlation with human judges and multiple choice quiz evaluations, sub-stantially outperforming a simpler grader from prior work. The findings of this research suggest that au-thentic assessments of scientific inquiry through vir-tual environments can be graded purely automati-cally, like high stakes multiple choice tests. Ongoing work on SAVE Science is investigating the differ-ences in how students respond to standard multiple-choice tests and tests based on virtual environments. But the contextualized assessments from SAVE Sci-ence provide evaluation of scientific inquiry that multiple choice tests currently do not, and they can now be graded just as cheaply.
Acknowledgments
References
J. T. Behrens, D. Frezzo, R. Mislevy, M. Kroopnick, and D. Wise. 2007. Structural, Functional, and Semiotic Symmetries in Simulation-based Games and Assess-ments. In E. Baker, J. Dickieson, W. Wulfeck, and H. O’Neil, editors,Assessment of Problem Solving Us-ing Simulations. Lawrence Erlbaum Associates. J. S. Brown, A. Collins, , and P. Duguid. 1989. Situated
cognition and the culture of learning. Educational Re-searcher, 18(1):32–41.
J. Burstein, C. Leacock, and R. Swartz. 2001. Auto-mated evaluation of essays and short answers. In5th International Computer Assisted Assessment Confer-ence. Loughborough University.
S.-N. Chang and M.-H. Chiu. 2005. The development of authentic assessment to investigate ninth graders sci-entific literacy: In the case of scisci-entific cognition con-cerning the concepts of chemistry and physics. Inter-national Journal of Science and Mathematics Educa-tion, 3:117–140.
J. Clarke-Midura. 2010. The Role of Technology in Science Assessments. Better: Evidence-based Edu-cation, 3(1).
R. Collobert, J. Weston, L. Bottou, M. Karlen, K. Kavukcuoglu, and P. Kuksa. 2011. Natural lan-guage processing (almost) from scratch. Journal of Machine Learning Research, 12:2493–2537.
Kan Deng and Andrew Moore. 1998. On the greediness of feature selection algorithms. InProc. International Conference on Machine Learning (ICML), June 1998. Mark Hall, Eibe Frank, Geoffrey Holmes, Bernhard Pfahringer, Peter Reutemann, and Ian H. Witten. 2009. The WEKA Data Mining Software: An Update.
SIGKDD Explorations, 11(1).
M. A. Hall. 1998. Correlation-based feature subset selection for machine learning. In Hamilton, New Zealand.
D. Higgins, J. Burstein, D. Marcu, and C. Gentile. 2004. Evaluating multiple aspects of coherence in student essays. InProceedings of the annual meeting of the North American Chapter of the Association for Com-putational Linguistics, Boston, MA.
Fei Huang, Alexander Yates, Arun Ahuja, and Doug Downey. 2011. Language Models as Representations for Weakly Supervised NLP Tasks. InConference on Computational Natural Language Learning (CoNLL). Mark D. Kernighan, Kenneth W. Church, and William A. Gale. 1990. A spelling correction program based on a noisy channel model. In Proceedings of the 13th Conference on Computational Linguistics, pages 205– 210.
D.J. Ketelhut, B. Nelson, and C. Schifter. 2009. Virtual Environments for Situated Science Assessment. In
Proceedings of the International Conference on Cog-nition and Exploratory Learning in the Digital Age, pages 507–508.
D.J. Ketelhut, B. Nelson, C. Schifter, and Y. Kim. 2010. Using Immersive Virtual Environments to Assess Sci-ence Content Understanding: The Impact of Context. In D. G. Kinshuk, J. M. Sampson, P. Spector, D. Isaas, Ifenthaler, and R. Vasiu, editors, Proceedings of the IADIS International Conference on Cognition and Ex-ploratory Learning in the Digital Age (CELDA), pages 227–230.
Diane Jass Ketelhut, Alexander Yates, Avirup Sil, and Michael Timms. 2012. Applying Educational Data mining in E-learning environments. InSection within the New Measurement Paradigm Report, p 47-52.
T.K. Landauer and S.T. Dumais. 1997. A solution to Platos problem: The latent semantic analysis theory of acquisition, induction, and representation of knowl-edge. InPsychological Review, 104.
C. Leacock and M. Chodorow. 2003. C-rater: Auto-mated scoring of short-answer questions. In Comput-ers and the Humanities, 37(4):389405.
K.I. Malatesta, P. Wiemer-Hastings, and J. Robertson. 2002. Beyond the short answer question with research methods tutor. InProceedings of the Intelligent Tutor-ing Systems Conference.
Chris Manning and Hinrich Sch¨utze. 1999. Foundations of Statistical Natural Language Processings. MIT Press.
T. Mitchell, T. Russell, P. Broomhead, and N. Aldridge. 2002. Towards robust computerised marking of free-text responses. InProceedings of the 6th International Computer Assisted Assessment (CAA) Conference.
Michael Mohler and Rada Mihalcea. 2009. Text-to-text semantic similarity for automatic short answer grad-ing. InProceedings of the 12th Conference of the Eu-ropean Chapter of the Association for Computational Linguistics, EACL.
National Research Council. 2005. America’s Lab Re-port: Investigations in High School Science. National Academies Press.
T. Pang-Ning, M. Steinbach, and V. Kumar. 2006. Intro-duction to Data Mining. Pearson Addison-Wesley. S.G. Pulman and J.Z. Sukkarieh. 2005. Automatic
short answer marking. InProceedings of the Second workshop on Building Educational Applications Using NLP.
Lawrence R. Rabiner. 1989. A tutorial on hidden Markov models and selected applications in speech recognition.Proceedings of the IEEE, 77(2):257–285. M.K. Singley and H.L. Taft. 1995. Open-ended approaches to science assessment using computers.
A. Smola and B. Sch¨olkopf. 1998. A tutorial on support vector regression. Technical report, Royal Holloway College, University of London, UK.
Mark Steyvers and Tom Griffiths. 2006. Probabilistic topic models. In T. Landauer, D. McNamara, S. Den-nis, and W. Kintsch, editors, Latent Semantic Analy-sis: A Road to Meaning, pages 427–448. Lawrence Erlbaum Associates.
J. Sukkarieh and S. Stoyanchev. 2009. Automating model building in C-rater. InProceedings of the 2009 Workshop on Applied Textual Inference, pages 6169, Suntec, Singapore, August.
J.Z. Sukkarieh, S.G. Pulman, and N. Raikes. 2004. Auto-marking 2: An update on the ucles-oxford university research into using computational linguistics to score short, free text responses. InInternational Association of Educational Assessment, Philadephia.
H-C. Wang, C-Y. Chang, and T-Y Li. 2008. Assessing creative problem solving with automated text grading. InComputers and Education.
P. Wiemer-Hastings, K. Wiemer-Hastings, and A. Graesser. 1999. Improving an intelligent tu-tors comprehension of students with latent semantic analysis. InArtificial Intelligence in Education, pages 535542.