User-Driven Development of Text Mining Resources for Cancer Risk
Assessment
Lin Sun, Anna Korhonen University of Cambridge
Computer Laboratory 15 JJ Thomson Avenue Cambridge CB3 0GD, UK ls418,[email protected]
Ilona Silins, Ulla Stenius Institute of Environmental Medicine
Karolinska Institutet S-17177, Stockholm
Sweden
ilona.silins,[email protected]
Abstract
One of the most neglected areas of biomed-ical Text Mining (TM) is the development of systems based on carefully assessed user needs. We investigate the needs of an im-portant task yet to be tackled by TM — Can-cer Risk Assessment (CRA) — and take the first step towards the development of TM for the task: identifying and organizing the sci-entific evidence required for CRA in a taxon-omy. The taxonomy is based on expert annota-tion of 1297 MEDLINE abstracts. We report promising results with inter-annotator agree-ment tests and automatic classification experi-ments, and a user test which demonstrates that the resources we have built are well-defined, accurate, and applicable to a real-world CRA scenario. We discuss extending and refining the taxonomy further via manual and machine learning approaches, and the subsequent steps required to develop TM for the needs of CRA.
1 Introduction
Biomedical Text Mining (TM) has become increas-ingly popular due to the pressing need to provide access to the tremendous body of texts available in biomedical sciences. Considerable progress has been made in the development of basic resources (e.g. ontologies, annotated corpora) and techniques (e.g. Information Retrieval (IR), Information Ex-traction (IE)) in this area, and research has began to focus on increasingly challenging tasks, e.g. sum-marization and the discovery of novel information in biomedical literature (Hunter and Cohen 2006, Ana-niadou et al. 2006, Zweigenbaum et al. 2007).
In recent past, there has been an increasing de-mand for research which is driven by actual user
needs rather than technical developments (Zweigen-baum et al. 2007). Shared tasks (e.g. BioCreative and the TREC Genomics track) targeting the work-flow of biomedical researchers have appeared along with studies exploring the TM needs of specific tasks (Karamanis et al. 2008, Demaine et al. 2006). How-ever, the understanding of user needs is still one of the neglected areas of BIO-TM, and further user-centered evaluations and systems grounded in real-life tasks are required to determine which tools and services are useful (Cohen et al. 2008).
We investigate the user needs of a challenging task yet to be tackled by TM but identified as an important potential application for it (Lewin et al. 2008): Cancer Risk Assessment (CRA). Over the past years, CRA has become increasingly important as the link between environmental chemicals and cancer has become evident. It involves examining published evidence to determine the relationship be-tween exposure to a chemical and the likelihood of developing cancer from that exposure (EPA, 2005). Performed manually by experts in health related in-stitutions worldwide, CRA requires searching, lo-cating and interpreting information in biomedical journal articles. It can be extremely time-consuming because the data for a single carcinogen may be scat-tered across thousands of articles.
Given the exponentially growing volume of biomedical literature and the rapid development of molecular biology techniques, the task is now get-ting too challenging to manage via manual means. From the perspective of BIO-TM, CRA is an excel-lent example of real-world task which could greatly benefit from a dedicated TM tool. However, the de-velopment of a truly useful tool requires careful in-vestigation of risk assessors needs.
This paper reports our investigation of the user needs of CRA and the creation of basic TM re-sources for the task. Expanding on our preliminary experiments (Lewin et al. 2008), we present a taxon-omy which specifies the scientific evidence needed for CRA at the level of detail required for TM. The taxonomy is based on expert annotation of a corpus of 1297 MEDLINE abstracts. We report promis-ing results with inter-annotator agreement tests, au-tomatic classification of corpus data into taxonomy classes, and a user test in a near real-world CRA scenario which shows that the taxonomy is highly accurate and useful for practical CRA. We discuss refining and extending it further via manual and ma-chine learning approaches, and the subsequent steps required to develop TM for the needs of CRA.
2 User Needs of Cancer Risk Assessment
We interviewed 14 experienced risk assessors work-ing for a number of authorities in Sweden1 asking a range of questions related to different aspects of their work. The risk assessors described the follow-ing steps of CRA: (1) identifyfollow-ing the journal articles relevant for CRA of the chemical in question, (2) identifying the scientific evidence in these articles which help to determine whether/how the chemical causes cancer, (3) classifying and analysing the re-sulting (partly conflicting) evidence to build the tox-icological profile for the chemical, and (4) prepar-ing the risk assessment report. These steps are con-ducted manually, relying only on standard literature search engines (e.g. PubMed) and word processors.
The average time required for CRA of a single chemical was reported to be two years when done (as usual) on a part time basis. Risk assessors were unanimous about the need to increase productivity to meet the current CRA demand. They reported that locating and classifying the scientific evidence in literature is the most time consuming part of their work and that a tool capable of assisting it and ensur-ing that all the potentially relevant evidence is found would be particularly helpful.
It became clear that a prerequisite for the devel-opment of such a tool would be an extensive spec-ification of the scientific evidence used for CRA.
1Institute of Environmental Medicine at Karolinska
Insti-tutet, Swedish Chemical Inspectorate, Scientific Committee on Occupational Exposure Limits (EU), Swedish Criteria Group.
This evidence — which forms the basis of all the subsequent steps of CRA — is described in the guideline documents of major international CRA agencies, e.g. European Chemicals Agency (ECHA, 2008) and the United States Environmental Protec-tion Agency (EPA, 2005). However, although these documents constitute the main reference material in CRA, they cover the main types of evidence only, do not specify the evidence at the level of detail required for comprehensive data gathering, and are not updated regularly (i.e. do not incorporate the lat-est developments in biomedical sciences). The risk assessors admitted that rather than relying on these documents, they rely on their experience and expert knowledge when looking for the evidence. We de-cided that our starting point should be to compose a more adequate specification of the scientific evi-dence needed for CRA.
3 Cancer Risk Assessment Taxonomy
We recruited three experienced risk assessors to help construct the resources described in sections below: (i) a representative corpus of CRA literature for parts of hazard identification (i.e. the assessment of whether a chemical is capable of causing cancer), (ii) a tool for expert annotation of the corpus, (iii) an annotated corpus, and (iv) a taxonomy which classi-fies and organizes the scientific evidence discovered in the corpus.
3.1 CRA corpus
Various human, animal (in vivo), cellular (in vitro) and other mechanistic data provide evidence for haz-ard identification and the assessment of the Mode of Action (MOA) (i.e. the sequence of key events that result in cancer formation, e.g. mutagenesis and in-creased cell proliferation) in CRA. The experts se-lected eight chemicals which are (i) well-researched using a range of scientific tests and (ii) represent the two most frequently used MOAs – genotoxic and non-genotoxic2. 15 journals were identified which are used frequently for CRA and jointly provide a good coverage of relevant scientific evidence (e.g. Cancer Research, Chemico-biological Interaction, Mutagenesis, Toxicological Sciences). From these
2Chemicals acting by a genotoxic MOA interact with DNA,
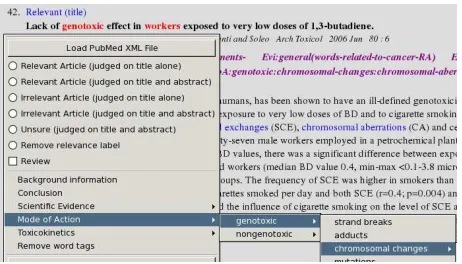
Figure 1: Screenshot of the annotation tool
journals, all the PubMed abstracts from 1998-2008 which include one of the 8 chemicals were down-loaded. The resulting corpus of 1297 abstracts is distributed per chemical as shown in Table 1.
3.2 Annotation tool
Risk assessors typically (i) read each abstract re-trieved by PubMed to determine its relevance for CRA, and (ii) classify each relevant abstract based on the type of evidence it provides for CRA. We ex-tended the tool designed for expert annotation of ab-stracts in our earlier work (Lewin et al. 2008) so that imitates this process as closely as possible.
The tool provides two types of functionality. The first enables the experts to classify abstracts as rele-vant, irrelevant or unsure. The second enables them to annotate such keywords (words or phrases) in ab-stracts and their titles which indicate the scientific evidence relevant for the task. Keyword annotation was chosen because the experts found it intuitive, it did not require linguistic training, and it specifies the scientific evidence more precisely than larger spans of text.
Initially a very shallow taxonomy (including only human, animal, and cellular data) and the two types of MOA was integrated inside the tool. This was gradually extended as the annotation progressed. The tool permits annotating any number of relevant keywords in the abstracts, attaching them to any class in the taxonomy, and classifying the same text in more than one way. It was implemented inside the familiar Mozilla Firefox browser using its extension facility. A screenshot illustrating the tool is provided in Figure 1.
3.3 Annotation
Given a set of initial guidelines agreed by the ex-perts, one of the experts annotated a subset of the corpus, the other two evaluated the result, disagree-ments were then discussed, and the guidelines were improved where needed. This process (crucial for maintaining quality) was repeated several times. The guidelines described below are the final result of this work.
3.3.1 Relevance annotation
An abstract is classified as (i) relevant when it (or its title) contains evidence relevant for CRA and (ii) irrelevant when it (or its title) contains no evidence or contains ”negative” evidence (e.g. diseases or endpoints unrelated to cancer). Abstracts containing vague, conflicting or complex evidence (e.g. stud-ies on chemicals in complex mixtures) or evidence whose association with cancer is currently unclear were dealt on case by case basis. All the potentially relevant abstracts were included for further assess-ment as not to lose data valuable for CRA.
The experts annotated the 1297 abstracts in the corpus. 89.4% were classified as relevant, 10.1% as irrelevant, and 0.5% as unsure. We used the Kappa statistics (Cohen 1960) to measure inter-annotator agreement on unseen data which two experts an-notated independently. 208 abstracts were selected randomly from the 15 journals and from 16 jour-nals likely to be irrelevant for CRA. The latter were included to make the task harder as the proportion of relevant abstracts was high in our corpus. Our Kappa result is 0.68 — a figure which indicates sub-stantial agreement (Landis and G.Koch 1977).
The experts disagreed on 24 (11.5% of the) ab-stracts. Half of the disagreements are due to one of the annotators failing to notice relevant evidence. Such cases are likely to decrease when annotators gain more experience. The other half are caused by vague or conflicting evidence. Many of these could be addressed by further development of guidelines.
3.3.2 Keyword annotation
non-Chemical Retrieved Relevant 1,3-butadiene 195 187 phenobarbital 270 240 diethylnitrosamine 221 214 diethylstilbestrol 145 110 benzoapyrene 201 192
fumonisin 80 70
chloroform 96 84
styrene 162 132
[image:4.612.95.281.53.176.2]Total 1297 1164
Table 1: Total of abstracts per chemical
genotoxic), and relevant parts of toxicokinetics (e.g. metabolic activation). The experts annotated the keywords which they considered as the most impor-tant and which jointly identify the types of scientific data offered by the abstract. They focussed on new (rather than previously published) data on the chem-ical in question.
All the 1164 abstracts deemed relevant were an-notated. A total of 1742 unique keywords were identified, both simple nouns and complex nomi-nals / phrases. Figure 1 shows an example of an annotated abstract where the keyword chromoso-mal aberrations is identified as evidence for geno-toxic MOA. Since the experts were not required to annotate every relevant keyword, calculating inter-annotator agreement was not meaningful. However, the keyword annotation was evaluated jointly with taxonomy classification (the following section).
3.4 The taxonomy and the resulting corpus
During keyword annotation, the initial taxonomy was extended and refined with new classes and class members. The resulting taxonomy relies solely on expert knowledge. Experts were merely advised on the main principles of taxonomy creation: the classes should be conceptually coherent and their hi-erarchical organization should be in terms of coher-ent sub- and superordinate relations.
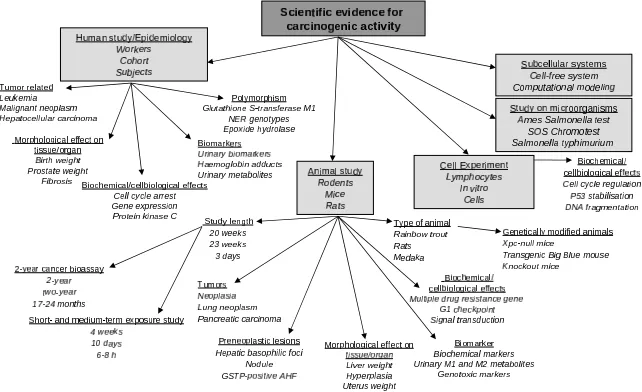
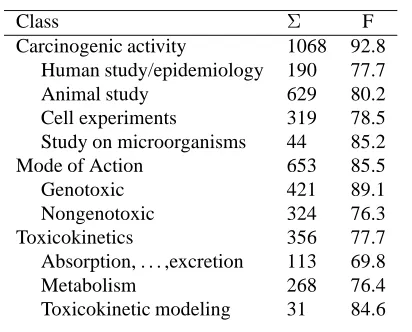
The taxonomy contains three top level classes: 1) Carcinogenic activity (CA), 2) Mode of Action (MOA) and 3) Toxicokinetics (TOX). 1) and 2) are organized by TYPE-OF relations (leukemia is a type of carcinogenic evidence) and 3) by PART-OF rela-tions (biodegradation is a part of Metabolism). Each top level class divides into sub-classes. Figure 2 shows CA taxonomy with three keyword examples per class. The taxonomy has 48 classes in total; half
of them under CA. Table 6 shows the total number of abstracts and keywords per class: 82.4% of the abstracts include keywords for CA, and 50.3% and 28.1% for MOA and TOX, respectively.
We calculated inter-annotator agreement for as-signing abstracts to taxonomy classes. For each of the 8 chemicals, 10 abstracts were randomly cho-sen from the 15 journals. The average agreement between two annotators is the highest with CA and MOA (78%) and the lowest with TOX (62%). The overall agreement is 76%. This result is good, par-ticularly considering the high number of classes and the chance agreement of 1.5%. The disagreements are mostly due to one of the experts annotating as many keywords as possible, and the other one an-notating only the ones that classify each abstract as precisely as possible. This was not a serious prob-lem for us, but it demonstrates the importance of de-tailed guidelines. Also, some of the classes were too imprecise to yield unique distinctions. Future work should focus on refining them further.
4 Automatic classification
To examine whether the classification created by ex-perts provides a good representation of the corpus data and is machine learnable, we conducted a se-ries of abstract classification experiments.
4.1 Methods
4.1.1 Feature extraction
The first step of text categorization (TC) is to transform documents into a feature vector represen-tation. We experimented with two document rep-resentation techniques. The first one is the sim-ple ’bag of words’ approach (BOW) which consid-ers each word in the document as a separate feature. BOW was evaluated using three methods which have proved useful in previous TC work: (i) stemming (using the Porter (1980) stemmer) which removes affixes from words, (ii) the TFIDF weighting (Kib-riya et al. 2004), and (iii) stop word removal.
re-Figure 2: Taxonomy of Carcinogenic Activity
quire domain tuning for optimal performance. Be-cause BOS generates substrings with fixed lengthp, a word shorter thanp−2can get obscured by its con-text3. For example, ‘mice‘ would be transformed to ’ mice a’, ’ mice b’, . . . , which is less informative than the original word form. Therefore, we enriched BOS features with word forms shorter thanp−2.
4.1.2 Feature selection
We employed two feature selection methods for dimensionality reduction. The first is Information Gain (IG) which has proved useful in TC (Yang and Pedersen 1997). Given a feature’s distribu-tion X and class label distribution Y, IG(X) = H(Y)−H(Y|X),H(X)is the entropy ofX. The second methodf scoreoptimises the number of fea-tures (N). Features are first ranked using the simple f scorecriterion (Chen and Lin 2006), andN is se-lected based on the performance of the SVM classi-fier using theN features.
4.1.3 Classification
Three classifiers were used: Naive Multino-mial Bayesian (NMB), Complement Naive Bayesian (CNB) (Rennie and Karger 2003) and Linear Sup-port Vector Machines (L-SVM) (Vapnik 1995).
NMB is a widely used classifier in TC (Kib-riya et al. 2004). It selects the class C with the maximum probability given the document d: argmaxc P r(C)Qw∈dP r(X = w|C). P r(C) can
3Minus 2 because of space characters.
be estimated from the frequency of documents inC. P r(X=w|C)is estimated as the fraction of tokens in documents of classCthat containw.
CNB extends NMB by addressing the problems it has e.g. with imbalanced data and weight magnitude error. The class c of a document is: argmaxc[logp(θc)−PifilogNNci˜c˜++ααi]. N˜ci is the
number of times termioccurs in classes other than c. α andαi are the smoothing parameters. p(θc)is
the prior distribution of classc.
L-SVM is the basic type of SVM which pro-duces a hyperplane that separates two-class samples with a maximum margin. It handles high dimen-sional data efficiently, and has shown to perform well in TC (Yang and Liu 1999). Given the data set X = (x1, y1), . . . ,(xn, yn) yi ∈ {−1,+1},
L-SVM requires a solution w to the following un-constrained optimisation problem: min(12wTw +
CPni=1max(1 − yiwTxi,0)2. Cost parameter C
was estimated within range 22,. . . , 25 on training data using cross validation. The C of the posi-tive class was weighted by class population ratio r= negative populationpositive population.
4.1.4 Evaluation
We used the standard measures of recall (R), pre-cision (P) and F measure (F) for evaluation. These are defined as follows:
R=T PT P+F N P = T PT P+F P F =2×RR+×PP
[image:5.612.137.458.56.252.2]P+/N: positive/negative population TP: truth positive; FN: false negative, FP: false positive
4.2 Experimental evaluation
4.2.1 Data
Our data was the expert annotated CRA corpus.
4.2.2 Document preprocessing
We first evaluated the BOW preprocessing tech-nique with and without the use of (i) the Porter (1980) stemmer, (ii) TFIDF, (iii) stop word removal, and (iv) their combinations. The evaluation was done in the context of the binary relevance classifica-tion of abstracts (not in the context of the main tax-onomic classification task to avoid overfitting pre-processing techniques to the taxonomy). Only (iii) improved all the classifiers and was thus adopted for the main experiments. The poor performance of (i) demonstrates that a standard stemmer is not optimal for our data. As highlighted by (Han et al. 2006, Wang et al. 2008), semantically related bio-logical terms sharing the same stem are not always reducible to the stem form.
4.2.3 Feature selection
We evaluated the feature selection methods on two taxonomy classes: the most balanced class ‘An-imal study‘ (positive/negative 1:1.4) and an imbal-anced class ‘Adducts‘ (positive/negative 1:6.5). IG was used for the fixed N setting and fscore for the dynamic N setting. Each combination of classifiers (NMB/CNB/SVM), document representations (BOW, BOS) and settings for N (dynamic, . . . , 83098) was evaluated. The results show that the dynamic setting yields consistent improvement on all the setups (al-though the impact on SVM’s is not big). Also the optimal N varies by the data and the classifier. Thus, we used the dynamic feature selection in the taxo-nomic classification.
4.2.4 Taxonomic classification
Experimental setup We ran two sets of experi-ments on the corpus, using 1) BOW and 2) BOS for feature extraction. Without feature selection, BOW had c. 9000 features and BOS c. 83000. Features were selected using fscore. For each class with more than 20 abstracts (37 in total)4, three ”one
4
The classes with less than 20 abstracts may have less than 2 positive abstracts in each fold of 10 fold CV, which is not
Method Feature Set P R F NMB BOW 0.59 0.75 0.66 NMB BOS 0.62 0.82 0.70 CNB BOW 0.52 0.74 0.60 CNB BOS 0.57 0.76 0.64 SVM BOW 0.68 0.76 0.71 SVM BOS 0.71 0.77 0.74
Table 2: Performance of classifiers with BOS/BOW
[image:6.612.325.528.52.289.2]Class Method P R F CA NMB 0.94 0.89 0.91 CA CNB 0.92 0.94 0.93 CA SVM 0.93 0.93 0.93 MOA NMB 0.88 0.81 0.84 MOA CNB 0.84 0.82 0.83 MOA SVM 0.92 0.80 0.86 TOX NMB 0.66 0.83 0.74 TOX CNB 0.70 0.80 0.75 TOX SVM 0.76 0.79 0.78
Table 3: Result for the top level classes
against other” classifiers (NMB, CNB and L-SVM) were trained and tested using 10-fold cross valida-tion.
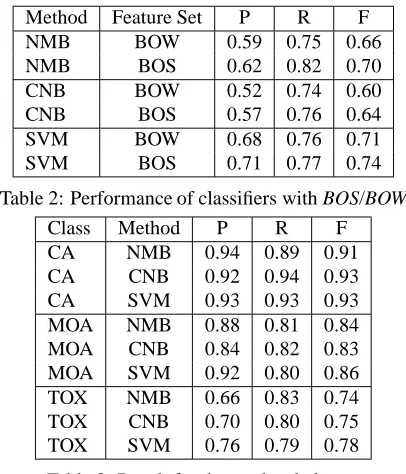
Results Table 2 shows the average performance for the whole taxonomy. The performance of BOS is better than that of BOW according to all the three measures. On average, BOS outperforms BOW by 4% in P and F, and 3% in R. SVM yields the best overall P and F (0.71 and 0.74) with BOS. Surpris-ingly, NMB outperforms CNB with all the settings. NMB yields the best overall R with BOS (0.82) but its P is notably lower than that of SVM.
Table 3 shows the average P, R and F for the top level classes using the best performing feature set BOS with the three classifiers. CA has the best F (0.93). Its positive population is the highest (posi-tive/negative: 5:1). TOX with a lower positive pop-ulation (1:2.6) has still good F (0.78). R and P are balanced with an average difference of 0.06.
Table 4 shows the distribution of F across the taxonomy. There is a clear correlation between
representative for the class population.
No. of abstracts(f) Classes F Random
f >300 9 0.80 0.38
100< f ≤300 12 0.73 0.13
20< f ≤100 16 0.68 0.04
frequency and performance: the average F de-creases with descending frequency range, revealing increased classification difficulty. Classes with more than 300 abstracts have the highest average F (0.80 with standard deviation (SD) 0.08). Classes with 20-100 abstracts have the average F 0.68 (SD 0.11), which is lower but still fairly good. No class has F lower than 0.46, which is much higher than the av-erage random baseline of 0.11.
5 User Test
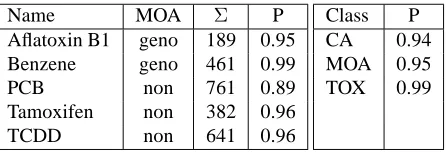
A user test was carried out to examine the practical usefulness of the automatic classification in a near real-world scenario. The L-SVM+BOS classifier was applied to the PubMed abstract data (from 1998-2008) of five unseen chemicals representing geno-toxic (geno) and non-genogeno-toxic (non) MOAs (see table 5). The results were displayed to two experts in a friendly web interface. The experts were in-vited to imagine that they have submitted a query to a system, the system has returned the classification of relevant abstracts for each chemical, and the task is to judge whether it is correct. The top 500 BOS features per class were shown to aid the judgement.
Results were evaluated using precision (P) (re-call could not be calculated as not all of the positive polulation was known). Table 5 shows the average P for chemicals and top level classes. The results are impressive: the only chemical with P lower than 0.90 is polychlorinated biphenyls (PCB). As PCB has a well-known neuro-behavioural effect, the data includes many abstracts irrelevant for CRA. Most other errors are due to the lack of training data for low frequency classes. For example, the CRA cor-pus had only 27 abstracts in ”DNA repair (damage)” class, while the new corpus has many abstracts on DNA damage some of which are irrelevant for CRA. The experts found the tool easy to use and felt that if such a tool was available to support real-world CRA, it could significantly increase their productiv-ity and also lead to more consistent and thorough CRA. Such a wide range of scientific evidence is dif-ficult to gather via manual means, and chemical car-cinogenesis is such a complex process that even the most experienced risk assessor is incapable of mem-orizing the full range of relevant evidence without the support of a thorough specification / taxonomy.
Name MOA Σ P
Aflatoxin B1 geno 189 0.95 Benzene geno 461 0.99
PCB non 761 0.89
Tamoxifen non 382 0.96 TCDD non 641 0.96
[image:7.612.317.540.53.129.2]Class P CA 0.94 MOA 0.95 TOX 0.99
Table 5: Chemicals and the results of the user test
6 Conclusion and Future Work
The results of our inter-annotator agreement tests, automatic classification experiments and the user test demonstrate that the taxonomy created by risk assessors is accurate, well-defined, and can be use-ful in a real-world CRA scenario. This is particu-larly encouraging considering that the taxonomy is based on biomedical annotation. As highlighted by (Kim et al. 2008), expert annotation is more chal-lenging and prone to inter-annotator disagreement than better-constrained linguistic annotation. We believe that we obtained promising results because we worked in collaboration with risk assessors and developed technology which imitates their current practices as closely as possible.
Most related work focuses on binary classifica-tion, e.g. BioCreative II had a subtask (Krallinger et al. 2008) on the relevance classification of ab-stracts for protein interactions. The few works that have attempted multi-classification include e.g. that of Aphinyanaphongs et al. (2005) who applied NMB, SVM and AdaBoost to classify abstracts of internal medicine into four categories, and that of Han et al. (2006) who used BOS and NMB/L-SVM to classify abstracts in five categories of protein post-translational modifications.
In the future, we plan to refine the taxonomy fur-ther by careful analysis of keyword types found in the data and the taxonomic relationships defined by experts. This will help to transform the taxonomy into a better-developed knowledge resource. We also need to extend the taxonomy. Although our results show that the current taxonomy provides a good basis for the classification of CRA literature, it is not comprehensive: more data is required espe-cially for low frequency classes, and the taxonomy needs to be extended to cover more specific MOA types (e.g. further subtypes of non-genotoxic chem-icals).
annota-Change in F ΣClasses Abstracts of class 20-100 100 - 200 200 - 1100 ∆F >1% 16 (43%) 75% 33% 8%
|∆F| ≤1% 15 (41%) 6% 44% 75%
[image:8.612.70.276.136.302.2]∆F <−1% 6 (16%) 19% 33% 17%
Table 6: F gain(∆F) of MeSH compared to BOS
Class Σ F
Carcinogenic activity 1068 92.8 Human study/epidemiology 190 77.7 Animal study 629 80.2 Cell experiments 319 78.5 Study on microorganisms 44 85.2 Mode of Action 653 85.5
Genotoxic 421 89.1
Nongenotoxic 324 76.3 Toxicokinetics 356 77.7 Absorption, . . . ,excretion 113 69.8
Metabolism 268 76.4
Toxicokinetic modeling 31 84.6
Table 7:Σabstracts and F of level 1,2 classes.
tion, supplementing it with additional information in knowledge resources and/or by automatic methods. One knowledge resource potentially useful is the Medical Subject Headings (MeSH) taxonomy (Nel-son et al. 2002) which classifies PubMed abstracts according to manually defined terms. We performed a small experiment to investigate the usefulness of MeSH for supplementing our current classification. MeSH terms were first retrieved for each abstract us-ing EFetch (NCBI 2005) and then appended to the BOS feature vector. Best features were then selected using fscore and classified using L-SVM. The fig-ures in table 6 show that the results improved sig-nificantly for 43% of the low frequency classes. Al-though this demonstrates the potential usefulness of additional resources, given the rapidly evolving na-ture of CRA data, the best approach long term is to develop technology for automatic updating of the taxonomy from literature. Given the basic resources we have constructed, the development of such tech-nology is now realistic and can be done using unsu-pervised or semi-suunsu-pervised machine learning tech-niques, e.g. (Cohen and Hersh 2005, Blaschko and Gretton 2009).
The automatic classification could be improved by the use of more sophisticated features extracted using NLP tools that have been tuned for biomedi-cal texts, such as parsers, e.g. (Tsuruoka et al. 2005),
and named entity recognizers, e.g. (Corbett et al. 2007), and exploiting resources such as the BioLex-ion (Sasaki et al. 2008).
Our long term goal is to develop a TM tool specifically designed for CRA. Some tools have re-cently been built to assist other critical activities of biomedicine (e.g. literature curation for genetics). A few of them have been evaluated for their practi-cal usefulness in a real-world scenario (Karamanis et al. 2008, Demaine et al. 2006). Such tools and evaluations act as an important proof of concept for biomedical TM and help to develop technology for the needs of practical applications.
According to the interviews we conducted (Sec-tion 2), a tool capable of identifying, ranking and classifying articles based on the evidence they con-tain, displaying the results to experts, and assisting also in subsequent steps of CRA would be particu-larly welcome. Such a tool, if developed in close collaboration with users, could significantly increase the productivity of CRA and enable risk assessors to concentrate on what they are best at: the expert judgement.
Acknowledgements Our work was funded by the Royal Society (UK), the Medical Research Council (G0601766) (UK) and the Swedish Council for Working Life and Social Research (Sweden). LS was supported by a Dorothy Hodgkin Postgraduate Award (UK). We would like to thank Ian Lewin for his assistance at the early stages of this work and for providing the first ver-sion of the annotation tool. We are also grateful to Johan Hogberg for supporting the annotation and the taxonomy construction work.
References
Sophia Ananiadou, Douglas B. Kell, and Jun ichi Tsujii. Text mining and its potential applications in systems biology. Trends in Biotechnology, 24(12), 2006.
Y. Aphinyanaphongs, I. Tsamardinos, A. Statnikov, D. Hardin, and C.F. Aliferis. Text categorization models for high-quality article retrieval in internal medicine. JAMIA, 12(2), 2005.
Matthew Blaschko and Arthur Gretton. Learning tax-onomies by dependence maximization. In 22rd NIPS, 2009.
Yi-Wei Chen and Chih-Jen Lin. Combining SVMs with various feature selection strategies. In Feature
extrac-tion, foundations and applications. 2006.
current work in biomedical text mining. Briefings in
Bioinformatics, 6(1), 2005.
Jacob Cohen. A coefficient of agreement for nominal scales. Educ. Psychol. Meas., 20(1), 1960.
K. Bretonnel Cohen, Hong Yu, Philip E. Bourne, and Lynette Hirschman. Translating biology:text mining tools that work. In PSB, 2008.
Peter Corbett, Colin Batchelor, and Simone Teufel. An-notation of chemical named entities. In Proceedings of
the ACL, 2007.
Jeffrey Demaine, Joel Martin, Lynn Wei, and Berry de Bruijn. Litminer: integration of library services within a bio-informatics application. Biomedical
Dig-ital Libraries, 3(1), 2006.
ECHA, 2008. Guidance on Information Requirements
and Chemical Safety Assessment. European Chemicals
Agency, 2008.
Bo Han, Zoran Obradovic, Zhang zhi Hu, Cathy H. Wu, and Slobodan Vucetic. Substring selection for biomed-ical document classification. Bioinformatics, 22, 2006.
Lawrence Hunter and K. Bretonnel Cohen. Biomedical language processing: What’s beyond pubmed? Mol
Cell, 21(5), 2006.
N. Karamanis, R. Seal, I. Lewin, P. McQuilton, A. Vla-chos, C. Gasperin, R. Drysdale, and T. Briscoe. Nat-ural language processing in aid of flybase curators.
BMC Bioinformatics, 9(1), 2008.
Ashraf M. Kibriya, Eibe Frank, Bernhard Pfahringer, and Geoffrey Holmes. Multinomial naive bayes for text categorization revisited. In Australian Conference on
AI, volume 3339, 2004.
Jin-Dong Kim, Tomoko Ohta, and Jun’ichi Tsujii. Cor-pus annotation for mining biomedical events from lter-ature. BMC Bioinformatics, 9, 2008.
Martin Krallinger, Florian Leitner, Carlos Rodriguez-Penagos, and Alfonso Valencia. Overview of the protein-protein interaction annotation extraction task of biocreative ii. Genome Biology, 2008.
J.Richard Landis and Gary G.Koch. The measurement of observer agreement for categorical data. Biometrics, 33(1), 1977.
Ian Lewin, Ilona Silins, Anna Korhonen, Johan Hogberg, and Ulla Stenius. A new challenge for text mining: Cancer risk assessment. In Proceedings of the ISMB
BioLINK Special Interest Group on Text Data Mining.,
2008.
NCBI. Efetch entrez utility, 2005. URL http://www.ncbi.nlm.nih.gov/entrez/ query/static/efetch_help.html.
Sturart J. Nelson, Tammy Powell, and Besty L. Humphreys. The Unified Medical Language System (UMLS) Project. In Encyclopedia of Library and
In-formation Science, pages 369–378. Marcel Dekker,
2002.
M. F. Porter. An algorithm for suffix stripping. Program, 14(3):130–137, 1980.
Jason D. M. Rennie and David Karger. Tackling the poor assumptions of naive bayes text classifiers. In In
Pro-ceedings of the 20th ICML, 2003.
Y. Sasaki, S. Montemagni, P. Pezik, D. Rebholz-Schuhmann, J. McNaught, and S. Ananiadou. BioLex-icon: A Lexical Resource for the Biology Domain. 2008.
Y. Tsuruoka, Y. Tateishi, J. Kim, T. Ohta, J. McNaught, S. Ananiadou, and J. Tsujii. Developing a Robust Part-of-Speech Tagger for Biomedical Text. 3746, 2005.
EPA, 2005. Guidelines for carcinogen risk as-sessment. U.S. Environmental Protection Agency, 2005. URL http://www.epa.gov/iris/ cancer032505.pdf.
Vladimir N. Vapnik. The nature of statistical learning
theory. New York, NY, USA, 1995.
Hongning Wang, Minlie Huang, Shilin Ding, and Xi-aoyan Zhu. Exploiting and integrating rich features for biological literature classification. BMC
Bioinfor-matics, 9(Suppl 3), 2008.
Yiming Yang and Xin Liu. A re-examination of text cate-gorization methods. In Proceedings of the 22nd SIGIR, New York, NY, USA, 1999.
Yiming Yang and Jan O. Pedersen. A comparative study on feature selection in text categorization. 1997.