Exploiting Timelines to Enhance Multi-document Summarization
Jun-Ping Ng1,2, Yan Chen3, Min-Yen Kan2,4, Zhoujun Li31DSO National Laboratories, Singapore
2School of Computing, National University of Singapore, Singapore
3State Key Laboratory of Software Development Environment, Beihang University, China
4Interactive and Digital Media Institute, National University of Singapore, Singapore
Abstract
We study the use of temporal information in the form of timelines to enhance multi-document summarization. We employ a fully automated temporal processing sys-tem to generate a timeline for each in-put document. We derive three features from these timelines, and show that their use in supervised summarization lead to a significant 4.1% improvement in ROUGE performance over a state-of-the-art base-line. In addition, we propose TIMEMMR, a modification to Maximal Marginal Rel-evance that promotes temporal diversity by way of computing time span similar-ity, and show its utility in summarizing certain document sets. We also propose a filtering metric to discard noisy timelines generated by our automatic processes, to purify the timeline input for summariza-tion. By selectively using timelines guided by filtering, overall summarization perfor-mance is increased by a significant 5.9%.
1 Introduction
There has been a good amount of research in-vested into improving the temporal interpretation of text. Besides the increasing availability of an-notation standards (e.g., TIMEML (Pustejovsky et al., 2003a)) and corpora (e.g., TIDES (Ferro et al., 2000), TimeBank (Pustejovsky et al., 2003b)), the community has also organized three success-ful evaluation workshops — TempEval-1 (Verha-gen et al., 2009), -2 (Verha(Verha-gen et al., 2010), and -3 (Uzzaman et al., 2013). As the state-of-the-art improves, these workshops have moved away from the piecemeal evaluation of individual tem-poral processing tasks and towards the evaluation of complete end-to-end systems in TempEval-3.
We believe our understanding of the temporal in-formation found in text is sufficiently robust, and that there is an opportunity to now leverage this in-formation in downstream applications. In this pa-per, we present our work in incorporating the use of such temporal information into multi-document summarization.
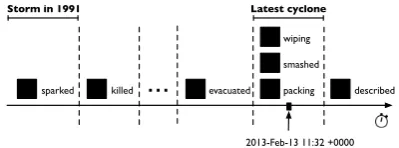
The goal of multi-document summarization is to generate a summary which includes the main points from an input collection of documents with minimal repetition of similar points. We hope to improve the quality of the summaries that are gen-erated by considering temporal information found in the input text. To motivate how temporal in-formation can be useful in summarization, let us refer to Figure 1. The three sentences describe a recent cyclone and a previous one which happened in 1991. Recognizing that sentence (3) is about a storm that had happened in the past is important when writing a summary about the recent storm, as it is not relevant and can likely be excluded.
It is reasonable to expect that a collection of documents about the recent storm will contain more references to it, compared with the earlier one that happened in 1991. Visualized on a time-line, this will translate to more events (bolded in Figure 1) around the time when the recent storm occurred. There should be fewer events mentioned in the collection for the earlier 1991 time period. Figure 2 illustrates a possible timeline laid out with the events found in Figure 1. The events from the more recent storm are found together at the same time. There are fewer events which talk about the previous storm. Thus, temporal informa-tion does assist in identifying which sentences are more relevant to the final summary.
Our work is significant as it addresses an im-portant gap in the exploitation of temporal infor-mation. While there has been prior work making use of temporal information for multi-document
(1) A fierce cyclonepackingextreme winds and torrential rain smashedinto Bangladesh’s southwestern coast Thursday, wipingout homes and trees in what officialsdescribedas the worst storm in years.
(2) More than 100,000 coastal villagers have beenevacuatedbefore the cyclone made landfall.
[image:2.595.81.281.150.224.2](3) The storm matched one in 1991 thatsparkeda tidal wave thatkilledan estimated 138,000 people, Karmakar told AFP. Figure 1: Modified extract from a news article which describes a cyclone landfall. Several events which appear in Figure 2 are bolded.
smashed packing wiping
described sparked killed
...
Storm in 1991 Latest cyclone
evacuated
2013-Feb-13 11:32 +0000 Figure 2: Possible timeline for events in Figure 1.
summarization, they 1) have been largely con-fined to helping to chronologically order content within summaries (Barzilay et al., 1999), or 2) focus only on the use of recency as an indicator of saliency (Goldstein et al., 2000; Wan, 2007). In this work we construct timelines (as a repre-sentation of temporal information) automatically and incorporate them into a state-of-the-art multi-document summarization system. This is achieved with 1) three novel features derived from time-lines to help measure the saliency of sentences, as well as 2) TIMEMMR, a modification to the traditional Maximal Marginal Relevance (MMR) (Carbonell and Goldstein, 1998). TimeMMR pro-motes diversity by additionally considering tem-poral information instead of just lexical similari-ties. Through these, we demonstrate that temporal information is useful for multi-document summa-rization. Compared to a competitive baseline, sig-nificant improvements of up to 4.1% are obtained. Automatic temporal processing systems are not perfect yet, and this may have an impact on their use for downstream applications. This work ad-ditionally proposes the use of the lengths of lines as a metric to gauge the usefulness of time-lines. Together with the earlier described contribu-tions, this metric further improves summarization, yielding an overall 5.9% performance increase.
2 Related Work
Barzilay et al. (1999) were one of the first to use time for multi-document summarization. They recognized the importance of generating a sum-mary which presents the time perspective of the summarized documents correctly. They estimated the chronological ordering of events with a small
set of heuristics, and also made use of lexical pat-terns to perform basic time normalization on terms like “today” relative to the document creation time. The induced ordering is used to present the selected summary content, following the chrono-logical order in the original documents.
In another line of work, Goldstein et al. (2000) made use of the temporal ordering of documents to be summarized. In computing the relevance of a passage for inclusion into the final summary, they considered the recency of the passage’s source document. Passages from more recent documents are deemed to be more important. Wan (2007) and Demartini et al. (2010) made similar assump-tions in their work on TIMEDTEXTRANKand en-tity summarization, respectively.
Instead of just considering the notion of re-cency, Liu et al. (2009) proposed an interesting approach using a temporal graph. Events within a document set correspond to vertices in their pro-posed graph, while edges are determined by the temporal ordering of events. From the resulting weakly-connected graph, the largest forests are as-sumed to contain key topics within the document set and used to influence a scoring mechanism which prefers sentences touching on these topics.
Wu (2008) also made use of the relative or-dering of events. He assigned complete times-tamps to events extracted from text. After lay-ing out these events onto a timeline by maklay-ing use of these timestamps, the number of events that happen within the same day is used to influence sentence scoring. The motivation behind this ap-proach is that days which have a large number of events should be more important and more worthy of reporting than others.
as an indicator of saliency is useful, yet disregards other accessible temporal information. If a sum-mary of a whole sequence of events is desired, re-cency becomes less useful.
The work of Wu (2008) is closely related to one of the features proposed in this paper. He had also made use of temporal information to weight sen-tences to generate summaries. However his ap-proach is guided by the number of events hap-pening within the same time span, and relies on event co-referencing. In this work, we have sim-plified this idea by dropping the need for event co-referencing (removing a source of propagated er-ror), and augmented it with two additional features derived from timelines. By doing so, we are able to make better use of the available temporal infor-mation, taking into account all known events and the time in which they occur.
A useful note here is that this work is ar-guably different from the Temporal Summariza-tion (TmpSum) track at the Text Retrieval Confer-ence (Aslam et al., 2013). Given a large stream of data in real-time, the purpose of the TmpSum track is to look out for a query event, and retrieve specific details about the event over a period of time. Systems are also expected to identify the source sentences from which these details are re-trieved. This is not the same as our approach here, which makes use of temporal information encoded in timelines to generate prose summaries.
3 Methodology
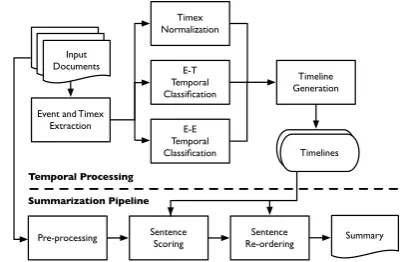
To incorporate temporal information into multi-document summarization, we adopt the workflow in Figure 3, which has two key processes: 1) tem-poral processing, and 2) summarization.
Input DocumentsDocumentsInput Input
Documents E-T
Temporal Classification
E-E Temporal Classification Event and Timex
Extraction
Sentence
Scoring Re-orderingSentence
Pre-processing Summary
Summarization Pipeline Temporal Processing
Timeline Generation Timex
Normalization
[image:3.595.77.280.568.699.2]TimelinesTimelines
Figure 3: Incorporating temporal information into theSWINGsummarization pipeline.
Temporal Processinggenerates timelines from
text, one for each input document. Timelines are
well-understood constructs which have often been used to represent temporal information (Denis and Muller, 2011; Do et al., 2012). They indicate the temporal relationships between two basic tempo-ral units: 1) events, and 2) time expressions (or timexes for short). In this work, we adopt the definitions proposed in the standardized TIMEML annotation (Pustejovsky et al., 2003a). An event refers to an eventuality, a situation that occurs or an action; while a timex is a reference to a partic-ular date or time (e.g. “2013 December 31”).
Following the “divide-and-conquer” approach described in Verhagen et al. (2010), results from the three temporal processing steps: 1) timex nor-malization, 2) event-timex temporal relationship classification, and 3) event-event temporal rela-tionship classification, are merged to obtain time-lines (top half of Figure 3). We tap on existing systems for each of these steps (Ng and Kan, 2012; Str¨otgen and Gertz, 2013; Ng et al., 2013).
Summarization. We make use of a
state-of-the-art summarization system,SWING (Ng et al., 2012) (bottom half of Figure 3). SWING is a su-pervised, extractive summarization system which ranks sentences based on scores computed using a set of features in the Sentence Scoring phase. The Maximal Marginal Relevance (MMR) algo-rithm is then used in the Sentence Re-ordering
phase to re-order and select sentences to form the final summary. The timelines built in the ear-lier temporal processing can be incorporated into this pipeline by deriving a set of features used to score sentences inSentence Scoring, and as input to the MMR algorithm when computing similarity inSentence Re-ordering.
3.1 Timelines from Temporal Processing
A typical timeline used in this work has been shown earlier in Figure 2. The arrowed, horizon-tal axis is the timeline itself. The timeline can be viewed as a continuum of time, with points on the timeline referring to specific moments of time. Small solid blocks on the timeline itself are ref-erences to absolute timestamps along the timeline (e.g., “2013-Feb-13 11:32 +0000” in the figure).
simpli-left peak of e right peak of e
bi
gg
es
t
cl
us
ter
Time Span A Time Span A+4
[image:4.595.93.273.64.157.2]e
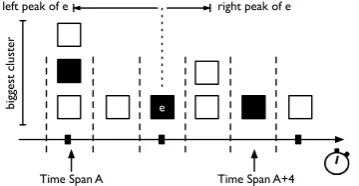
Figure 4: A simplified timeline illustrating how the various timeline features can be derived.
fying assumption, events are laid out on the time-line based on the starting time of their time span. Note that in our work, time spans may not cor-respond to specific instances of time, but instead help in inferring an ordering of events. Events which appear to the left of others take place ear-lier, while events within the same time span hap-pen together over the same time period.
3.2 Sentence Scoring with Timelines
We derive three features from the constructed timelines, which are then used for downstream
Sentence Scoring. Figure 4 shows a simplified timeline, along with annotations that are refer-enced in this section to help explain how these timeline features are derived.
1. Time Span Importance (TSI).We
hypothe-size that when more events happen within a partic-ular time span, that time span is potentially more relevant for summarization. Sentences that men-tion events found in such a time span should be as-signed higher scores. Referring to Figure 1, whose timeline is shown in Figure 2, we see that the time span with the most number of events is when the latest cyclone made landfall. Assigning higher scores for sentences which contain events in this time span will help us to select more relevant sen-tences if we want a summary about the cyclone.
LetT SLbe the time span with the largest
num-ber of events in a timeline. The importance of a time span T Si is computed by normalizing the
number of events in T Si against the number of
events in T SL. TheT SI of a sentence sis then
the sum of the time span importance associated to all the words ins:
T SI(s) = P
w∈s||T ST SwL||
|s| (1)
where T Sw denotes the time span which a word
wis associated with, and|T Sw|is the number of
events within the time span.
2. Contextual Time Span Importance
(CTSI). The importance of a time span may not
depend solely on the number of events that hap-pen within it. If it is near time spans which are “important” (i.e., one that has a large number of events), it should also be of relative importance. A more concrete illustration of this can also be seen in Figure 1. Sentence (2) explains that a lot of peo-ple have been evacuated prior to the cyclone mak-ing landfall. It is imaginable that this can be use-ful information to be included in a summary, even though from looking at the corresponding timeline in Figure 2, the “evacuated” event falls in a time span with a low importance score (i.e., the time span only has one event). CTSI seeks to promote sentences such as this.
We derive the CTSI of a sentence by first com-puting the contextual importance of words in the sentence. We define the contextual importance of a word found in time spanT Si as a weighted sum
of the time span importance of the two nearest peaks T Slp andT Srp found to the left and right
ofT Si, respectively. In Figure 4, taking reference
from evente(shaded in black), the left peak to the time span which eis in happens to be time span
A, while the right peak is time span A+ 4. The contribution of each peak to the weighted sum is decayed by its distance fromT Si. Formally, the
contextual time span importance of a wordwcan be expressed as:
ζ(w) =α Ilp
|T Sw−T Slp|
×(1−α) Irp
|T Srp−T Sw|
(2)
whereT Swis the time span associated withw.Ilp
andIrp are the time span importance of the peaks
to the left and right of T Sw respectively, while |T Sw −T Slp| and |T Srp −T Sw| are the
num-ber of time spans between the left and right peaks ofT Swrespectively.αbalances the importance of
the left and right peaks, intuitively set to0.5. The CTSI of a sentence is computed as:
CT SI(s) = P
e∈Esζ(e)
|Es| (3)
whereEsdenotes the set of events words ins.
3. Sentence Temporal Coverage Density
(TCD).We first define thetemporal coverageof a
sentence. This corresponds to the number of time spans that the events in a sentence talk about. Sup-pose a sentence contains events which are associ-ated with time spans T Sa, T Sb, T Sc. The time
the timeline. Then the temporal coverage of a sen-tence is defined as the number of time spans be-tween the earliest time span T Sa and the latest
time span T Sc. Referring to Figure 4, suppose
a sentence contains the three events which have been shaded black. The temporal coverage in this case includes all the time spans from time spanA
to time spanA+ 4, inclusive.
The constraint on the number of sentences that can be included in a summary requires us to select compact sentences which contain as many rele-vant facts as possible. Traditional lexical measures may attempt to achieve this by computing the ra-tio of keyphrases to the number of words in a sen-tence (Gong and Liu, 2001). Stated equivalently, when two sentences are of the same length, if one contains more keyphrases, it should contain more useful facts. TCD parallels this idea with the use of temporal information, i.e. if two sentences are of the same temporal coverage, then the one with more events should carry more useful facts.
Formally, if a sentence scontains eventsEs = {e1, . . . , en}, where each event is associated with a time spanT Si, thenT CDis computed using:
T CD(s) = |T S|Es|
n−T S1| (4) where|Es|is the number of events found ins, and |T Sn−T S1|is the temporal coverage ofs.
3.3 Enhancing MMR with TimeMMR
In the sentence re-ordering stage of the SWING
pipeline, the iterative MMR algorithm is used to adjust the score of a candidate sentence,s. In each iteration,sis penalized if it is lexically similar to other sentences that have already been selected to form the eventual summaryS={s1, s2, . . .}. The motivating idea is to reduce repeated information by preferring sentences which bring in new facts.
Incorporating temporal information can poten-tially improve this. In Figure 5, the sentences de-scribe many events which took place within the same time span. They describe the destruction caused by a hurricane with trees uprooted and buildings blown away. A summary about the hur-ricane need not contain all of these sentences as they are all describing the same thing. However it is not trivial for the lexically-motivated MMR algorithm to detect that events like “passed”, “ up-rooted” or “damaged” are in fact repetitive.
Thus, we propose further penalizing the score of s if it contains events that happen in similar
time spans as those contained in sentences within
S. We refer to this as TIMEMMR. Modifying the MMR equation from Ng et al. (2012):
T imeMMR(s) =Score(s)−γR2(s, S)−(1−γ)T(s, S) (5)
whereScore(s) is the score ofs, S is the set of sentences already selected to be in the summary from previous iterations, andR2 is the predicted ROUGE-2 score of swith respect to the already selected sentences (S).γis a weighting parameter which is empirically set to 0.9 after tuning over a development dataset.T is the proportion of events inswhich happen in the same time span as another event in any other sentence inS. Two events are said to be in the same time span if one happens within the time period the other happens in. For example, an event that takes place in “2014 June” is said to take place within the year “2014”.
While TIMEMMR is proposed here as an im-provement over MMR, the premise is that incor-porating temporal information can be helpful to minimize redundancy in summaries. In future work, one could apply it to other state-of-the-art lexical-based approaches including that of Hen-drickx et al. (2009) and Celikyilmaz and Hakkani-Tur (2010). We also believe the same idea can be transplanted even to non-lexical motivated tech-niques such as the corpus-based similarity mea-sure proposed by Xie and Liu (2008). We chose to use MMR here as a proof-of-concept to demon-strate the viability of such a technique, and to eas-ily integrate our work intoSWING.
3.4 Gauging Usefulness of Timelines
Temporal processing is imperfect. Together with the simplifying assumptions that were made in timeline construction, our generated timelines have errors which propagate into the summariza-tion process. With this in mind, we selectively em-ploy timelines to generate summaries only when we are confident of their accuracy. This can be done by computing a metric which can be used to decide whether or not timelines should be used for a particular input document collection. We refer to this asreliability filtering.
(1) An official in Barisal, 120 kilometres south of Dhaka, spoke of severedestructionas the 500 kilometre-wide mass of cloud passedoverhead.
(2) “Many trees have beenuprootedand houses and schoolsblownaway,” Mostofa Kamal, a district relief and rehabilitation officer, told AFP by telephone.
(3) “Mud huts have beendamagedand the roofs of several housesblownoff,” said the state’s relief minister, Mortaza Hossain. Figure 5: Extract from a news article which describes several events (bolded) happening at the same time.
very easily propagated into summary generation for shorter timelines, leading to less useful results. We incorporate this into our process as follows: given an input document collection (which con-sists of 10 documents), the average size of all the timelines for each of these 10 documents is com-puted. Only when this value is larger than a thresh-old value are the timelines used.
4 Experiments and Results
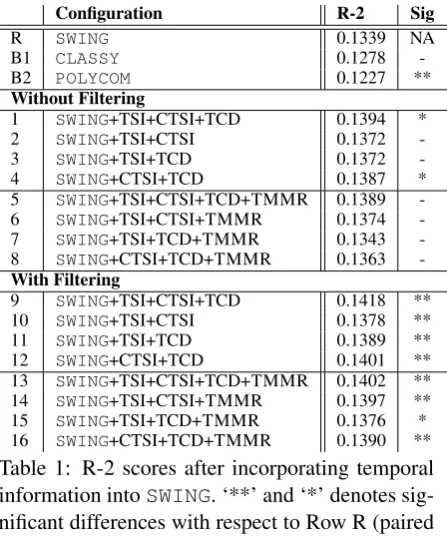
The proposed timeline features and TIMEMMR were implemented on top of SWING, and eval-uated on the test documents from TAC-2011 (Owczarzak and Dang, 2011). SWINGmakes use of three generic features and two features targeted specifically at guided summarization. Since the focus of this paper is on multi-document summa-rization, we employ only the three generic fea-tures, i.e., 1) sentence position, 2) sentence length, and 3) interpolated n-gram document frequency in our experiments below. Summarization evalua-tion is done using ROUGE-2 (R-2) (Lin and Hovy, 2003), as it has previously been shown to correlate well with human assessment (Lin, 2004) and is of-ten used to evaluate automatic text summarization. The results obtained are shown in Table 1. In the table, each row refers to a specific summariza-tion system configurasummariza-tion. We also show the re-sults of two reference systems,CLASSY(Conroy et al., 2011) andPOLYCOM (Zhang et al., 2011), as benchmarks. CLASSY andPOLYCOM are top performing systems at TAC-2011 (ranked 2nd and 3rd by R-2 in TAC 2011, respectively; the full ver-sion of SWING was ranked 1st with a R-2 score of 0.1380). From these results, we can see that
SWINGis a very competitive baseline.
Rows 9 to 16 additionally incorporate our time-line reliability filtering. We assume that the var-ious input document sets to be summarized are available at the time of processing. Hence in these experiments, the threshold for filtering is set to be the average of all the timeline sizes over the whole input dataset. In a production environment where this assumption may not hold, this threshold could
Configuration R-2 Sig
R SWING 0.1339 NA
B1 CLASSY 0.1278
-B2 POLYCOM 0.1227 **
Without Filtering
1 SWING+TSI+CTSI+TCD 0.1394 *
2 SWING+TSI+CTSI 0.1372
-3 SWING+TSI+TCD 0.1372
-4 SWING+CTSI+TCD 0.1387 *
5 SWING+TSI+CTSI+TCD+TMMR 0.1389
-6 SWING+TSI+CTSI+TMMR 0.1374
-7 SWING+TSI+TCD+TMMR 0.1343
-8 SWING+CTSI+TCD+TMMR 0.1363
-With Filtering
9 SWING+TSI+CTSI+TCD 0.1418 **
10 SWING+TSI+CTSI 0.1378 **
11 SWING+TSI+TCD 0.1389 **
12 SWING+CTSI+TCD 0.1401 **
13 SWING+TSI+CTSI+TCD+TMMR 0.1402 **
14 SWING+TSI+CTSI+TMMR 0.1397 **
15 SWING+TSI+TCD+TMMR 0.1376 *
[image:6.595.308.532.155.425.2]16 SWING+CTSI+TCD+TMMR 0.1390 **
Table 1: R-2 scores after incorporating temporal information intoSWING. ‘**’ and ‘*’ denotes sig-nificant differences with respect to Row R (paired one-tailed Student’st-test;p < 0.05andp <0.1 respectively), and TMMR denotes TIMEMMR.
be set by empirical tuning over a development set. Row 1 shows the usefulness of the proposed timeline-based features. A statistically significant improvement of 4.1% is obtained with the use of all three features over SWING. When we use re-liability filtering (Row 9), this improvement in-creases to 5.9%.
The ablation test results in Rows 2 to 4 show a drop in R-2 each time a feature is left out. With the exception of Row 4, removing a feature lessens the improvement in R-2 to be insignificant from
SWING’s. The same drop occurs even when reli-ability filtering is used (Rows 9 to 12). These in-dicate that all the proposed features are important and need to be used together to be effective.
to guide the use of timelines such that significant improvements in R-2 overSWINGare obtained.
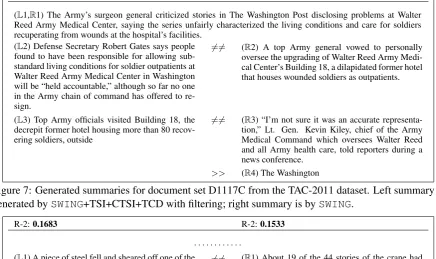
To help visualize what the differences in these ROUGE scores mean, Figure 7 shows two sum-maries1generated for document set D1117C of the
TAC-2011 dataset. The left one is produced by the configuration in Row 9, and the right one is pro-duced bySWINGwithout the use of any temporal information.
0.0 0.2 0.4 0.6 0.8 1.0
SP Length INDF TSI CTSI TCD
Fe
at
u
re
S
co
re
Features
L2 R2
Figure 6: Breakdown of raw feature scores for sen-tences (L2) and (R2) from Figure 7.
The higher R-2 score obtained by the summary on the left (0.0873) compared to the one on the right (0.0723) suggests that temporal information can help to identify salient sentences more accu-rately. A closer look at sentences (L2) and (R2) and their R-2 scores (0.0424 and 0.0249, respec-tively) is instructive. Figure 6 shows the raw fea-ture scores of both sentences. Both sentences score similarly for the SWING features of sen-tence position (SP), sensen-tence length (Length), and interpolated n-gram document frequency (INDF); however, the scores for all three timeline features higher for (L2) than (R2). This helps our time sen-sitive system prefer (L2).
5 Discussion
We now examine the proposed 1) timeline fea-tures, 2) TIMEMMR algorithm, and 3) reliabil-ity filtering metric in greater detail to gain insight into their efficacy. For the analysis on timeline features, we only present an analysis for TSI and CTSI due to space constraints.
Time Span Importance. Figure 8 shows the
last sentences from a pair of summaries generated with and without the use of TSI (all other sen-tences were the same). The original articles de-scribe an accident where casualties were suffered when a crane toppled onto a building. It is easy to see why (L1) scores higher for R-2 — it describes the cause of the accident just as it occurred. (R1) however talks about events which happened before
1The produced summaries are truncated to fit within a
100-word limit imposed by the TAC-2011 guidelines.
the accident itself (e.g., how much of the tower had already been erected). In this case time span im-portance is able to correctly guide summary gen-eration by favoring time spans containing events related to the actual toppling.
Contextual Time Span Importance. CTSI
[image:7.595.88.276.193.271.2]recognizes that events which happen around the time of a big cluster of other events can be im-portant too. The benefits of this feature can be clearly seen in Figure 9. The summary on the left achieved a R-2 score of 0.1215 while the one on the right achieved 0.0861. (L2) and (L3) were both boosted by the use of the contextual impor-tance feature.
Figure 10 shows an extract of the timeline gen-erated for the source document from which (L3) is extracted. The two events inside (L3) fall in time spansA andB marked in the figure. Their proximity to the peak P between them gives the sentence a higher score for CTSI. This boost re-sults in the sentence being selected for inclusion in the final summary. It turns out that this sentence was lifted exactly in one of the model summaries for this document set, resulting in a very good R-2 score when contextual importance is used.
warn disappear
Peak here affects time span contextual importance of A and B
[image:7.595.318.517.419.521.2]A P B
Figure 10: Extract of timeline generated for doc-ument APW ENG 20070615.0356 from the TAC-2011 dataset.
Is TIMEMMR Useful? The experimental
re-sults do not conclusively affirm the usefulness of TIMEMMR. However we believe it is because the ROUGE measures that are used for evalua-tion are not suited for this purpose. Recall that TIMEMMR seeks to eliminate redundancy based on time span similarities and not lexical likeness. ROUGE, however, measures the latter.
R-2:0.0873 R-2:0.0723
(L1,R1) The Army’s surgeon general criticized stories in The Washington Post disclosing problems at Walter Reed Army Medical Center, saying the series unfairly characterized the living conditions and care for soldiers recuperating from wounds at the hospital’s facilities.
(L2) Defense Secretary Robert Gates says people found to have been responsible for allowing sub-standard living conditions for soldier outpatients at Walter Reed Army Medical Center in Washington will be “held accountable,” although so far no one in the Army chain of command has offered to re-sign.
6
=6= (R2) A top Army general vowed to personally oversee the upgrading of Walter Reed Army Medi-cal Center’s Building 18, a dilapidated former hotel that houses wounded soldiers as outpatients.
(L3) Top Army officials visited Building 18, the decrepit former hotel housing more than 80 recov-ering soldiers, outside
6
=6= (R3) “I’m not sure it was an accurate representa-tion,” Lt. Gen. Kevin Kiley, chief of the Army Medical Command which oversees Walter Reed and all Army health care, told reporters during a news conference.
[image:8.595.80.517.75.334.2]>> (R4) The Washington
Figure 7: Generated summaries for document set D1117C from the TAC-2011 dataset. Left summary is generated bySWING+TSI+CTSI+TCD with filtering; right summary is bySWING.
R-2:0.1683 R-2:0.1533
. . . .
(L1) A piece of steel fell and sheared off one of the ties holding it to the building, causing it to detach and topple, said Stephen Kaplan
6
=6= (R1) About 19 of the 44 stories of the crane had been erected and it was to be extended when a piece of steel fell and sheared
Figure 8: Extract from summaries for document set D1137G from the TAC-2011 dataset. Left extract is generated bySWING+TSI+CTSI+TCD; right extract is bySWING+CTSI+TCD.
the two summaries is (R3). (L3) is the equivalent of (R4), while (L4) is the full version of the trun-cated (R5). TIMEMMR penalizes (R3). (R3) re-ports that the shoe-throwing incident happened as the U.S. President Bush appeared together with the Iraqi Prime Minister Nouri al-Maliki. However their joint appearance is already reported in (R1) (and similarly (L1)). (R3) repeats what had been presented earlier. Since (R1) and (R3) talk about the same time span, TIMEMMR down-weights (R3). We argue that this is better even though the ROUGE scores indicate otherwise. In future work it will be worthwhile to consider the use of metrics like Pyramid (Passonneau et al., 2005) which are less bound to superficial lexicons.
Reliability Filtering. Table 2 shows the
ef-fect of varying the filtering threshold on R-2 for the best performing configuration from Table 1 (i.e., SWING+TSI+CTSI+TCD). The result ob-tained in Row 9 using a threshold of 42.68 is also re-produced for reference. T=0 means that time-lines are used for all input document sets, whereas
T=100 means that no timelines are used, as the length of the longest timeline is less than 100.
As the threshold increases from 0 to 40–50, summarization performance improves while the
T R-2 Sig # T R-2 Sig #
0 0.1394 * 44 50 0.1386 ** 13
10 0.1382 - 43 60 0.1361 * 7
20 0.1377 - 41 70 0.1351 - 3
30 0.1393 ** 35 80 0.1351 - 2
40 0.1426 ** 22 90 0.1353 - 1
42.68 0.1418 ** 21 100 0.1339 - 0
Table 2: Effect of different reliability filtering thresholds for SWING+TSI+CTSI+TCD. ‘T’ is the threshold used; ‘#’ is the number of input col-lections (out of 44) where timelines are used; ‘**’ and ‘*’ is statistical significance over SWING of
p <0.05andp <0.1, respectively.
[image:8.595.309.528.403.557.2]R-2:0.1215 R-2:0.0861
((L1,R1) Caribbean coral species essential to the region’s reef ecosystems are at risk of extinction as a result of climate change.
(L2) But destructive fishing methods and over-harvesting have reduced worldwide catches by 90 percent in the past two decades.
6
=6= (R2) The Coral Reef Task Force, created in the Clinton administration, regularly assesses coral health.
(L3) Scientists warn that up to half of the world’s
coral reefs could disappear by 2045. 6=6= (to 20,000 dollars (15,000 euros), red corals areR3) With a finished necklace retailing for up among the world’s most expensive wildlife com-modities.
[image:9.595.78.520.72.403.2]. . . .
Figure 9: Extract from summaries for document set D1131F from the TAC-2011 dataset. Left extract is generated bySWING+TSI+CTSI+TCD; right extract is bySWING+TSI+TCD.
R-2:0.2643 R-2:0.2772
(L1,R1) – An Iraqi reporter threw his shoes at visiting U.S. President George W. Bush and called him a ”dog” in Arabic during a news conference with Iraqi Prime Minister Nuri al-Maliki in Baghdad
(L2,R2) ”All I can report is it is a size 10,. (L3) Muntadhar al-Zaidi, reporter of Baghdadiya television jumped and threw his two shoes one by one at the president, who ducked and thus narrowly missed being struck, raising chaos in the hall in Baghdad’s heavily fortified green Zone.
6
=6= (R3) The incident occurred as Bush was appearing with Iraqi Prime Minister Nouri al-Maliki.
(L4) The president lowered his head and the first shoe hit the American and Iraqi flags behind the two leaders.
6
=6= (R4) Muntadhar al-Zaidi, reporter of Baghdadiya television jumped and threw his two shoes one by one at the president, who ducked and thus narrowly missed being struck, raising chaos in the hall in Baghdad’s heavily fortified green Zone.
(L5) The 6=6= (R5) The president lowered his head and the
Figure 11: Summaries for document set D1126E from the TAC-2011 dataset. Left summary is generated bySWING+TSI+CTSI+TCD+TIMEMMR; right summary is bySWING+TSI+CTSI+TCD.
significant from that produced bySWING.
6 Conclusion
We have shown in this work how temporal in-formation in the form of timelines can be incor-porated into multi-document summarization. We achieve this through two means, using: 1) three novel features derived from timelines to mea-sure the saliency of sentences, and 2) TIMEMMR which considers time span similarity to enhance the traditional MMR’s lexical diversity measure.
To overcome errors propagated from the under-lying temporal processing systems, we proposed a reliability filtering metric which can be used to help decide when temporal information should be used for summarization. The use of this metric leads to an overall 5.9% gain in R-2 over the com-petitiveSWINGbaseline.
In future work, we are keen to study our pro-posed timeline-related features more intrinsically in the context of human-generated summaries. This can help us better understand their value in improving content selection. As noted earlier,
it will be also be useful to repeat our experi-ments with less lexicon-influenced measures like the Pyramid method (Passonneau et al., 2005). Manual assessment of the generated summaries can also be done to give a better picture of the quality of the summaries generated with the use of timelines. Finally, given the importance of re-liability filtering, a natural question is if there are other metrics that can be used to get better results.
Acknowledgments
This research is supported by the Singapore Na-tional Research Foundation under its InternaNa-tional Research Centre @ Singapore Funding Initiative and administered by the IDM Programme Office.
References
Javed Aslam, Matthew Ekstrand-Abueg, Virgil Pavlu, Fernado Diaz, and Tetsuya Sakai. 2013. TREC
2013 Temporal Summarization. In Proceedings of
the 22nd Text Retrieval Conference (TREC), Novem-ber.
Regina Barzilay, Kathleen McKeown, and Michael El-hadad. 1999. Information Fusion in the Context of
Multi-document Summarization. InProceedings of
the 37th Annual Meeting of the Association for Com-putational Linguistics on ComCom-putational Linguistics (ACL), pages 550–557, June.
Jaime Carbonell and Jade Goldstein. 1998. The Use of MMR, Diversity-based Reranking for Reordering
Documents and Producing Summaries. In
Proceed-ings of the 21st Annual International ACM Confer-ence on Research and Development in Information Retrieval (SIGIR), pages 335–336, August.
Asli Celikyilmaz and Dilek Hakkani-Tur. 2010. A Hy-brid Hierarchical Model for Multi-document
Sum-marization. In Proceedings of the 48th Annual
Meeting of the Association for Computational Lin-guistics (ACL), pages 815–824, July.
John M. Conroy, Judith D. Schlesinger, Jeff Kubina, Peter A. Rankel, and Dianne P. O’Leary. 2011. CLASSY 2011 at TAC: Guided and Multi-lingual
Summaries and Evaluation Metrics. InProceedings
of the Text Analysis Conference (TAC), November.
Gianluca Demartini, Malik Muhammad Saad Missen, Roi Blanco, and Hugo Zaragoza. 2010. Entity
Summarization of News Articles. InProceedings of
the 33rd Annual International ACM Conference on Research and Development in Information Retrieval (SIGIR), pages 798–796, July.
Pascal Denis and Philippe Muller. 2011. Predicting Globally-Coherent Temporal Structures from Texts via Endpoint Inference and Graph Decomposition. InProceedings of the 22nd International Joint Con-ference on Artificial Intelligence (IJCAI), July.
Quang Xuan Do, Wei Lu, and Dan Roth. 2012. Joint
Inference for Event Timeline Construction. In
Pro-ceedings of the 2012 Joint Conference on Empirical Methods in Natural Language Processing and Com-putational Natural Language Learning (EMNLP), pages 677–689, July.
Lisa Ferro, Laurie Gerber, Inderjeet Mani, Beth Sund-heim, and George Wilson. 2000. Instruction Man-ual for the Annotation of Temporal Expressions. Technical report, The MITRE Corporation.
Jade Goldstein, Vibhu Mittal, Jaime Carbonell, and Mark Kantrowitz. 2000. Multi-document
Sum-marization by Sentence Extraction. InProceedings
of the 2000 NAACL-ANLP Workshop on Automatic Summarization, volume 4, pages 40–48, April.
Yihong Gong and Xin Liu. 2001. Generic Text Sum-marization Using Relevance Measure and Latent
Se-mantic Analysis. InProceedings of the 24th Annual
International ACM Conference on Research and De-velopment in Information Retrieval (SIGIR), pages 19–25, September.
Iris Hendrickx, Walter Daelemans, Erwin Marsi, and Emiel Krahmer. 2009. Reducing Redundancy in Multi-document Summarization using Lexical
Se-mantic Similarity. InProceedings of the Workshop
on Language Generation and Summarisation (UC-NLG+Sum), pages 63–66, August.
Chin-Yew Lin and Eduard Hovy. 2003.
Auto-matic Evaluation of Summaries Using N-gram Co-occurrence Statistics. InProceedings of the Confer-ence of the North American Chapter of the Associa-tion for ComputaAssocia-tional Linguistics on Human Lan-guage Technology (NAACL), volume 1, pages 71– 78, May.
Chin-Yew Lin. 2004. Looking for a Few Good
Met-rics: ROUGE and its Evaluation. InWorking Notes
of the 4th NTCIR Workshop Meeting, June.
Maofu Liu, Wenjie Li, and Huijun Hu. 2009. Extrac-tive Summarization Based on Event Term Temporal
Relation Graph and Critical Chain. InInformation
Retrieval Technology, volume 5839 ofLecture Notes in Computer Science, pages 87–99. Springer Berlin Heidelberg.
Jun-Ping Ng and Min-Yen Kan. 2012. Improved Temporal Relation Classification using Dependency Parses and Selective Crowdsourced Annotations. In Proceedings of the International Conference on Computational Linguistics (COLING), pages 2109– 2124, December.
Jun-Ping Ng, Praveen Bysani, Ziheng Lin, Min-Yen
Kan, and Chew-Lim Tan. 2012. Exploiting
Category-Specific Information for Multi-Document
Summarization. InProceedings of the International
Conference on Computational Linguistics
(COL-ING), pages 2093–2108, December.
Jun-Ping Ng, Min-Yen Kan, Ziheng Lin, Wei Feng, Bin Chen, Jian Su, and Chew-Lim Tan. 2013. Exploit-ing Discourse Analysis for Article-Wide Temporal Classification. InProceedings of the Conference on Empirical Methods in Natural Language Processing (EMNLP), pages 12–23, October.
Karolina Owczarzak and Hoa Dang. 2011. Overview of the TAC 2011 Summarization Track: Guided
Task and AESOP Task. InProceedings of the Text
Analysis Conference (TAC), November.
Rebecca J. Passonneau, Ani Nenkova, Kathleen McK-eown, and Sergey Sigelman. 2005. Applying the
Pyramid Method in DUC 2005. In Proceedings of
James Pustejovsky, Jos´e Castano, Robert Ingria, Roser Saur´ı, Robert Gaizauskas, Andrea Setzer, and Gra-ham Katz. 2003a. TimeML: Robust Specification
of Event and Temporal Expressions in Text. In
Pro-ceedings of the 5th International Workshop on Com-putational Semantics (IWCS), January.
James Pustejovsky, Patrick Hanks, Roser Sauri, An-drew See, Robert Gaizauskas, Andrea Setzer, Dragomir Radev, Beth Sundheim, David Day, Lisa Ferro, and Marcia Lazo. 2003b. The TIMEBANK corpus. InProceedings of Corpus Linguistics, pages 647–656, March.
Jannik Str¨otgen and Michael Gertz. 2013.
Multilin-gual and Cross-domain Temporal Tagging.
Lan-guage Resources and Evaluation, 47(2):269–298. Naushad Uzzaman, Hector Llorens, Leon Derczynski,
Marc Verhagen, James F. Allen, and James Puste-jovsky. 2013. SemEval-2013 Task 1: TEMPEVAL-3: Evaluating Time Expressions, Events, and Tem-poral Relations. InProceedings of the 7th Interna-tional Workshop on Semantic Evaluation (SemEval), June.
Marc Verhagen, Robert Gaizauskas, Frank Schilder, Mark Hepple, Jessica Moszkowicz, and James Pustejovsky. 2009. The TempEval Challenge:
Iden-tifying Temporal Relations in Text. Language
Re-sources and Evaluation, 43(2):161–179.
Marc Verhagen, Roser Saur´ı, Tommaso Caselli, and James Pustejovsky. 2010. SemEval-2010 Task 13:
TempEval-2. In Proceedings of the 5th
Interna-tional Workshop on Semantic Evaluation (SemEval), pages 57–62, July.
Xiaojun Wan. 2007. TimedTextRank: Adding the Temporal Dimension to Multi-Document Summa-rization. InProceedings of the 30th Annual Interna-tional ACM Conference on Research and Develop-ment in Information Retrieval (SIGIR), pages 867– 868, July.
Mingli Wu. 2008. Investigations on
Temporal-Oriented Event-Based Extractive Summarization. Ph.D. thesis, Hong Kong Polytechnic University. Shasha Xie and Yang Liu. 2008. Using Corpus
and Knowledge-based Similarity Measure in Max-imum Marginal Relevance for Meeting
Summariza-tion. In Proceedings of the International
Confer-ence on Acoustics, Speech, and Signal Processing (ICASSP), pages 4985–4988, March.