Smart Stress-Memory Patch for Fatigue Damage of Structure
Shoichi Nambu
*and Manabu Enoki
Department of Materials Engineering, Graduate School of Engineering, The University of Tokyo, Tokyo 113-8656, Japan A new fatigue sensor called ‘‘smart stress-memory patch’’, which can estimate the cyclic number, the stress amplitude and the maximum stress from the measurement of crack length and acoustic emission (AE), is proposed to evaluate the fatigue damage of such infrastructure as bridges and ships. The fatigue crack growth behavior of thin electrodeposited (ED) Cu specimen for this sensor is investigated. The modified stress intensity factor is proposed to introduce the master curve of fatigue crack growth, because the fatigue crack growth behavior of this patch is affected by the maximum stress and stress ratio. AE signals are also measured to estimate the AE onset stress and examine Kaiser effect of ED Cu specimen. It is expected that the cyclic number, the stress amplitude and the maximum stress in fatigue loading can be estimated by this patch. [doi:10.2320/matertrans.I-MRA2007853]
(Received September 5, 2006; Accepted March 13, 2007; Published May 25, 2007)
Keywords: fatigue sensor, health monitoring, fatigue crack growth, acoustic emission, electrodeposited copper
1. Introduction
Structural health monitoring is very important to ensure the safety of infrastructure. The fracture of structure is caused by the excessive loading, corrosion, creep and fatigue. Especially, a sensing method which avoids the fracture caused by fatigue is required. The monitoring of strain and displacement is essential to estimate fatigue damage in the case of bridges and ships. Currently, the strain gauges have been used to measure strain and displacement. However, there are several problems in the real applications of these strain gauges such as complicated cables, high cost, restric-tion by environment and so on.
Recently, the fatigue sensors, which do not measure strain nor displacement but estimate fatigue damage of structure, have been proposed.1,2)The objective of these fatigue sensors is the monitoring of fatigue damage of bridges and ships for a long period, and the fatigue damage is estimated by the crack growth of fatigue sensor attached on structure. One of the advantages of these fatigue sensors is off-line, while there are some problems that the applied stress or cyclic number must be measured by another system or estimated and the fatigue characteristics must be same between the sensor and the structure.
A new sensing method called ‘‘smart stress-memory patch’’ to monitor the fatigue damage of structure such as bridges and ships is proposed in order to overcome the above problems of fatigue sensors. It is expected that this patch can measure the cyclic number, the stress amplitude and the maximum stress. In the present paper, this patch is introduced and the characteristics of this patch is evaluated by fatigue test and acoustic emission (AE) measurement.
2. Smart Stress Memory Patch 2.1 Feature
The objectives of this smart stress-memory patch are estimation of cyclic number, stress amplitude and the maximum stress, and evaluation of the fatigue damage of infrastructure. Cyclic number and stress amplitude are
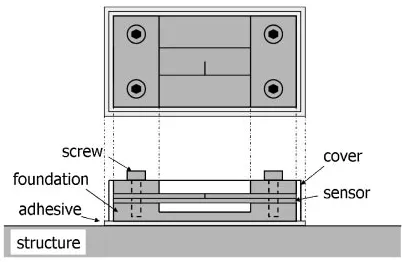
estimated from crack lengths of multiple sensors, and the maximum stress is estimated from Kaiser effect of AE measurement, respectively. The schematic image of this patch is shown in Fig. 1. The patch is fixed to a structure by screw to easily remove from structure and to measure AE behavior after removal. The patch is attached on a structure for a certain period, and is removed from structure. The crack length and AE behavior of this patch are measured to estimate cyclic number, stress amplitude and the maximum stress. Furthermore, the fatigue damage is evaluated from S-N curve of the structure, which shows the relationship between the stress amplitude and the fatigue cycles up to failure.
2.2 Estimation of cyclic number and stress amplitude The relationship between the crack growth rate and the range of the stress intensity factor under fatigue cyclic loading is well-known. The crack growth is divided into three stages and the stable crack growth is observed in the second stage, where is represented as the Paris law. Using this Paris equation, the cyclic number,N, is represented as the function of the normalized final crack length, f, and the stress
amplitude,, as follows,
N ¼C1W pffiffiffiffiffiffiffiffiW
mZf
0
ffiffiffi
p
fðÞ
m
d; ð1Þ
whereWis the width of specimen,0is the normalized initial
Fig. 1 The schematic image of smart stress memory patch.
*Graduate Student, The University of Tokyo
[image:1.595.325.526.283.414.2]crack length,is the normalized crack length,C andmare empirical constants of the Paris law and fðÞ is the shape factor of the stress intensity factor.
Furthermore, if two sensors of different properties are employed, two equations on the cyclic numberNare given,
N¼C11W1 ðW1Þm1=2ðÞm1
Z1
0
ffiffiffi
p
fðÞ
m1
d
N¼C21W2 ðW2Þm2=2ðÞm2
Z2
0
ffiffiffi
p
fðÞ
m2
d: ð2Þ
Indexes 1 and 2 represent sensor 1 and 2, respectively. From these equations, the cyclic number and the stress amplitude are obtained as,
¼ C2C11W1W21 ðW2Þm2=2 ðW1Þm1=2
Z1
0
ffiffiffi
p
fðÞ
m1
d
Z2
0
ffiffiffi
p
fðÞ
m2
d
1=ðm1m2Þ
N¼ Cm1
2 C m2
1 W
m2
1 W
m1
2 ðW2=W1Þm1m2=2
Z1
0
ffiffiffi
p
fðÞ
m1
d
m2 Z2
0
ffiffiffi
p
fðÞ
m2
d
m1
1=ðm2m1Þ
: ð3Þ
Substituting the normalized crack lengths 1 and2 in the
two sensors, the cyclic number and the stress amplitude can be estimated as shown in Fig. 2.
2.3 Estimation of the maximum stress
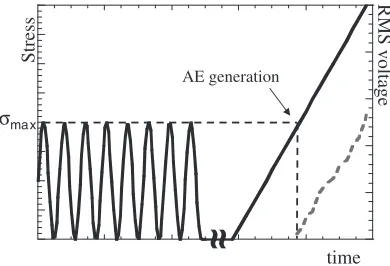
AE event is generated due to microcracking, slip defor-mation and so on when materials is loaded. It is known that AE event is not produced until the previous stress. This is because microcracking and slip deformation are generally irreversible phenomena. The phenomenon is called Kaiser effect. After smart stress-memory patch is removed from structure, AE measurement is conducted during tensile loading. Then, the maximum stress can be estimated as the onset stress when AE activity increases due to Kaiser effect, as shown in Fig. 3.
3. Experimental Procedure 3.1 Materials and geometry
The patch was made of electrodeposited (ED) copper because of its good corrosion resistance, stable crack growth and easily observation of the crack length. As-received and heat-treated (400C, 30 min) ED Cu coupons with 0.1 mm
thickness were prepared for the fatigue test and AE measure-ment. Heat-treated (400C, 30 min) rolled Cu coupon with 0.2 mm thickness was also used for AE measurement. The mean grain size was about 2mmfor the as-received ED Cu
coupon, about 4mm for the heat-treated ED Cu and about 40mm for the heat-treated rolled Cu, respectively. All coupons were cut into 40 mm length and 5 mm width. Furthermore, a single edge notch with curvature of about 150mmwas introduced at the center from one side and then a fatigue pre-crack was extended under the maximum stress of 24 MPa until total crack length reached to about 2.7 mm prior to the fatigue test.
3.2 Fatigue test
The fatigue test was carried out in tensile loading under the constant maximum stress of 30, 40 and 50 MPa, with the stress ratio of 0.1, 0.3 and 0.5, and frequency of 19 Hz. The effects of the maximum stress and the stress ratio on the fatigue crack growth behavior were investigated. The growth of the crack length was recorded automatically per minute by 500x CCD camera. A crack growth rate was calculated by the incremental polynomial technique and the stress intensity factor was obtained from the equation of a SECT (single edge cracked tension) specimen in stress intensity factors hand-book,3)as follows,
K¼pffiffiffiffiffiffiffiffiffiffiffiW
f0:265ð1Þ4þ ð0:857þ0:265Þ=ð1Þ3=2g: ð4Þ
N
α
∆σ=const. Sensor 1Sensor 2
α1 α2
Fig. 2 Cyclic number obtained from the crack lengths in two sensors.
Stress
RMS voltage
AE generation
σmax
time
[image:2.595.328.523.72.205.2] [image:2.595.81.262.75.210.2]3.3 AE measurement
AE behavior was measured to obtain the maximum stress using Kaiser effect during tensile loading. Three types of specimens were prepared. These were a smooth specimen, a notched specimen with 0.5 normalized notch length and a cracked specimen after fatigue crack growth. AE behavior under monotonic loading was measured to estimate the onset stress of AE, and AE behavior after fatigue loading was also investigated to examine Kaiser effect. AE sensor (M304, Fuji Ceramics Corp.) was attached to the surface of each specimen, and AE waveform was recorded by CWM (continuous wave memory) system.4)The cross-head speed for the tensile loading was 0.1 mm/min and 200 kHz high pass filter was employed in AE measurement.
4. Results and Discussion
4.1 Fatigue crack growth behavior
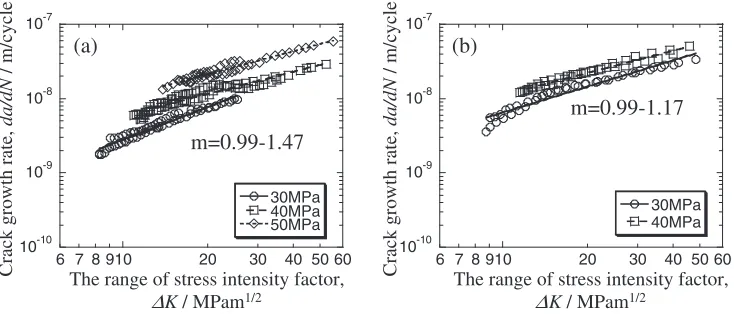
The crack growth of each sample was obtained from the fatigue test. Results in the case of 0.1 stress ratio are shown in Fig. 4. The crack growths were affected by the maximum stress, and the slope of Paris law,m, varied from 0.99 to 1.47 in as-received ED Cu specimen and from 0.99 to 1.17 in heat-treated. The crack growths under the conditions of the maximum stress of 40 and 50 MPa with the stress ratio of 0.1, 0.3 and 0.5 are shown in Fig. 5. The crack growth also depended on the stress ratio. It is found that the crack growth of this patch is substantially affected by the maximum stress and the stress ratio.
In these results, the crack growth rates are smaller than those of bulk specimens of pure Cu in the same stress intensity factor range. Because the thicknesses of specimens were thin enough to satisfy the plane-stress state, the crack growth rates became lower as the plastic constraint factor became smaller. There exist few reports about fatigue crack growth behavior of a thin metallic patch, while Guo5) reported that crack growth rate decreased with the decrease in the thickness of a bulk specimen of Al alloy. The value of
min the present study was also small compared with that of the bulk specimen of pure Cu (m¼3:9). It is considered that the small scale yielding state may not be satisfied because the plastic zone at crack tip is enough large compared with ligament of the specimen. Similar results were reported by Peralta6)for bulk specimens of Ni and Inconel.
4.2 Master curve
Although the crack growth behavior of this patch was affected by the maximum stress and the stress ratio, it is desirable that the sensor characteristics is decided from the master curve of crack growth behavior which is not affected by the maximum stress and the stress ratio. The master curve of crack growth behavior, which has one-on-one relation between crack growth rate and stress intensity factor range, is taken into account. Many studies reported that fatigue crack growth was controlled by Elber’s effective stress intensity factor range7) and not by the stress intensity factor range because of crack closure. Although the effective stress intensity factor range depends on stress ratio, Newman explained that the crack closure depended on not only the stress ratio but also the maximum stress, constraint factor and flow stress.8)According to Paris,9)Newman’s model was far better than other empirical models for life prediction. For example, Takahashi reported that Newman’s model could be applied to the evaluation of J-integral under the large scale yielding state.10)In this study, fatigue crack growth behavior was obtained from the effective stress intensity factor range of Newman’s model, but the difference due to the maximum stress and the thickness was remained.
Newman’s model was based on Dagdale’s model under the condition of the small scale yielding state, and obtained by FEM of a CCT (center crack tension) specimen. In the present study, the small scale yielding state was not satisfied due to small ligament of the specimen, and SECT specimen was used. Accordingly the modified stress intensity factor, KM, was proposed for this patch to obtain the correction
crack growth characteristics,
KM¼UðRÞ ð1RÞmax
ffiffiffiffiffiffiffiffiffiffiffi
W
p
fðÞ gð; n;RÞ
gð; n;RÞ ¼1þA1ðRÞ ðnÞ
þA2ðRÞ ðnÞ2þ ; ð5Þ
where UðRÞ is the correction function considering crack closure, fðÞ is shape factor of stress intensity factor in LEFM (liner elastic fracture mechanics) andgð; n;RÞis the
correction function of shape factor.
The crack growth behavior obtained by the modified stress intensity factor was shown in Fig. 6. The correction function of as-received ED Cu was UðRÞ ¼10:4R, A1ðRÞ ¼
0:9842:635ð1RÞ þ1:312ð1RÞ2 and that of
heat-10-10 10-9 10-8 10-7
6 7 8 910 20 30 40 50 60
30MPa 40MPa 50MPa
m=0.99-1.47
(a)
The range of stress intensity factor,
∆K/ MPam1/2
Crack growth rate,
da/dN
/ m/cycle
10-10 10-9 10-8 10-7
6 7 8 910 20 30 40 50 60
30MPa 40MPa
m=0.99-1.17
(b)
The range of stress intensity factor,
∆K/ MPam1/2
Crack growth rate,
da/dN
/ m/cycle
[image:3.595.116.483.70.227.2]treated ED Cu wasUðRÞ ¼1,A1ðRÞ ¼ 2:037, respectively.
In these equations,nis the initial normalized notch length of
0.5 and the third order terms or higher are ignored because they have little influence on results. As shown in Fig. 6, the effect of the maximum stress is corrected and all data are fitted well. The master curve of crack growth behavior without the effect of the maximum stress and the stress ratio can be obtained using the modified stress intensity factor. The values of m and C in this master curve give the unique characteristics of each sensor, and the cyclic number and the stress amplitude can be estimated from eq. (3).
4.3 AE behavior
AE count and RMS voltage are usually used to investigate AE behavior in metallic specimen. In this study, RMS voltage was used as AE parameter to estimate the AE onset stress because AE signal was very weak in the present specimen and setting of the threshold voltage was very difficult. AE behavior of fatigue cracked specimen with fatigue normalized crack length of about 0.8 was measured. However, RMS voltage was almost constant during AE measurement and the AE onset stress could not be observed, because the volume of plastic deformation which causes AE signal is very small and AE activity does not change during AE measurement.
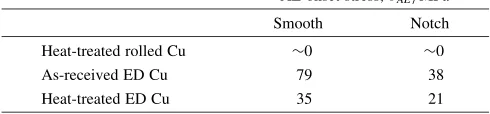
The AE onset stress of each specimen was also estimated and these results were summarized in Table 1. RMS voltage
for heat-treated rolled Cu began to increase with the stress and the AE onset stresses for both smooth and notched specimens were almost zero. The AE onset stress of heat-treated ED Cu was about a half of that of as-received ED Cu. The AE onset stress of a notched specimen was also lower than that of a smooth specimen for ED Cu. It was found that the AE onset stress of the heat-treated ED Cu specimen with notch was low enough to be applied to the smart stress memory patch. RMS voltage for ED Cu for the grain size of a few micrometers did not increase with loading. This result corresponded to the result reported by Vinogradov11)that AE behavior of coarse-grain Cu with mean grain size of 50mm was very active from the beginning of loading, while a few AE signals were observed near the yield point for fine-grained Cu with mean grain size of 200 nm.
AE behaviors of heat-treated rolled and ED Cu specimens with normalized notch length of 0.5 under reloading were also measured, and the result is shown in Fig. 7. RMS voltage
10-10 10-9 10-8 10-7
6 7 8 910 20 30 40 50 60
40MPa R=0.1 40MPa R=0.3 40MPa R=0.5
m=1.06-1.50
(a)
The range of stress intensity factor,
∆K/ MPam1/2
Crack growth rate,
da/dN
/ m/cycle
m=1.02-1.22
(b)
The range of stress intensity factor,
∆K/ MPam1/2
Crack growth rate,
da/dN
/ m/cycle
10-10 10-9 10-8 10-7
6 7 8 910 20 30 40 50 60
50MPa R=0.1 50MPa R=0.3 50MPa R=0.5
Fig. 5 The effect of stress ratio on crack growth behavior of as-received ED Cu under the maximum stress of (a) 40 MPa and (b) 50 MPa.
10-10 10-9 10-8 10-7
1 10 100
R=0.1 R=0.3 R=0.5 master curve
Modified stress intensity factor range,
∆KM/ MPam1/2
Crack growth rate,
da/dN
/ m/cycle
m=3.35
(a)
10-9 10-8 10-7
1 10 100
30MPa 40MPa master curve
Modified stress intensity factor range,
∆KM/ MPam1/2
Crack growth rate,
da/dN
/ m/cycle
m=2.60
(b)
[image:4.595.115.482.73.232.2]Fig. 6 The modified crack growth behavior of (a) as-received and (b) heat-treated ED Cu specimen.
Table 1 AE onset stress of each ED Cu specimen.
AE onset stress,AE/MPa
Smooth Notch
Heat-treated rolled Cu 0 0
As-received ED Cu 79 38
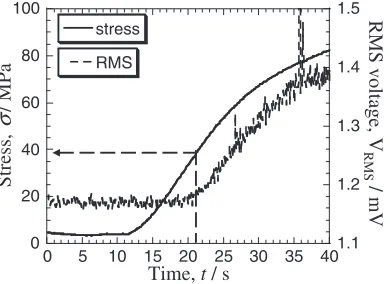
[image:4.595.115.481.275.428.2] [image:4.595.304.549.489.546.2]for heat-treated rolled Cu started at nearly zero stress level during the first loading and AE onset stress during reloading was lower than the previous applied stress. This result showed that Kaiser effect was not observed for the heat-treated rolled Cu specimen. Similar results were reported by Skalskyi for steel and aluminum.12)On the other hand, RMS voltage for heat-treated ED Cu began to increase at the stress of about 20 MPa during the first loading and again at about 40 MPa during reloading. This result demonstrated that the previous maximum stress over 20 MPa could be estimated by heat-treated ED Cu specimen. Furthermore, AE behavior of the notched specimen after fatigue loading was investigated. Figure 8 shows the result under fatigue condition of 40 MPa maximum stress with 100,000 cycles. RMS voltage began to increase at the fatigue maximum stress of 40 MPa and Kaiser effect was successfully observed after fatigue cycles. This result indicates that the applied maximum stress over about 20 MPa could be estimated by AE measurement of the heat-treated ED Cu specimen.
5. Conclusions
In the present paper, we propose a new fatigue sensor called the smart stress-memory patch, which can estimate the cyclic number, the stress amplitude and the maximum stress by measurement of crack length and AE. The fatigue crack growth behavior and AE behavior of ED Cu were inves-tigated and the following conclusions are obtained.
(1) The fatigue crack growth behavior of thin ED Cu specimen was affected by the maximum stress and the stress ratio due to the size effect of a thin and small specimen. The m value of Paris law and the crack growth rate of the specimen were small compared with those of bulk specimen of pure Cu.
(2) The effect of the maximum stress and the stress ratio on crack growth behavior could not be corrected by the conventional effective stress intensity factor. The empirical master curve of crack growth, which included the effect of the maximum stress and the stress ratio, was obtained by the modified stress intensity factor. (3) The AE onset stress of heat-treated ED Cu specimen
with a notch was low enough to be applied to the smart stress memory patch and Kaiser effect was also observed during reloading. The applied fatigue max-imum stress could be successfully estimated by AE measurement of heat-treated ED Cu specimen.
Acknowledgement
The present research is partially supported by a Grant for the 21st Century COE Program ‘‘Human-Friendly Materials based on Chemistry’’ from the Ministry of Education, Culture, Sports, Science, and Technology of Japan.
REFERENCES
1) T. Kobayashi, O. Muragishi and K. Nihei: Key Eng. Mater.261–263 (2004) 1313–1318.
2) Y. Fujimoto, G. Pirker, H. Ito, E. Shintaku and S. Shono: Ship Tech. Res.49(2002) 33–44.
3) Y. Murakami: Stress Intensity Factors Handbook, (Committee on Fracture Mechanics, The Society of Materials Science, Japan, 1987) p. 9.
4) K. Ito and M. Enoki: Mater. Trans.48(2007) 1221–1226.
5) W. Guo, C. H. Wang and L. R. F. Rose: Fat. Fract. Engng. Mater. Struct.22(1999) 437–444.
6) P. Peralta, R. Dickerson, N. Dellan, K. Komandur and M. A. Jameel: J. Eng. Mater. Tech. Trans. Am. Soc. Mech. Eng.127(2005) 23–32. 7) W. Elber: Eng. Fract. Mech.2(1970) 37–45.
8) J. C. Newman, Jr.: Int. J. Fract.24(1984) R131–135.
9) P. C. Paris, H. Tada and J. K. Donald: Int. J. Fatigue21(1999) S35–46. 10) Y. Takahashi: Trans. JSME67-657A(2001) 864–870.
11) A. Vinogradov: Scripta Mater.39(1998) 797–805.
12) V. R. Skalskyi, O. E. Andreikiv and O. M. Serhienko: Mater. Sci.39 (2003) 86–107.
0 10 20 30 40 50 60
0.9 1 1.1 1.2
0 10 20 30 40 50
stress
RMS
Time, t / s
Stress,
σ
/ MPa
RMS voltage, V
RMS
/ mV
(b)
0 10 20 30 40 50 60
0.9 1 1.1 1.2 1.3 1.4 1.5 1.6
0 10 20 30 40 50
stress
RMS
Time, t / s
Stress,
σ
/ MPa
RMS voltage, V
RMS
/ mV
(a)
Fig. 7 Relationship between stress and RMS voltage of (a) heat-treated rolled Cu specimen and (b) heat-treated ED Cu specimen with notch.
0 20 40 60 80 100
1.1 1.2 1.3 1.4 1.5
0 5 10 15 20 25 30 35 40 stress
RMS
Time, t / s
Stress,
σ
/ MPa
RMS voltage, V
RMS
/ mV
[image:5.595.113.484.75.200.2] [image:5.595.74.269.254.396.2]