Development of Low Density Ca-Mg-Al-Based Bulk Metallic Glasses
O. N. Senkov
1;*, J. M. Scott
1and D. B. Miracle
21UES, Inc., 4401 Dayton-Xenia Rd, Dayton, OH 45432, USA
2Air Force Research Laboratory, Materials and Manufacturing Directorate, Wright-Patterson AFB, OH 45433, USA
Low density Ca-Mg-Al-based bulk metallic glasses containing additionally Cu and Zn, were produced by a copper mold casting method as wedge-shaped samples with thicknesses varying from 0.5 mm to 10 mm. The compositions of the alloys were selected using recently developed specific criteria for glass formation. A structural assessment using the efficient cluster packing model was applied and showed a good ability to represent these glasses. Thermal properties of the new metallic glasses, such as the glass transition, crystallization and melting temperatures, as well as heats of crystallization and melting are reported. The effect of the alloy composition on glass forming ability is discussed.
[doi:10.2320/matertrans.MJ200731]
(Received November 14, 2006; Accepted December 25, 2006; Published June 25, 2007)
Keywords: bulk metallic glass, amorphous, calcium-magnesium-aluminum, glass forming ability
1. Introduction
Ca-Mg-based bulk metallic glasses are a relatively new class of amorphous alloys, which attract interest of several research groups for their unique properties.1–10)In particular,
these metallic glasses have the lowest density (2000
kgm3) among all known amorphous metallic alloys. They
also have low Young’s modulus (20{35GPa)11)
compara-ble to the modulus of human bones, low glass transition temperature (Tg 100{150C) and a wide temperature range
of super-cooled liquid (Tx¼TxTg30{70C, where
Tx is the crystallization temperature). It is also noteworthy
that these glassy alloys are based on two simple metals, Ca and Mg, which distinguishes them from all other transition-metal based bulk transition-metallic glasses.12)Most of these
Ca-Mg-based glasses were produced using topological and thermo-dynamic criteria for glass formation, which have recently been developed.5,13–19)By applying these new criteria to
Ca-based alloy systems, favorable glass formation was predicted in the alloys described by formula:
CaA(Y,Ln)B(Mg,Sn)C(Al,Ag,Ga,Zn)D(Cu,Ni,Si)E ð1Þ
where A¼0:40{0:70; B¼0{0:25; C¼0{0:25; D¼0{
0:35; E¼0{0:35; BþCþD0:05; AþBþCþDþ
E¼1; andLnrepresents a metal from the lanthanide group. A strong topological basis exists for the compositions re-presented in Equation (1),13–18)which are also well described by a recently developed structural model for metallic glasses.19,20)
The main drawback of the Ca-based crystalline metallic alloys is their poor oxidation and corrosion resistance. Many Ca-based crystalline alloys are very reactive, even in pure water, and oxidize in air in a matter of days. The amorphous state considerably improves the oxidation and corrosion resistance of these alloys, although these properties also depend on the alloy constitution.21–23) For example, recent
studies of four Ca-Mg-Zn, Ca-Mg-Cu, Ca-Mg-Zn-Cu and Ca-Mg-Al-Zn-Cu metallic glasses have shown that the ternary Ca-Mg-Zn glass has the least oxidation and corrosion resistance. Substitution of Zn with Cu and/or Al improves
these properties, and the alloy containing Al has the best corrosion resistance.23)
Several Ca-Al-based bulk metallic glasses have recently
been reported;7) however, these glasses do not have very
good glass forming ability, and the maximum diameter of fully amorphous rods made of these alloys by a water cooled copper mold casting method generally does not exceed 2 mm. Only two of the reported amorphous alloys, Ca56:5Mg10
-Al28:5Cu5 and Ca56:5Mg10Al28:5Cu5, had a maximum
diam-eter of 3 mm.7)
In the present work we report on several new Ca-Mg-Al-based amorphous alloys with improved glass forming ability. The compositions of these alloys were selected using Equation (1) and recently developed criteria for glass formation. Thermal properties of the new metallic glasses, such as the glass transition, crystallization and melting temperatures, as well as heats of crystallization and melting are reported. The effect of the alloy constitution on glass forming ability and glass stability is discussed.
2. Experimental Procedures
Several Ca-Mg-Al-based alloys, nominal compositions are shown in Table 1, were prepared by induction melting of mixtures of pure elements (99.99% for Al and Cu, 99.9% for Mg and Zn, and 99.5% for Ca) in a water-cooled copper crucible in an argon atmosphere. Each of the produced alloys was then induction re-melted in a quartz crucible with a
17.0 mm inner diameter and an2mm diameter hole in the
bottom of the crucible and cast through this hole into a water-cooled copper mold to produce wedge-like samples of two different dimensions. One type of sample had 6.4 mm width, 35 mm height, and thickness varying from 0.5 mm at the base of the wedge to 3.5 mm at the top of the wedge. Another type of sample had 11 mm width, 50 mm height, and thickness varying from 2 mm at the base of the wedge to 10 mm at the top of the wedge. The time to fill the mold cavity was about
0.5 seconds for smaller samples and 1:0{1:5 seconds for
larger samples. The amorphous or crystalline structure of the cast alloys was identified by X-ray diffraction of powdered
samples using a Rigaku Rotaflex diffractometer, Cu K
radiation, and a differential scanning calorimeter (DSC)
*Corresponding author, E-mail: [email protected].
Q1000, by TA Instruments, Inc. The glass transition,Tg, and
crystallization, Tx, temperatures, the temperatures of start,
Tm, and completion,Tl, of melting, and heats of
crystalliza-tion, Hx, and melting, Hm, of the cast alloys were
determined using DSC scans at a heating rate of 40 K/min.
The maximum thickness, max, at which an alloy remained
fully amorphous after the water-cooled copper mold casting, was determined using X-ray diffraction and DSC patterns of several samples extracted from different-thickness regions of the wedge specimens as a thickness above whichHxstarts
to decrease from its maximum value and sharp peaks from crystalline phases appear on the X-ray diffraction patterns. This method is described elsewhere.8)The weight of samples
used for DSC was in the range of 6 to 15 mg.
3. Experimental Results
3.1 Ternary Ca-Mg-Al Alloys
The ternary alloys were produced with the concentrations of Ca varying from 50 to 75 at% and the concentration of Al varying from 4 to 35 at% (Table 1). The density of these
alloys increases from 1620 kgm3 to 1790 kgm3 with a
decrease in the concentration of Ca and an increase in the concentration of Al. Seven of the nine produced ternary Ca-Mg-Al alloys have marginal glass forming ability, and the
maximum amorphous thickness, max, of these alloys after
casting in a wedge cavity does not exceed 0.5 mm (see Table 1). Two other ternary alloys, Ca65Mg15Al20and Ca70
-Mg15Al15, have better glass forming ability and showmaxof
1.0 mm and 1.5 mm, respectively. Typical X-ray diffraction patterns and DSC heating curves for the ternary alloys in fully amorphous and partially amorphous conditions are shown in Figs. 1(a) and 2(a–b), respectively. Three alloy groups with different crystallization kinetics can be recog-nized. The first group consists of one glassy alloy, Ca55
-Mg15Al30. A DSC pattern of this alloy shows two exothermic
crystallization reactions near 283C and 386C and at least
two endothermic reactions due to alloy melting, with the reaction peaks at 495C and 540C (see Fig. 2). A shallow
[image:2.595.50.548.104.491.2]endothermic reaction is also recognized in the temperature range between 225C and 282C (Tx¼57C), which is due to transition of the glass into a super-cooled liquid state.
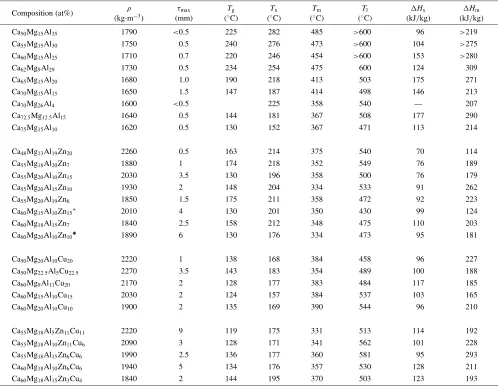
Table 1 Compositions (in at%) of Ca-Mg-Al-based amorphous alloys and their density,, maximum thickness,max, at which these alloys remain fully amorphous during copper mold casting, glass transition,Tg, and crystallization,Tx, temperatures, the temperatures of start,Tm, and completion,Tl, of melting, and heats of crystallization,Hx, and melting,Hm.
Composition (at%)
(kgm3)
max (mm)
Tg (C)
Tx (C)
Tm (C)
Tl (C)
Hx (kJ/kg)
Hm (kJ/kg)
Ca50Mg15Al35 1790 <0:5 225 282 485 >600 96 >219
Ca55Mg15Al30 1750 0.5 240 276 473 >600 104 >275
Ca60Mg15Al25 1710 0.7 220 246 454 >600 153 >280
Ca62Mg9Al29 1730 0.5 234 254 475 600 124 309
Ca65Mg15Al20 1680 1.0 190 218 413 503 175 271
Ca70Mg15Al15 1650 1.5 147 187 414 498 146 213
Ca70Mg26Al4 1600 <0:5 225 358 540 — 207
Ca72:5Mg12:5Al15 1640 0.5 144 181 367 508 177 290
Ca75Mg15Al10 1620 0.5 130 152 367 471 113 214
Ca48Mg13Al19Zn20 2260 0.5 163 214 375 540 70 114
Ca55Mg18Al20Zn7 1880 1 174 218 352 549 76 189
Ca55Mg20Al10Zn15 2030 3.5 130 196 358 500 76 179
Ca55Mg20Al15Zn10 1930 2 148 204 334 533 91 262
Ca55Mg20Al19Zn6 1850 1.5 175 211 358 472 92 223
Ca60Mg15Al10Zn15 2010 4 130 201 350 430 99 124
Ca60Mg18Al15Zn7 1840 2.5 158 212 348 475 110 203
Ca60Mg20Al10Zn10 1890 6 130 176 334 473 95 181
Ca50Mg20Al10Cu20 2220 1 138 168 384 458 96 227
Ca50Mg22:5Al5Cu22:5 2270 3.5 143 183 354 489 100 188
Ca60Mg9Al11Cu20 2170 2 128 177 383 484 117 185
Ca60Mg15Al10Cu15 2030 2 124 157 384 537 103 165
Ca60Mg20Al10Cu10 1900 2 135 169 390 544 96 210
Ca55Mg18Al5Zn11Cu11 2220 9 119 175 331 513 114 192
Ca55Mg18Al10Zn11Cu6 2090 3 128 171 341 562 101 228
Ca55Mg18Al15Zn6Cu6 1990 2.5 136 177 360 581 95 293
Ca60Mg18Al10Zn6Cu6 1940 5 134 176 357 530 128 211
Ca60Mg18Al15Zn3Cu4 1840 2 144 195 370 503 123 193
The alloy is more than 80% amorphous at the thickness of up to 10 mm.
The second group consists of three alloys, Ca62Mg9Al29,
Ca60Mg15Al25, and Ca65Mg15Al20. For these alloys, only one
sharp crystallization peak is observed, which shifts to a lower temperature range and becomes sharper and more intense with a decrease in the amount of Al. The super-cooled liquid range for these alloys is rather narrow (Tx¼36C, 26C,
and 20C, respectively), and the melting temperature
gradually decreases to a eutectic point at 415C (see
Fig. 2 and Table 1). During melting these alloys experience
at least two phase transformations, which result in two sharp endothermic peaks.
In the third group, which consists of Ca70Mg15Al15,
Ca70Mg26Al4, Ca72:5Mg12:5Al15, and Ca75Mg15Al10, several
wide overlapped crystallization peaks are observed in the
temperature range of 180C to 280C (see Figs. 2(a) and
2(b)). Melting of these alloys starts at the same temperature of about 360C and the enthalpy of the first melting peak is
very low, about 8.3 J/g. The second melting peak is much more intense,Hm125J/g, and it starts at near the same temperature of 415C. It is likely that the weak peak at
360C is due to melting of a metastable eutectic and the sharp
peak at415C is due to melting of an equilibrium eutectic,
which is then followed by a gradual melting of a primary phase as the temperature increases from420C to 510C.
At a constant Mg content,Tg,Tx,Tm have a tendency to
decrease with a decrease in the amount of Al and an increase in the amount of Ca in the concentration range of Ca from 50% to 75% for the ternary Ca-Mg-Al alloys (see Table 1).
For example, Tg decreases from240C to 130C and Tx
20 25 30 35 40 45 50
2Θ
Intensity
Ca70Mg15Al15
τ = 2.0 mm
1.5 mm
o o o o o o o (a)
20 30 40 50 60 70
2Θ
Intensity
τ = 10 mm
8 mm
6 mm
4 mm Ca60Mg15Al10Zn15
o o o o o o
(b)
20 30 40 50 60 70
2Θ
Intensity
Ca60Mg18Al10Zn6Cu6
τ= 7 mm
5 mm
2 mm
o o o o o o
(c)
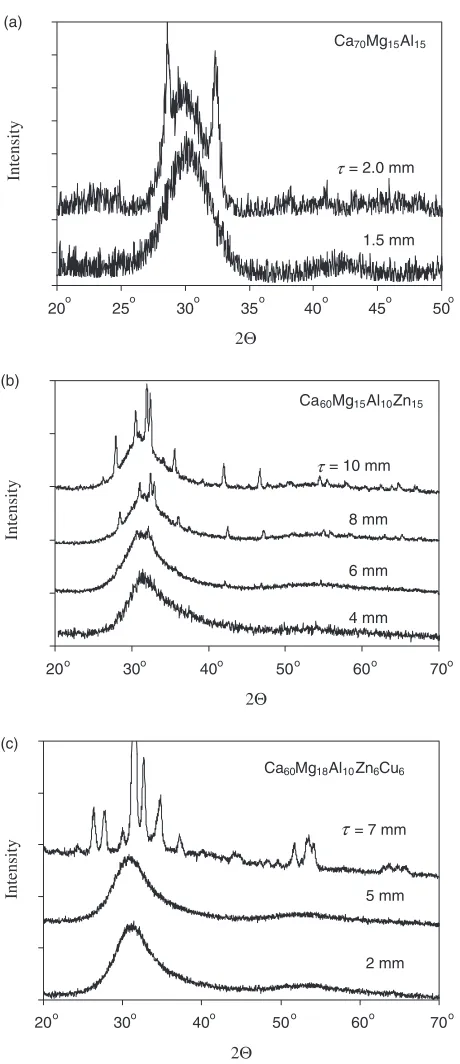
Fig. 1 Typical X-ray diffraction patterns of amorphous and semiamor-phous samples extracted from the regions of different thicknesses (shown in the figures) of the copper mold wedge cast alloys (a) Ca70Mg15Al15, (b)
Ca60Mg15Al10Zn15and (c) Ca60Mg18Al10Zn6Cu6.
-20 -10 0 10 20 30 40
100 200 300 400 500
Temperature, T /oC
Heat Flow,
F
/ W
.g
-1
Ca55Mg15Al30
Ca62Mg9Al29
Ca60Mg15Al25
Ca65Mg15Al20
Ca72Mg13Al15
Ca75Mg15Al10 (a)
-5 0 5 10 15 20
100 200 300 400 500
Temperature, T /oC
Heat Flow,
F
/ W
.g
-1
Ca70Mg15Al15
1.0 mm τ = 2.0 mm
1.5 mm (b)
Fig. 2 DSC patterns of amorphous samples extracted from (a) the regions of the maximum amorphous thicknesses of different Ca-Mg-Al alloys (their compositions are shown in the figure) and (b) the regions of different thicknesses of a Ca70Mg15Al15. The wedge-like alloys were prepared by
casting in a water-cooled copper mold. The DSC patterns were obtained during continuous heating at a heating rate of 40C/min and endothermic
[image:3.595.55.285.67.599.2] [image:3.595.316.541.79.445.2]decreases from280C to 150C in this composition range.
There is, however, no correlation between the maximum
amorphous thickness, max, and Tx, which is used as a
measure of glass stability, or other empirical glass forming ability parameters such as Tg=Tl orTx=ðTgþTlÞ. However,
it can be noted from Table 1 that there is a tendency formax
to increase with a decrease in the melting range Tm¼
TlTm.
3.2 Quaternary Ca-Mg-Al-Zn and Ca-Mg-Al-Cu Alloys
Two types of quaternary alloys were produced, Ca-Mg-Al-Zn and Ca-Mg-Al-Cu (see Table 1). Typical X-ray diffrac-tion patterns of one of these alloys, Ca60Mg15Al10Zn15,
versus the alloy thickness are shown in Fig. 1(b). These patterns illustrate transition of the alloy from a fully amorphous to a partially crystalline state with an increase in the alloy thickness from 4 mm to 10 mm. The Zn con-taining glassy alloys contain 48 to 60 at% Ca, 13 to 20 at% Mg, 10 to 20 at% Al, and 6 to 20 at% Zn and their typical DSC curves are shown in Fig. 3. The Cu-containing alloys have 50 or 60 at% Ca, 9 to 22.5 at% Mg, 5 to 11 at% Al, and 10 to 22.5 at% Cu and their DSC curves are given in Fig. 4. The density of these alloys varies from 1840 to 2270 kgm3.
The density increases with an increase in the amounts of Cu or Zn, and, to a smaller extent, Al and Mg. Ternary Ca-Mg-Zn and Ca-Mg-Cu bulk amorphous alloys recently reported elsewhere,8,24)which have a very good glass forming ability
(max¼10mm), were used as a baseline to design these
quaternary metallic glasses by partial substitution of the alloying elements (mainly Zn or Cu) with Al. The Al addition
to these ternary alloys reduces the maximum amorphous thickness; however, it increases glass stability by increasing bothTgandTx. For the Ca-Mg-Zn and Ca-Mg-Cu alloys,Tg
andTx values change from 80 to 130C and from 112C to
170C, respectively, depending on the alloy composition.8,24) The Cu containing alloys have a critical amorphous thickness within the range of 1 to 3.5 mm, while the Zn
containing alloys have max from 1 to 6 mm. The volume
fraction of the amorphous phase generally rapidly decreases
to zero with an increase in thickness above max.8,24)
However, in two alloys, Ca60Mg15Al10Zn15 and Ca60Mg20
-Al10Zn10, the volume fraction of the amorphous phase, as
estimated from the intensities of the X-ray diffraction peaks and the DSC exothermic peaks, remains above 80% in the specimens with thicknesses of up to 10 mm and 8 mm, respectively. In Ca-Mg-Al-Zn alloys,Tg varies from 130C
to 175C,T
xvaries from 176C to 218C and bothTgandTx
have a tendency to increase with an increase in the Al content. The Ca-Mg-Al-Cu alloys have smaller values ofTg
(124C to 143C) andTx (157C to 183C) and, therefore,
lower glass stability than the Ca-Mg-Al-Zn alloys. The temperature range of a super-cooled liquid for these quaternary alloys is rather large. For example, in Zn-containing alloys it varies from Tx¼36C in Ca55Mg20
-Al19Zn6 to 71C in Ca60Mg15Al10Zn15. In Cu-containing
alloys,Txis between 30C and 49C.
Crystallization of these quaternary amorphous alloys is accompanied by a single or multiple exothermic reactions, depending on the alloy composition (see Figs. 3 and 4). Melting of these alloys occurs in a rather wide temperature range and is generally accompanied by several endothermic peaks. For example, the Ca60Mg20Al10Zn10glass, which has
the best glass forming ability (max¼6mm), hasTl¼Tl
Tm ¼139C, and the second best glass former, Ca60Mg15
-Al10Zn15, has Tl¼80C. It is well established for many
glass forming systems, including Ca-Mg-Zn8,25)and
Ca-Mg--4 -2 0 2 4 6 8
100 200 300 400 500
Temperature, T /oC
Heat Flow,
F
/ W
. g
-1
Ca48Mg13Al19Zn20 Ca60Mg18Al15Zn7 Ca60Mg20Al10Zn10
Ca55Mg20Al10Zn15 Ca60Mg15Al10Zn15
Ca55Mg20Al15Zn10
Fig. 3 DSC patterns of amorphous samples extracted from the regions of maximum amorphous thicknesses of the copper mold wedge cast Ca-Mg-Al-Zn alloys. The alloy compositions are shown in the figure and their glass transition, crystallization and melting temperatures, as well as maximum amorphous thicknesses, are given in Table 1. The DSC patterns were obtained during continuous heating at a heating rate of 40C/min and
endothermic reactions are directed up.
-8 -4 0 4 8 12
100 200 300 400 500
Temperature, T /oC
Heat Flow,
F
/ W
.g
-1
Ca60Mg20Al10Cu10
Ca60Mg15Al10Cu15
Ca60Mg9Al11Cu20
Ca50Mg22.5Al5Cu22.5
Fig. 4 DSC patterns of amorphous samples extracted from the regions of maximum amorphous thicknesses of the copper mold wedge cast Ca-Mg-Al-Cu alloys. The alloy compositions are shown in the figure and their glass transition, crystallization and melting temperatures, as well as maximum amorphous thicknesses, are given in Table 1. The DSC patterns were obtained during continuous heating at a heating rate of 40C/min and
[image:4.595.57.282.71.331.2] [image:4.595.312.540.75.256.2]Cu,24)that the best glass forming alloys have a near-eutectic composition and slow crystallization kinetics. The fact that the majority of the developed Zn and Ca-Mg-Al-Cu glassy alloys have a very wide melting range indicate that their compositions are far from the eutectic composition, and even better glass forming ability and larger maximum amorphous thicknesses are expected in optimized alloy compositions with a considerably reduced melting range.
3.3 Quintenary Ca-Mg-Al-Zn-Cu Alloys
The composition of quintenary metallic glasses produced in this work is given in Table 1 and their typical DSC patterns are shown in Fig. 5. A very good glass forming alloy, Ca55Mg18Zn11Cu16, which has been reported to have a
maximum amorphous thicknessmax>10mm,10) was used
as a starting point; and from 5 to 15% Al, as well as up to 5% Ca, were added to this alloy to partially replace Cu and Zn and reduce the density. Without Al, this alloy hasTgandTxof
100C and 166C, respectively, and the density of 2320
kgm3. Substitution of every 1 at% of Cu and/or Zn with Al
and Ca decreases the density of this alloy by1% and 1.5%,
respectively. For example, the densities of Ca55Mg18
-Al15Zn6Cu6 and Ca60Mg18Al15Zn3Cu4 alloys are 1990
kgm3 and 1840 kgm3, respectively (see Table 1).
How-ever, glass forming ability rapidly reduces with Al addition.
For example, partial replacement of Cu in Ca55Mg18
-Zn11Cu16 with 5 at% Al decreases the max to 9 mm in a
Ca55Mg18Al5Zn11Cu11 alloy. A further increase in Al to 10
and 15 at% decreasesmaxto 3 mm and 2.5 mm, respectively,
in Ca55Mg18Al10Zn11Cu6 and Ca55Mg18Al15Zn6Cu6 alloys.
At the same time, substitution of 5 at% Al with Ca in the latter alloy leads to a Ca60Mg18Al10Zn6Cu6 alloy with
doubled glass forming ability (max¼5mm) and lower
density of 1940 kgm3 (see Table 1). X-ray diffraction
patterns of this alloy at different thicknesses are shown in Fig. 1(c). Only a diffuse amorphous halo is present atup to 5 mm; however, a number of peaks from crystalline phases are present on the X-ray diffraction pattern from a 7-mm thick region. Although it reduces the glass forming ability, addition of Al considerably improves the glass stability by increasingTgandTx(see Table 1 and Fig. 5). For example,
in the alloy Ca55Mg18Al15Zn6Cu6TgandTxare about 36C
and 11C higher than in Ca
55Mg18Zn11Cu16. The temperature
range of super-cooled liquid has a tendency to slightly decrease with an increase in Al and it is in the range of
Tx ¼41{56C.
Addition of Al changes the crystallization and melting patterns of the Ca55Mg18Zn11Cu16 glassy alloy (see Fig. 5).
Crystallization of the amorphous alloy without Al starts at
166C and produces a sharp exothermic peak with a
maximum at 171C, which is followed by a smaller
exothermic peak at210C. Melting of this alloy occurs in a
rather narrow temperature range by a single endothermic reaction, indicating that the alloy may have a near eutectic composition. When 5% Cu is replaced with Al (Ca55Mg18
-Al5Zn11Cu11alloy), both crystallization peaks become wider
and their maxima occur at higher temperatures, 184C and
235C, respectively. Such behavior indicates that Al reduces
the crystallization kinetics. Melting also occurs at higher temperatures and is accompanied by multiple endothermic reactions within about twice wider temperature range in the melting range.
The first crystallization reaction suppresses to a larger extent with further addition of Al up to 10 and 15 at% in place of Cu and Zn (Ca55Mg18Al10Zn11Cu6 and Ca55Mg18Al15
-Zn6Cu6glasses), while intensity of the second crystallization
reaction almost does not change (see Fig. 5). In addition, a third crystallization reaction occurs in these two alloys just prior melting and the melting temperature increases with an increase in Al content. The first melting reaction in the alloys with 10 and 15% Al starts rather slow; the reaction rate gradually increases to a maximum value and then abruptly decreases to almost zero. After that, a weak and shallow melting reaction is observed in a wide temperature range, probably due to gradual melting of a primary phase.
Crystallization becomes even more complex in the Ca60Mg18Al15Zn3Cu4 glass with an increased amount of Ca
and at least 5 crystallization exothermic peaks are recognized on a DSC pattern of this alloy. The melting range in the
quintenary glasses is very wide, between 112C for Ca
60
-Mg18Al15Zn3Cu4 and 221C for Ca55Mg18Al15Zn6Cu6. This
provides an opportunity to design even better glass forming alloys in this system by modifying the composition and reducing the temperature interval for melting (solidification).
4. Structural Description of the Ca-Mg-Al-based
Glasses
Insights into the influence of compositional changes on likely structural changes are provided by the efficient cluster packing (ECP) model.19,20)In this view, a structural scaffold is comprised of interpenetrating solute-centered clusters formed with the largest solute,, and in which solvent atoms -8
-6 -4 -2 0 2 4 6 8 10 12
100 200 300 400 500
Temperature, T /oC
Heat Flow,
F
/ W
.g
-1 Ca55Mg18Al5Zn11Cu11
Ca55Mg18Al15Zn6Cu6 Ca55Mg18Al10Zn11Cu6 Ca55Mg18Zn11Cu16
Ca60Mg18Al15Zn3Cu4
Fig. 5 Figure 5. DSC patterns of amorphous samples extracted from the regions of maximum amorphous thicknesses,max, of the copper mold wedge cast Ca-Mg Al-Zn-Cu alloys. The alloy compositions are shown in the figure and their glass transition, crystallization and melting temper-atures are given in Table 1. A DSC pattern from a base-line Ca55Mg18Zn11Cu16 glassy alloy with ¼10mm is also shown. The
[image:5.595.57.283.71.281.2]() dominate the 1st coordination shell. Theclusters are organized at positions that approximate those of an fcc structure over a limited length scale of several cluster diameters, beyond which recognizable order of the cluster positions is probably lost. This structure has two additional progressively smaller sites;sites occur at the center of an octahedron of-centered clusters, andsites are at the center of a tetrahedron ofclusters. There are oneand twosites
for every site. It is assumed that sites are filled by
solutes, but and sites can be progressively filled by any solute. A small number of solutes may also occupysites. A nomenclature describes the structure by the local
coordina-tion numbers of , and solutes, hN;N;Ni, as
determined from the relative solute sizes. The chemical descriptions for metallic glasses used here give the solvent species first, followed by solutes in order of decreasing size. Solutes with nearly equivalent sizes are listed in parentheses to indicate that they are topologically identical and are likely to occupy the same structural sites. Atomic compositions are listed in atomic percent following each atomic species in the alloy. Additional details of the ECP model and justification for these basic assumptions are given elsewhere, along with an assessed table of atomic radii for metallic glass struc-tures.20)
The putative number of Ca atoms that can efficiently pack around a Mg atom is10, and around an Al atom is9, so that Ca-Mg-Al ternary glasses have h10;9i structures. A composition of Ca70Mg15Al15 is calculated when all the
and sites are filled by Mg and Al, respectively, and no
solutes occupy thesites. Two of the Ca-Mg-Al glasses have solute concentrations slightly lower than this amount (Table 1), so that a small fraction of the sites are likely to have no solutes in these glasses. Another two have total solute concentrations of 30%, so that all of theandsites are expected to be filled. In Ca70Mg15Al15, theandsites
are suggested to be filled by Mg and Al, respectively. In Ca70Mg26Al4, thesites are filled by Mg, and thesites are
mostly occupied by Mg with a fraction occupied by Al. A series of 4 glasses have compositions Cað85xÞMg15Alx,
where x¼20, 25, 30 and 35. This approximates a series
where the sites become progressively filled with Al. Even
though the sites remain fully occupied by Mg, the
concentration of Mg decreases as thesites are filled, since the number of structural sites increases in this series while the number of Mg () sites remains constant. Thus, Ca54Mg11
-Al35is calculated for a glass where all thesites are occupied
by Mg and all of theandsites are occupied by Al. A small
but increasing number of Mg solutes occupyor sites in
this series. The most solute-rich glass in this series likely has
a small number of solutes occupying positions, since the
total solute concentration (50%) exceeds the total number of solute sites in this structure (46%).
Ca-Mg-(Al,Zn) alloys are h10;9i topological ternary
glasses, since the radius ratios of Al and Zn relative to the radius of Ca are within about 2% of each other (0.726 and 0.701, respectively). The Mg contents range from 13–20% in the Ca-Mg-(Al,Zn) glasses studied here, and the sum of Al+Zn concentrations ranges from 20–39% (Table 1). These glasses are thus topologically similar to the Ca-Mg-Al glasses just described. Thesites are filled by Mg, and the
andsites are filled by combinations of Mg, Al and Zn. The most solute-rich glass, Ca48Mg13(Al19Zn20), will also have
some number of solute anti-site defects onsites.
Ca-Mg-Al-Cu alloys are topological quaternary glasses with a h10;9;8i structural designation. A composition of Ca61Mg13Al13Cu13 is estimated when theand sites are
filled by Mg and Al, respectively, and the sites are half-filled with Cu. The three solute-lean glasses studied here in this family of alloys (Table 1) fit this model closely, with some small fraction of the solutes occupying solute sites other than the preferred, or ‘native’ sites. When all of the
sites are filled by Cu, the ECP model gives a composition of Ca54Mg11:5Al11:5Cu23. The two solute-rich glasses in this
family are close to this composition, again with some substitutions amongst the solute sites and a small number of
sites occupied by solutes in excess of those that can be
accommodated on,and sites.
Ca-Mg-(Al,Zn)-Cu are h10;9;8i topological quaternary
glasses, where Mg occupiespositions, Al and Zn occupy
positions and Cu occupies positions as preferred sites. In the two compositions where the Ca concentration is 55% (Table 1), the,andsites are filled by solutes. A fraction of theorsites are not occupied by solutes in glasses where the Ca concentration is 60%.
At present, it is not possible to make clear comments regarding influence of site occupancy or site filling on glass stability, as a sufficient database relating these features in a chemically and topologically broad range of glasses has not yet been constructed. More importantly, chemical effects are expected to exert an important influence on glass stability, but chemical contributions to stability are still not under-stood. Thus, the structural descriptions given here provide general guidance in alloy selection through assessment of the spatial relationships between atoms, but it is not presently able to estimate structural stability.
5. Conclusions
Several low density bulk metallic glasses were produced in Ca-Mg-Al, Ca-Mg-Al-Zn, Ca-Mg-Al-Cu and Ca-Mg-Al-Zn-Cu alloy systems. The maximum fully amorphous thickness of max¼9mm was achieved in a Ca55Mg18Al5Zn11Cu11
alloy. Two alloys, Ca60Mg20Al10Zn10 and Ca55Mg18Al5
-Zn11Cu11havemaxfrom 5 to 6 mm, eleven alloys havemax
from 2 to 4 mm, and 5 alloys havemaxof 1.0 to 1.5 mm. An
addition of Al usually reduces the glass forming ability, but it improves the glass stability by increasing Tg and Tx. The
glassy alloys developed in this work have a wide temperature interval for solidification, which indicates that their compo-sitions are rather far from eutectic points. It is therefore expected that even better glass former can be found in these alloy systems by modifying the compositions in order to reduce the solidification temperature range.
The compositions of these alloys provide efficiently packed cluster structures. Application of the efficient cluster packing model suggests that these glasses are formed by efficiently-packed Mg-centered clusters where Al and Zn are preferred at cluster-octahedral sites, and Cu is native to
cluster-tetrahedral sites. A significant amount of
supported in this family of glasses. Al and Ca-Mg-(Al,Zn) are represented ash10;9itopological ternary glasses,
while Ca-Mg-Al-Cu and Ca-Mg-(Al,Zn)-Cu are h10;9;8i
topological quaternary glasses.
Acknowledgements
This work was conducted at the Air Force Research Laboratory, Materials and Manufacturing Directorate, under an on-site contract No. FA8650-04-D-5233.
REFERENCES
1) K. Amiya and A. Inoue: Mater. Trans. JIM43(2002) 81–84. 2) K. Amiya and A. Inoue: Mater. Trans. JIM43(2002) 2578–2581. 3) O. N. Senkov and J. M. Scott:MRS Proceedings, Vol. 806, (Materials
Research Society, Warrendale, PA, 2003) pp. 145–150. 4) O. N. Senkov and J. M. Scott: Mater. Lett.58(2004) 1375–1378. 5) O. N. Senkov and J. M. Scott: Scripta Materialia50(2004) 449–452. 6) E. S. Park and D. H. Kim: J. Mater. Research19(2004) 685–688. 7) F. Q. Guo, S. J. Poon and G. J. Shiflet: Appl. Phys Lett.84(2004) 37–
39.
8) O. N. Senkov and J. M. Scott: J. Non-Cryst. Solids351(2005) 3087– 3094.
9) E. S. Park, W. T. Kim and D. H. Kim: Mater. Sci. Forum475–479
(2005) 3415–3418.
10) O. N. Senkov, D. B. Miracle and J. M. Scott: Intermetallics14(2006) 1055–1060.
11) V. Keppens, Z. Zhang, O. N. Senkov and D. B. Miracle: Phil. Mag.87
(2007) 503–508.
12) A. Inoue: Acta Metarialia48(2000) 279–306.
13) O. N. Senkov and D. B. Miracle: Mater. Res. Bull.36(2001) 2183– 2198.
14) O. N. Senkov, D. B. Miracle and S. Rao:MRS Proceedings, Vol. 754, (Materials Research Society, Warrendale, PA, 2003) pp. 145–150. 15) O. N. Senkov and D. B. Miracle: U.S. Patent No. 6,623,566; 23
September 2003.
16) D. B. Miracle and O. N. Senkov: Mater. Sci. Eng. A347(2003) 50–58. 17) D. B. Miracle, W. S. Sanders and O. N. Senkov: Phil. Mag.83(2003)
2409–2428.
18) O. N. Senkov, D. B. Miracle and H. M. Mullens: J. Appl. Phys.97
(2005) 103502.
19) D. B. Miracle: Nature Materials3(2004) 697–702. 20) D. B. Miracle: Acta Materialia54(2006) 4317–4336.
21) M. L. Morrison, R. A. Buchanan, O. N. Senkov, D. B. Miracle and P. K. Liaw: Metall. Mater. Trans. A37A(2006) 1239–1245. 22) B. R. Barnard, P. K. Liaw, R. A. Buchanan, O. N. Senkov and D. B.
Miracle: Mater. Trans.48(2007) 1877–1885.
23) J. E. Dahlman, O. N. Senkov, J. M. Scott and D. B. Miracle: Mater. Trans.48(2007) 1857–1861.
24) O. N. Senkov, J. M. Scott and D. B. Miracle: J. Alloys Compounds424
(2006) 394–399.