Munich Personal RePEc Archive
Date Stamping Bubbles in Real Estate
Investment Trusts
Escobari, Diego and Jafarinejad, Mohammad
The University of Texas Rio Grande Valley
19 October 2015
Online at
https://mpra.ub.uni-muenchen.de/67372/
1
Date Stamping Bubbles in Real Estate Investment Trusts
(The Quarterly Review of Economics and Finance, Forthcoming)
Diego Escobari† Mohammad Jafarinejad‡
October 19, 2015
Abstract
We test for the existence of single and multiple bubble periods in four Real Estate Investment Trust (REIT) indices using the Supremum Augmented Dickey-Fuller (SADF) and the Generalized SADF. These methods allow us to estimate the beginning and the end of bubble periods. Our results provide statistically significant evidence of speculative bubbles in the REIT index and its three components: Equity, Mortgage and Hybrid REITs. These results may be valuable for real estate financial managers and for investors in REITs.
JEL Classification: C22; G12
Keywords: Generalized Sup ADF; Real Estate; REITs; Speculative Bubbles
† Department of Economics and Finance, The University of Texas Rio Grande Valley, Edinburg, TX 78539.
Phone (956) 665-2104, Email: diego.escobari@utrgv.edu, URL: http://diegoescobari.com
‡ Department of Economics and Finance, The University of Texas Rio Grande Valley, Edinburg, TX 78539.
2
1. Introduction
Academics have suggested and employed various time series methods to capture speculative
bubbles in asset prices such as integration and cointegration tests (Diba and Grossman, 1988a
and 1998b), variance bound tests (LeRoy and Porter, 1981 and Shiller, 1981), specification tests
(West, 1987) as well as Chow and CUSUM-type tests (Homm and Breitung, 2012). The new
recursive flexible window right-tailed ADF testing procedure introduced in Phillips, Wu and Yu
(2011) and further enhanced in Phillips, Shi and Yu (2015) outperforms preceding methods in
detecting and date-stamping bubbles and can serve as a real-time warning signal to monitor the
dynamics of asset prices.
In this paper, we employ the Phillips, Shi and Yu (2015)’s novel Generalized Supremum
Augmented Dickey-Fuller (GSADF) to test for the existence of speculative bubbles and to
identify the origination and the collapse of bubbles in various Real Estate Investment Trust
(REIT) indices.1 Specifically, we search for explosive autoregressive behavior in
inflation-adjusted REIT indices from January 1980 through September 2013. We also explain the
conditions under which empirical evidence of explosive behavior can be interpreted as a bubble
in the price of the underlying financial asset.
The literature on testing for speculative bubbles in REITs is limited and the results are mixed.
Jirasakuldech, Campbell and Knight (2006) use unit root and co-integration tests to find that
Equity REITs are not affected by rational bubbles. Waters and Payne (2007) use the
Residuals-Augmented Dickey-Fuller (RADF) and find no periodically collapsing bubble in total REIT
index and Equity REIT index, negative periodically collapsing bubble in Mortgage REIT index
1
3
and inconclusive results for Hybrid REIT index. Moreover, Payne and Waters (2007) use both
Momentum Threshold Autoregressive (MTAR) and RADF to find mixed results for Equity REIT
index. Anderson, Brooks and Tsolacos (2011) use regime switching processes (Evans, 1991; van
Norden and Schaller, 1999) to directly test for the presence of speculative bubbles in REITs.
Although they find some evidence of negative bubbles (most notably in mortgage REIT index),
the authors could not observe speculative bubbles in Equity, Mortgage and Hybrid REITs.
There exists important work on the link between REITs, stocks, and real estate markets as
well as on speculative bubbles on real estate prices. Goodman and Thibodeau (2008) aim at
disentangling the roles of economic fundamentals and speculation on the high house appreciation
rates during 2000-2005, while Mikhed and Zemčík (2009) detect bubbles using panel data on
price-rent ratios for the 1975-2006 period and Escobari, Damianov and Bello (2015) propose a
time series test to identify housing bubbles. Moreover, Himmelberg, Mayer and Sinai (2005)
explain how to assess whether there is a bubble and what underlying factors support housing
demand, while Damianov and Escobari (2015) examine the dynamics of price segments during
the housing bubble. In a related study, Hendershott, Hendershott and Ward (2003) summarize
some evidence on price movements to present arguments for and against the existence of
irrational bubbles.2
On the links between REITs, stocks, and real estate markets, it is important to keep in mind
that REIT is not a pure real estate asset. Glascock, Lu and So (2000) use cointegration and vector
error correction models to show that starting in the early 1990s REITs behave more like stocks
and less like bonds. In addition, Clayton and MacKinnon (2003) examine the link between
REITs, financial assets and real estate returns. They show that during the 1970s and 1980s the
behavior of REITs was closer to large cap stocks but during the 1990s REITs were more strongly
2
4
related to real-estate related factors and small cap stocks. Nneji, Brooks and Ward (2013) present
a multivariate bubble model to evaluate whether the stock and real estate bubbles spill over into
REITs. Their results suggest a transmission of speculative bubbles from the real estate into
REITs. Although these studies suggest the existence of links between REITs, stocks, bonds, and
real estate markets, our empirical approach to study bubbles does not allow us to draw inferences
on any potential connection.
Our results show evidence of four statistically significant speculative bubbles in the
inflation-adjusted REIT value-weighted index (August to November of 1990; February to April of 1993;
October 1996 to April 1998; November 2003 to June 2007). When extending the analysis to
three different components of the total REIT index, we find evidence of speculative bubbles in
all three. For Equity REIT index, which is the major component of the total REIT index, the
results show that the bubble periods are identical to the total index. For Mortgage REIT index,
we find evidence of four periodic bubbles (January to May 1983; September 1996 to November
1997; May to August 2001; May 2003 to April 2004) while for Hybrid REITs index we find
evidence of three periodic bubbles (November 1996 to February 1998; November 2002 to April
2004; August 2006 and collapses May 2007).
In sum, the contribution of this study is twofold. First, it empirically tests for the existence of
speculative bubbles in total REIT index as well as its three components (Equity REITs,
Mortgage REITs and Hybrid REITs). Second, it estimates the beginning and the end of bubble
periods in REITs with the GSADF methodology that allows for the existence of multiple bubbles
5
The reminder of this paper proceeds as follows. Section 2 describes the sample data. Section
3 presents the empirical approach employed to detect and date-stamp periodic bubbles in REITs.
Section 4 discusses the results while Section 5 concludes.
2. Data
Real Estate Investment Trusts are dividend-paying stocks that mainly invest in real estate.
The REIT index is comprised of three components: Equity REITs, Mortgage REITs and Hybrid
REITs. The Equity REIT index includes securities backed by the value of real estate assets (e.g.
shopping malls, office buildings or apartments) and generates revenues mainly from their
properties’ rent. The Mortgage REIT index is backed by residential and commercial mortgage
obligations and mortgage-backed securities. Since Mortgage REITs do not own real estate assets,
their main source of revenues is the interest that they earn on the mortgage loans. The Hybrid
REIT index is a combination of Equity and Mortgage REITs.
The monthly REIT value-weighted index is obtained from CRSP/Ziman Real Estate Data
Series. The database provides stock prices for individual REITs trading on the NASDAQ, New
York Stock Exchange (NYSE) and NYSE MKT (formerly known as the American Stock
Exchange). The Consumer Price Index (CPI) is obtained from the Federal Reserve Bank of St.
Louis. We divide the REIT monthly value-weighted index by CPI to adjust for the inflation over
the sample period. The sample covers the period from January 1980 to September 2013
comprising 405 monthly observations.
Table 1 reports the descriptive statistics along with two measures of concentration based on
6
concentration ratio (Con. Ratio).3 Both measured were obtained from CRSP/Ziman Real Estate
Data Series. The HHI can range from 0 to 10,000 while the concentration ratio goes from 0% to
100%. Higher values indicate a higher level of concentration. The Total REIT index is the less
concentrated index with a HHI of 217.649 and concentration ratio of 18.495%. The Equity REIT
index has very similar values. On the other hand, the Mortgage REIT index may be classified as
moderately concentrated with a HHI of 1944.359 and a concentration ratio of 67.511%. The
highest levels of concentration appear in the Hybrid REIT index where the largest four securities
have a share of about 81.40% of the entire portfolio.
[Table 1, here.]
Figure 1 shows the four real (inflation-adjusted) REIT value-weighted indices (Total REIT
Index, Equity REIT Index, Mortgage REIT Index and Hybrid REIT Index) from January 1980 to
September 2013. It is notable that since January 1980, REITs prices have been increasing for
most of the years. It is at the turn of the century where REIT index experience a large run up that
peaks in early 2007 and collapses shortly after. In fact, between 2007 and 2009, REITs prices
dropped to the levels observed a decade earlier.
[Figure 1, here.]
3
7
The Equity and Hybrid REIT indices have a relatively closer price movement to the total
REIT index than Mortgage REIT index. As illustrated in Figure 1, the time series variation in all
three indices between early 1995 and late 1999 is consistent with the existence of a speculative
bubble. During this period, the Mortgage REIT index appears to have experience the largest
bubble from all four series in the figure. Moreover, there is evidence of a second bubble period
that starts in the early 2000. During this apparent second bubble, the Mortgage REIT index
appreciates faster and reaches its peak relatively earlier that the other indices, and also collapse
earlier and faster than the Equity and Hybrid REIT indices. Lastly, in the post crisis period,
Equity and Hybrid REITs have a sharper recovery compare to Mortgage REITs. In 2013, the
Equity REIT index reached and the Hybrid REIT index surpassed their respective pre-crisis
peaks. The Mortgage REIT index, however, has approximately reached levels of only about half
of its peak reached around 2004 and 2005.
3. Empirical Strategy
To test for explosive behavior and date stamp the beginning and the end of the bubble
periods we start with the following Augmented Dickey-Fuller ( ) regression equation,
(1)
where is the corresponding Real REIT index, denotes first differences, and the error term
is assumed to follow a normal distribution, i.e., . The subscripts and are
the fractions of the total sample size that specify the starting and ending points of a subsample
8
We are interested in testing the unit root null hypothesis against the alternative of mildly
explosive behavior in . The corresponding test statistics is . Notice
than is the well known standard test statistic. To detect episodes of explosive
behavior, Phillips, Wu and Yu (2011) propose a recursive procedure on the estimation of
using different subsample of data. The test statistic is defined as the supremum value of the
as defined by,
(2)
The idea is that when the statistic exceeds the right tale critical value, the unit root null
hypothesis is rejected in favor of explosive behavior. Homm and Breitung (2012) using
simulations find that the has greater power that the methods in Bhargava (1986), the
modified Busetti and Taylor (2004) and the modified Kim (2000). Moreover, Phillips, Shi and
Yu (2015) argue that this procedure can detect exuberance that may arise from a variety of
sources including mildly explosive behavior that may be induced by changing fundamentals such
as the time varying discount factor. Appendix A follows Phillips, Shi and Yu (2015) to explain
some conditions under which empirical evidence of explosive behavior may be used to conclude
the existence of bubbles.
While performs well for a single boom and bust in a series, it may not consistently
identify multiple bubbles. Phillips, Shi and Yu (2015) propose the Generalized ( )
to deal with multiple episodes of boom and bust. The methodology is designed to use a
rolling and recursive sample, covering a larger number of subsamples than the by
allowing both, the ending point ( ) and the initial point ( ) to change. The statistic is
9
(3)
Rejection of the null in favor of the explosive alternative hypothesis requires that is
greater than the right tail critical value.
To date stamp the beginning and the end of the bubble Phillips, Shi and Yu (2015) suggest
obtaining the Backward Sup ( ) statistic,
(4)
to then use the first observation in which the exceeds its critical value as the beginning
of the bubble,
(5)
and the first observation after in which falls below its critical value as the end
of the corresponding bubble episode,4
(6)
where denotes the critical value of the based on observations
and at a significance level .5 The distributions of the statistics and in
equations 3 and 4 are non-standard, hence we will use Monte Carlo simulations to obtain the
critical values.
4. Results
We obtain the SADF and GSADF statistics as described in equations 2 and 3 for the real
(inflation-adjusted) REIT value-weighted index and its three components: Equity REITs,
4
We use as we identify bubble that lasts at least three months. 5
10
Mortgage REITs and Hybrid REITs. Table 2 reports the estimation results, the SADF and
GSADF test statistics, as well as the 90%, 95% an 99% critical values for the two tests that we
obtained using Monte Carlo simulations with 2000 replications (sample size is 405 and the
smallest window is 8 or 2% of the sample). For the total REIT index, both SADF and GSADF
exceed their 1% and 5% right-tail critical value, respectively (SADF: 4.936 > 2.217 and GSADF:
4.936 > 3.796). These results remain robust for the Equity REIT index (SADF: 5.267 > 2.217
and GSADF: 5.267 > 3.796) and Hybrid REIT index (SADF: 4.778 > 2.217 and GSADF: 4.778
> 3.796). For Mortgage REIT index, while SADF exceed its 1% right-tail critical value (SADF:
2.986 > 2.217), GASDF is below its right-tail critical values. Overall, the SADF test statistics
provide statistically significant evidence of explosive behavior in all four inflation-adjusted
REIT indices. Moreover, the GSADF provide statistically significant evidence for the existence
of multiple bubbles in the total REIT index as well as in the Equity REIT and Hybrid REIT
indices. Note that the rolling windows used in by the SADF in equation 2 are a subsample of the
windows used by the GSADF in equation 3. This explains why the SADF and GSADF statistics
are both the same in our REIT indices.
[Table 2, here.]
Figure 2 plots the recursive BSADF statistics against their corresponding 95% critical value
sequences to identify four bubble episodes in the REITs index; the first two are relatively short,
one from August to November of 1990 and another one from February to April of 1993. The
third bubble begins in October 1996 and bursts in April 1998. In 1998, the rise in
11
2007). The most recent bubble is the longest-lasting one, as BASDF estimates its origination in
November of 2003 and its termination in June of 2007.
[Figure 2, here.]
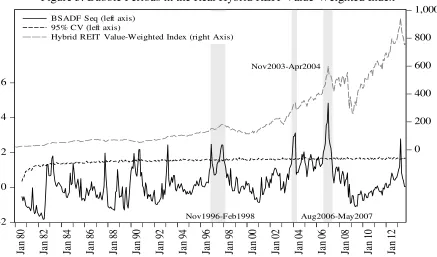
Figures 3, 4 and 5 follow the same procedures, as described in Equations 1 through 6, to
identify episodes of speculative bubbles in the Equity, Mortgage and Hybrid REITs,
respectively. Since the Equity REIT index is the major component of the total index, the four
bubble periods identified in the Equity REIT index are identical to bubbles observed in the total
index (Figure 3). Mortgage REIT index shows four periodic bubbles (Figure 4); the first one is
relatively short, lasting from January to May 1983. The second one is the largest and lasts longer
than a year from September 1996 to November 1997. The third bubble is relatively short, from
May to August 2001, while the last bubble begins in May 2003 and lasts until April 2004.
Hybrid REIT index exhibits three periodic bubbles (Figure 5); the first one begins in November
1996 and lasts until February 1998. The second and the shortest bubble lasts from November
2002 to April 2004, while the last bubble begins in August 2006 and collapses May 2007.
[Figure 3, here.]
[Figure 4, here.]
12
5. Conclusion
This paper is the first study to employ the new recursive flexible window right-tailed ADF
testing procedure introduced in Phillips, Wu and Yu (2011) and further enhanced in Phillips, Shi
and Yu (2015) to empirically detect and date-stamp the origination and the collapse of
speculative bubbles in REITs. Each speculative bubble originates when the Backward Supremum
Augmented Dickey Fuller (BSADF) statistic exceeds its corresponding 95% critical value, and
ends when its BSADF falls below that critical value.
Using data from January 1980 to September 2013, we first examine the Inflation-Adjusted
REIT value-weighted index to find evidence of four speculative bubbles (August to November of
1990; February to April of 1993; October 1996 to April 1998; November 2003 to June 2007).
We further extend the analysis to three different components of the total REIT index separately
and find speculative bubbles in all three indices. For the Equity REIT index the results show
evidence of identical bubble periods to the total index. For the Mortgage REIT index, we find
evidence of four periodic bubbles (January to May 1983; September 1996 to November 1997;
May to August 2001; May 2003 to April 2004) and for the Hybrid REIT index, the data find
evidence of three periodic bubbles (November 1996 to February 1998; November 2002 to April
2004; August 2006 and collapses May 2007).
Our results may be valuable for real estate financial managers and for investors in REITs as
Phillips, Shi and Yu (2015) argue that the approach is anticipative as an early warning alert
system. However, it is important to keep in mind that even when working with real time data, the
13
Appendix A
One key benefit of using the SADF and the GSADF to test for explosive behavior and
interpret this as existence of bubbles is that we do not need to observe fundamentals. However,
one drawback is that empirical evidence of explosive behavior may not necessarily imply the
existence of bubbles. For example, if the income stream is growing unexpectedly faster than
previously the methods may lead to mistakenly conclude that there is a bubble. To formalize this
idea, define a bubble as the difference between the after-dividend price of an asset and the
market fundamental , i.e., . Then the market fundamentals simply follow the
asset pricing equation:
(6)
where is the risk-free interest rate, is the payoff or dividend received from the asset, and
represents the unobserved fundamentals. Under no bubbles, the degree of stationarity of is
entirely determined by the degree of stationarity of . That is, following equation 6 it would
depend on the character of the dividend series and the unobserved fundamentals. For example, if
the dividend series is integrated of order one and the fundamentals are either stationary or
integrated of order one, then the asset price is at most integrated of order one. If the bubble series
satisfy the submartingale property , asset prices will be explosive in the
presence of bubbles. Hence, if the dividend series is stationary after differencing and the
unobserved fundamentals are at most integrated of order one, then empirical evidence of
explosive behavior, as obtained with the SADF and GSADF, may be used to conclude the
14
References
Anderson, K., Brooks, C., & Tsolacos, S. (2011). Testing for periodically collapsing rational speculative bubbles in US REITs. Journal of Real Estate Portfolio Management 17(3), 227-241.
Bhargava, A. (1986). On the theory of testing for unit roots in observed time series. Review of Economic Studies 53(3), 369-384.
Busetti, F., & Taylor, A.M.R. (2004). Tests for the stationarity against a change in persistence. Journal of Econometrics 123(1), 33-66.
Case, K. E., & Quigley, J. M. (2008). How housing booms unwind: income effects, wealth effects, and feedbacks through financial markets. European Journal of Housing Policy, 8(2), 161-180.
Case, K. E., Quigley, J. M., & Shiller, R. J. (2013). Wealth effects revisited: 1975-2012 (No. w18667). National Bureau of Economic Research.
Diba, B. T., & Grossman, H. I. (1988a). Explosive rational bubbles in stock prices? The American Economic Review 87(3), 520-530.
Clayton, J., & MacKinnon, G. (2003). The relative importance of stocks, bond and real estate factors in explaining REIT returns. Journal of Real Estate Finance and Economics 27(1), 39-60.
Damianov, D. S., & Escobari, D. (2015). Long-run equilibrium shift and short-run dynamics of U.S. home price tiers during the housing bubble. Journal of Real Estate Finance and Economics, forthcoming.
Diba, B. T., & Grossman, H. I. (1988b). The theory of rational bubbles in stock prices. The Economic Journal 98(392), 746-754.
Escobari, D., Damianov, D., & Bello, A. (2015). A time series test to identify housing bubbles. Journal of Economics and Finance 39(1), 136-152.
Evans, G. W. (1991). Pitfalls in testing for explosive bubbles in asset prices. The American Economic Review 81(4), 922-930.
Glascock, J. L., Lu, C., & So, R. W. (2000). Further evidence on the integration of REIT, bond, and stock returns. Journal of Real Estate Finance and Economics 20(2), 177-194.
Goodman A. G., & Thibodeau, T. (2008). Where are the speculative bubbles in US housing markets? Journal of Housing Economics 17(2), 117-137.
15
Himmelberg, C., Mayer, C., & Sinai, T. (2005). Assessing high house prices: Bubbles, fundamentals and misperceptions. Journal of Economic Perspectives 19(4), 67-92.
Homm, U., & Breitung, J. (2012). Testing for speculative bubbles in stock markets: a comparison of alternative methods. Journal of Financial Econometrics 10(1), 198-231.
Jirasakuldech, B., Campbell, R. D., & Knight, J. R. (2006). Are there rational speculative bubbles in REITs? The Journal of Real Estate Finance and Economics 32(2), 105-127.
LeRoy, S. F., & Porter, R. D. (1981). The present-value relation: Tests based on implied variance bounds. Econometrica 49(3), 555-574.
Mayer, C. (2011). Housing bubbles: a survey. Annual Review of Economics 3(1), 559-577.
Mikhed V., & Zemčík, P. (2009). Testing for bubbles in housing markets: A panel data
approach. Journal of Real Estate Finance and Economics 38(4), 366-386.
Nneji, O., Brooks, C., & Ward, C. (2013). Commercial real estate and equity market bubbles: are they contagious to REITs? Urban Studies 50(12), 2496-2516.
Oikarinen, E., Hoesli, M., & Serrano, C. (2011). The long-run dynamics between direct and securitized real estate. Journal of Real Estate Research 33(1), 73-103.
Payne, J. E., & Waters, G. A. (2007). Have equity REITs experienced periodically collapsing bubbles? The Journal of Real Estate Finance and Economics 34(2), 207-224.
Phillips, P. C., Shi, S. P., & Yu, J. (2015). Testing for multiple bubbles: Historical episodes of exuberance and collapse in the S&P 500. International Economic Review, Forthcoming.
Phillips, P. C., Wu, Y., & Yu, J. (2011). Explosive behavior in the 1990s NASDAQ: When did exuberance escalate asset values? International Economic Review 52(1), 201-226.
Shiller, R. J. (1981). The Use of Volatility Measures in Assessing Market Efficiency. The Journal of Finance 36(2), 291-304.
Shiller, R. J. (2007). Understanding recent trends in house prices and home ownership. National Bureau of Economic Research, Working Paper 13553. Cambridge, MA.
Van Norden, S. & Schaller, H. (1999). Speculative behavior, regime-switching, and stock market crashes. In P. Rothman (ed.), Nonlinear Time Series Analysis of Economic and Financial Data
(pp. 321–356). London: Springer.
Waters, G. A., & Payne, J. E. (2007). REIT markets and rational speculative bubbles: an empirical investigation. Applied Financial Economics 17(9), 747-753.
16
Table 1: Descriptive Statistics
Mean Median Std. Dev. Min Max HHI Con. Ratio
Total REIT Index 208.608 141.252 186.007 16.976 719.965 217.649 18.495%
Equity REIT Index 211.596 140.305 195.704 16.861 756.551 283.533 21.595%
Mortgage REIT Index 215.222 157.819 148.439 35.761 612.798 1944.359 67.511%
Hybrid REIT Index 214.127 121.387 210.257 16.199 940.127 4120.406 81.388%
Real REIT Index 1.129 0.853 0.777 0.212 3.107 - -
Real Equity REIT Index 1.136 0.848 0.822 0.210 3.265 - -
Real Mortgage REIT Index 1.249 0.982 0.645 0.428 3.123 - -
Real Hybrid REIT Index 1.146 0.749 0.864 0.202 4.057 - -
17 Table 2: The SADF test and the GSADF test statistics
Real REIT Index Test Statistic Finite Sample Critical Values
Total REIT
Equity REIT
Mortgage REIT
Hybrid
REIT 90% 95% 99%
SADF 4.936 5.267 2.986 4.778 1.406 1.659 2.217
GSADF 4.936 5.267 2.986 4.778 3.264 3.796 5.293
18
Figure 1: Real (Inflation-Adjusted) REITs – Jan 1980 to Sept 2013
0 1 2 3 4 5 Ja n 80 Ja n 82 Ja n 84 Ja n 86 Ja n 88 Ja n 90 Ja n 92 Ja n 94 Ja n 96 Ja n 98 Ja n 00 Ja n 02 Ja n 04 Ja n 06 Ja n 08 Ja n 10 Ja n 12
Real T otal REIT Value-Weighted Index Real Equity REIT Value-Weighted Index Real Mortgage REIT Value-Weighted Index Real Hybrid REIT Value-Weighted Index
19
Figure 2. GSADF. Bubble Periods in the Real REIT Value-Weighted Index
-4 -2 0 2 4 6 0 200 400 600 800 Ja n 80 Ja n 82 Ja n 84 Ja n 86 Ja n 88 Ja n 90 Ja n 92 Ja n 94 Ja n 96 Ja n 98 Ja n 00 Ja n 02 Ja n 04 Ja n 06 Ja n 08 Ja n 10 Ja n 12
BSADF Seq (left axis) 95% CV (left axis)
T otal REIT Value-Weighted Index (right axis)
Nov 2003-Jun 2007 Oct 1996-Apr1998
Aug 1990-Nov 1990
Feb 1993-Apr 1993
20
Figure 3. GSADF. Bubble Periods in the Real Equity REIT Value-Weighted Index
-2 0 2 4 6 0 200 400 600 800 Ja n 80 Ja n 82 Ja n 84 Ja n 86 Ja n 88 Ja n 90 Ja n 92 Ja n 94 Ja n 96 Ja n 98 Ja n 00 Ja n 02 Ja n 04 Ja n 06 Ja n 08 Ja n 10 Ja n 12
BSADF Seq (left axis) 95% CV (left axis)
Equity REIT VW Index (right axis)
Nov2003-Jun2007 Oct1996-Apr1998
Feb1993-Apr1993
Aug1990-Nov1990
21
Figure 4. GSADF. Bubble Periods in the Real Mortgage REIT Value-Weighted Index
-4 -2 0 2 4 6 0 200 400 600 800 Ja n 80 Ja n 82 Ja n 84 Ja n 86 Ja n 88 Ja n 90 Ja n 92 Ja n 94 Ja n 96 Ja n 98 Ja n 00 Ja n 02 Ja n 04 Ja n 06 Ja n 08 Ja n 10 Ja n 12
BSADF Seq (left axis) 95% CV (left axis)
Mortgage REIT Value-Weighted Index (right axis)
Sept1996-Nov1997 May2003-Apr2004 Jan1983-May1983
May2001-Aug2001
22
Figure 5. Bubble Periods in the Real Hybrid REIT Value-Weighted Index
-2 0 2 4 6 0 200 400 600 800 1,000 Ja n 80 Ja n 82 Ja n 84 Ja n 86 Ja n 88 Ja n 90 Ja n 92 Ja n 94 Ja n 96 Ja n 98 Ja n 00 Ja n 02 Ja n 04 Ja n 06 Ja n 08 Ja n 10 Ja n 12
BSADF Seq (left axis) 95% CV (left axis)
Hybrid REIT Value-Weighted Index (right Axis)
Aug2006-May2007 Nov1996-Feb1998
Nov2003-Apr2004
23
Highlights
We test for single and multiple bubble periods in four Real Estate Investment Trust.
Our approach allows us to estimate the beginning and the end of bubble periods.
We use the CRSP/Ziman monthly REIT index from January 1980 through September
2013.
We find bubbles in the REIT index and its three components: Equity, Mortgage and