A New Low-Cost
¢
-Type High-Strength Titanium Alloy
with Lower Alloying Percentage for Spring Applications
Xiaoli Zhao
1,+, Shuchen Sun
2, Lei Wang
1, Yandong Liu
1, Jidong He
2and Ganfeng Tu
2 1Key Laboratory for Anisotropy and Texture of Materials (Ministry of Education), School of Materials and Metallurgy, Northeastern University, Shenyang, Liaoning 110819, China2School of Materials and Metallurgy, Northeastern University, Shenyang, Liaoning 110819, China
Spring applications require materials that possess a low Young’s modulus and high strength, in addition to having a lower alloying percentage for reduced costs. In this study, a new low-cost¢-type titanium alloy with a lower alloying percentage than conventional¢-type alloys was developed for spring applications using [Al]eqand [Mo]eq. The alloy is located in the near-¢region and its¢transus temperature is
about 1023 K (750°C). This alloy could be cold rolled to a reduction ratio of 86.7%without any intermediate heat treatment. The solutionized alloy exhibits an ultimate strength of 925 MPa, a 0.2%proof stress of 910 MPa, an elongation of 18%, and a Young’s modulus of 78 GPa; the comprehensive characteristics are better than those of conventionally used alloys (Ti-15-3 and¢C) for spring applications.
[doi:10.2320/matertrans.M2014174]
(Received May 12, 2014; Accepted June 11, 2014; Published July 18, 2014)
Keywords: titanium alloy, high strength, low alloying percentage, low cost, spring applications
1. Introduction
Titanium alloys possess high specific strength, corrosion
resistance, thermal resistance, and compatibility; conse-quently, they are widely used in various industries such as
automobile, aircraft, shipping, and oil exploration.1)Springs
are used by about all aircraft manufacturers and finds usage
in a limited capacity in applications ranging from the
horologe to automobiles.24) Beta-type titanium alloys are
ideal materials for spring applications given their high strength, low modulus, low density, and excellent corrosion resistance. The low modulus and density in conjunction with the high strength enable the realization of springs that are only half the volume of steel springs (only half the number of
coils are required) with weight reductions of up to 70%
relative to the steel springs.5,6) In addition, titanium alloys
offer lifecycle cost advantages for spring applications, in light of the fact that they have higher corrosion resistance, as evidenced by previously used piano wire steel springs that required constant maintenance due to corrosion. Typical airframe applications include up-lock and down-lock springs as part of the landing gear, door counter-balance springs,
flight control springs to ensure speed limit compliance, feel
and centering springs for the yoke, pedal returns (brakes), and
hydraulic return springs.7,8)The extent of usage of springs in
aircrafts seems to be limited only by the alloy used for the
springs. It is reported that Ti-8V-6Cr-4Mo-3Al-4Zr (¢C)9)
wires are used for the up-lock and down-lock springs for
Bombardier regional jets, while Cessna jetfleets employ
Ti-15V-3Cr-3Al-3Sn (Ti-15-3) clock-type springs10)to assist in
the deployment/retraction of the doors/fold-out stairs, with
both the alloys being beta-type alloys. However, a disadvant-age of the beta-type titanium alloy system is the greater possibility of segregation of elements occurring during melting. Reducing the alloying element content is one method to avoid such a problem, and doing so can also help
lower costs. In this study, a new low-cost ¢-type
high-strength titanium alloy with a low alloying percentage for spring applications was developed, and its microstructures and mechanical properties were examined.
2. Experimental Procedures
2.1 Materials design
Aluminum is a well-known solute-strengthening element for titanium alloys; however, the total content of Al should
be less than 7% in order to obtain ductility. Vanadium and
molybdenum are the alloying elements that offer increased strength, improved thermal stability, and excellent ductility. Iron and chromium have a lower density than Mo but a stronger beta-stabilizing effect, and are therefore the main alloying elements for high-strength metastable beta-type titanium alloys. Silicon is effective in improving thermal
resistance when its content is lower than 0.25%. Zirconium is
always added to titanium alloys for solid solution strengthen-ing effects, and for improvstrengthen-ing their thermal resistance and
welding performance.11)
The new alloy in this study was designed considering Al
equivalence (Aleq) and Mo equivalence (Moeq) conditions, as
shown in eqs. (1) and (2)12)
½Aleq¼%Alþ%Sn=3þ%Zr=6þ%Si=0:25 ð1Þ
½Moeq¼%Moþ%Ta=4:5þ%Nb=3:6þ%W=2:25
þ%V=1:5þ%Cr=0:63þ%Mn=0:65
þ%Fe=0:35þ%Co=0:7þ%Ni=0:9 ð2Þ
The% in the eqs. (1) and (2) refer to mass%.
It has been reported that the Moeqof metastable beta-type
titanium alloys is more than 11%, and if alpha-stabilizers
coexist in the alloys, it is important to increase the Moeqto
obtain the ¢ phase after water quenching.10) With the
objective of lowering the alloying percentage and thereby the costs, the alloy Ti-3Al-4V-6Cr-4Mo-0.8Fe-0.4Zr-0.01Si
with a nominal [Al]eq=3.1, [Mo]eq=18.5 was developed;
this alloy is hereafter referred to as Ti-18.
+Corresponding author, E-mail: zhaoxl@smm.neu.edu.cn
2.2 Materials
The alloy (80 g) was fabricated in the form of ingots by arc melting with a non-consumable tungsten electrode under a high-purity argon atmosphere. The ingots were then homogenized at 1373 K for 21.6 ks and hot-forged at 1273 K (both processes were performed in an argon atmosphere), after which they were quenched in ice water and the air-cooled, respectively. Cold rolling was carried out
to evaluate the cold workability of the alloy. The ¢ transus
temperature was determined by differential scanning calo-rimetry (DSC) and optical microscopy (OM). The chemical composition of the alloy was determined by conventional chemical and gas analyses: the metallic elements were determined using inductively-coupled plasma optical emis-sion spectrometry (ICP-OES); Si was determined using the
SiO2 gravimetric method; C was determined by the infrared
absorption method after combustion; O was determined using the He carrier fusion infrared absorption method; and N was determined using the He carrier fusion thermal conductivity method. The chemical composition is shown in Table 1.
2.3 Methods
The phase constitution of the designed alloy was identified
by X-ray diffraction (XRD) analysis using Cu-K¡radiation
at a diffraction angle (2ª) range of 3090°, an accelerating
voltage of 40 kV, and a current of 40 mA. The micro-structures were observed by OM. The specimens for OM were mechanically polished using SiC waterproof emery
paper of up to #4000 grit and a final level with a
colloidal silica suspension. They were then etched in a Kroll solution.
The mechanical properties of the prepared alloys were
evaluated by Young’s modulus measurements and tensile
tests. Rectangular specimens of dimensions 40 mm
(length)©10 mm (width)©1.5 mm (thickness) were used
for Young’s modulus measurements. Specimens for tensile
tests were of thickness 1.5 mm, width 3 mm, and gage length 13 mm. Specimens for both tests were polished after they were cut by wire electric discharge machining from the hot-rolled and solutionized plates of the alloy. The longitudinal direction of these plates was parallel to the rolling direction.
Young’s modulus (E) was measured at room temperature by
the free resonance vibration method. Uniaxial tensile tests
were performed at a crosshead speed of 8.33©10¹6ms¹1at
room temperature in air using an Instron-type machine. The
ultimate tensile strength (·B), yield strength at 0.2% offset
(0.2%proof stress) (·0.2), and elongation (¤) at fracture were
correspondingly determined. For determine each property, three specimens were used to minimize the errors caused by the measurement process and possible chemical inhomoge-neity. The error bars refer to the standard deviation of the triplicate results.
3. Results and Discussions
The [Mo]eq-[Al]eq map was drawn using 95 alloys with
different [Mo]eqand [Al]eqby Zhang.10) The distribution of
the alloys in the [Mo]eq-[Al]eqmap is shown in Fig. 1. The
newly designed alloy is in near-¢phase region in that map. A
comparison of the properties of similar alloys is presented in Table 2. The new alloy, Ti-18, exhibits lower density and alloying percentage than the other alloys compared in the table.
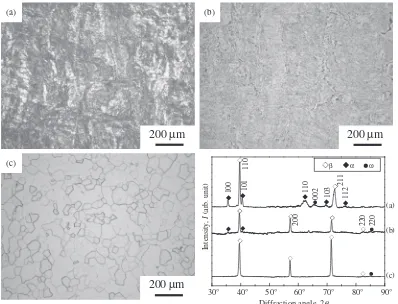
Figure 2 shows the optical microstructures and XRD
patterns of the alloy after hot forging. The peaks of¢,¡, and
½phases can all be observed in the XRD profiles, indicating
that the alloy consisted of the ¡and½ phases in addition to
the¢matrix. The designed alloy is a near-¢alloy, the¡and½
phases in the alloy are precipitated during air-cooling after hot forging. In the OM images, the clear quasi-equiaxial
grains are the¢phase, and the acicular structure observed in
the grains is the slip bands caused by hot forging. Probably as
a result of their small size, the¡and½phases are not visible
in the OM images.
The tensile properties of the alloy after hot forging are
listed in Table 3. The ultimate strength and the 0.2% proof
stress are both more than 1200 MPa and difference between them is quite small, indicating that there was negligible work
hardening. However, the elongation is less than 1%; this
small elongation can be attributed to the defects and dislocations formed during hot forging.
In order to obtain excellent tensile properties, the heat
treatment temperature needs to be optimized. The¢ transus
temperature is an important parameter to determine the heat treatment temperature, and can be determined through calculations, DSC, and OM observations.
The following expression is used for the calculation of
[image:2.595.43.549.85.125.2]nominal¢transus temperature.
Table 1 Nominal (N) and experimental (E) chemical compositions of the Ti-18 alloy (mass%).
Al V Cr Mo Fe Zr Si C N O Ti [Mo]eq [Al]eq
N 3 4 6 4 0.8 0.4 0.01 ® ® ® Bal. 18.5 3.1
E 2.58 3.82 5.89 3.96 0.75 0.40 0.01 0.023 0.013 0.157 Bal. 18.0 2.7
0 2 4 6 8 10 12 14 16 18 20
0 1 2 3 4 5 6
[Al]
eq
[Mo]eq 1
2, 3 4
5 8
9 10
12 (Ti-18)
11(βC)
α′(α′′) β+ω
β
(Ti-15-3)6,7
Fig. 1 Distribution of alloys in the [Mo]eq-[Al]eq map. I:¡ and near-¡
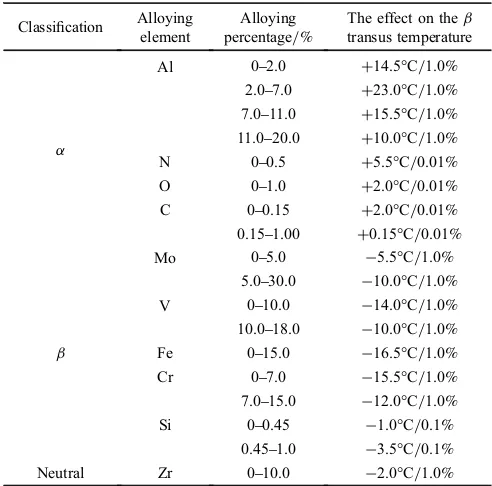
[image:2.595.315.542.103.329.2]T ¼885Cþ½X T½X ð3Þ
where [X] is the percentage of the alloy element andT[X]is
the effect of the alloying element on the ¢ transus
temper-ature, examples of which are shown in Table 4.
Inserting the values of the various parameters in expression
(3), the calculated¢transus temperature is 1064 K. The DSC
results (Fig. 3) show the ¢ transus temperature to be about
1023 K (750°C); the OM images and the XRD patterns
(Fig. 4) confirm the DSC results. The peaks of the¡,½, and¢
phases are identified for the Ti-18 alloy subjected to heat
treatment at 973 K. The peaks of the¡phase become weaker
[image:3.595.44.548.85.253.2]with increasing the heat treatment temperature, and after heat Table 2 Properties of the alloys in the [Mo]eq-[Al]eqmap.9)
Alloy Composition
(mass%) [Al]eq [Mo]eq
Density (Calculated)
Alloying percentage
1 Transage129 Ti-11.5V-2Al-2Sn-11Zr 4.5 8.2 4.77 26.50
2 Ti-16-2.5 Ti-16V-2.5Al 2.5 11.4 4.62 18.50
3 Beta III Ti-11.5Mo-6Zr-4.5Sn 2.5 11.5 4.97 22.00
4 Ti-15-5-3 Ti-15Mo-5Zr-3Al 3.8 15.0 4.90 23.00
5 Ti-15-5 Ti-15Mo-5Zr 0.8 15.0 5.00 20.00
6 Ti-15-3 Ti-15V-3Cr-3Al-3Sn 4.0 15.7 4.68 24.00
7 Beta 21S Ti-15Mo-3Al-2.7Nb-0.25Si 4.0 15.8 4.87 20.95
8 BT35 Ti-15V-3Cr-3Al-3Sn-1Zr-1Mo 4.2 16.7 4.72 26.00
9 Ti-8823 Ti-8Mo-8V-2Fe-3Al 3.0 17.7 4.77 21.00
10 BT32 Ti-8V-8Mo-1.5Cr-1.5Fe-3Al 3.0 19.2 4.78 22.00
11 ¢C Ti-8V-6Cr-4Mo-3Al-4Zr 3.7 19.7 4.78 25.00
12 Ti-18 (E) Ti-3Al-4V-6Cr-4Mo-0.8Fe-0.4Zr-0.01Si 2.7 18.0 4.70 17.51
90°
80°
70°
60°
50°
40°
110
Intensity
,
I
(arb
. unit)
Diffraction angle, 2θ
102 201 103 112 220 220
100
β α ω
30°
(b)
500 μm (a)
[image:3.595.56.535.86.429.2]Fig. 2 Optical microstructure (a) and XRD profiles (b) of Ti-18 alloy after hot forging.
Table 3 Tensile properties of the hot-forged Ti-18 alloy.
·B/MPa ·0.2/MPa ¤(%)
[image:3.595.323.529.456.597.2]Hot forged 1218«43 1214«45 0.87«0.12
Table 4 Effects of various alloying elements on the¢transus temperature.9)
Classification Alloying element
Alloying percentage/%
The effect on the¢ transus temperature
¡
Al 02.0 +14.5°C/1.0%
2.07.0 +23.0°C/1.0% 7.011.0 +15.5°C/1.0% 11.020.0 +10.0°C/1.0%
N 00.5 +5.5°C/0.01%
O 01.0 +2.0°C/0.01%
C 00.15 +2.0°C/0.01%
0.151.00 +0.15°C/0.01%
¢
Mo 05.0 ¹5.5°C/1.0%
5.030.0 ¹10.0°C/1.0%
V 010.0 ¹14.0°C/1.0%
10.018.0 ¹10.0°C/1.0%
Fe 015.0 ¹16.5°C/1.0%
Cr 07.0 ¹15.5°C/1.0%
7.015.0 ¹12.0°C/1.0%
Si 00.45 ¹1.0°C/0.1%
0.451.0 ¹3.5°C/0.1%
Neutral Zr 010.0 ¹2.0°C/1.0%
0 20 40 60 80 100 120 140 0
200 400 600 800 1000
Temperture DSC
Time, t/min.
T
emperature,
T
/
°
C
DSC/mW
-25 -20 -15 -10 -5 0 5 10 15
[image:3.595.45.290.471.501.2] [image:3.595.45.291.542.785.2]treatment at 1273 K, the alloy are mainly composed of the¢
phase (the peaks of the½phase are attributed to the a thermal
½ formed during quenching) and is comprised of equiaxed
grains of size 45 µm. It is thus evident that the ¢ transus
temperature is lower than 1273 K. The grain size usually increases with increasing heat-treatment temperature, and the strength, which is inversely proportional to the grain size according to the Hall-Petch relationship, therefore decreases.
Refinement of the alloy grain size is thus beneficial for
strength improvement. The temperature of 1273 K, which is
greater than the ¢ transus temperature of the alloy and at
which the recrystallization finishes resulting in relatively
smaller grains, is therefore an optimum temperature for solution treatment.
The as-solutionized specimens heat-treated at 1273 K for 3.6 ks were cold-rolled to evaluate their cold workability. Figure 5 shows the images before and after cold rolling to a
reduction ratio of 86.7% without any intermediate heat
treatment. The fact that such a large reduction ratio could be achieved proves that the alloy exhibits excellent cold workability, which could lead to lower production costs.
The mechanical properties were measured using the solutionized plates (the cold-rolled plates are solutionized at 1273 K for 3.6 ks followed by ice-water quenching). The
Young’s modulus and tensile properties of the solutionized
alloy are listed in Table 5. The ultimate strength of the alloy
is 925 MPa, the 0.2% proof stress is 910 MPa, and the
Rolling Direction
10 mm 10 mm
(a) (b)
[image:4.595.100.498.69.373.2]Fig. 5 Images of Ti-18 alloy before (a) and after (b) cold rolling.
Table 5 Young’s modulus and tensile properties of solutionized Ti-18 alloy.
·B/MPa ·0.2/MPa ¤(%) E/GPa
Solutionized 925«4 910«8 17.9«3.7 77.97«0.35
200
μ
m
200
μ
m
200
μ
m
(a)
(c)
(b)
(c) (b)
112
103
110
002
101
100
β α ω
Intensity
,
I
(arb
. unit)
110
200
211
220 220 (a)
90°
80°
70°
60°
50°
40°
Diffraction angle, 2θ
30°
[image:4.595.134.462.420.543.2] [image:4.595.299.548.612.638.2]elongation is 18%; all indicating a better balance between strength and elongation in comparison to the hot-forged alloy. The decrease in strength and increase in elongation are attributed to the fewer defects and dislocations and the
disappearance of the ¡ phase after solutionizing. A
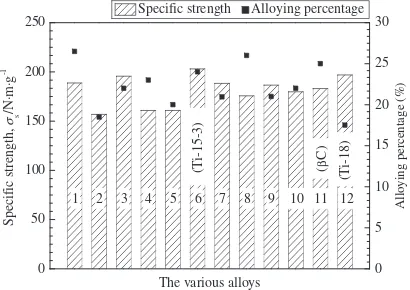
comparison of the specific strengths and alloying percentages
of the Ti-18 alloy and other such industrial alloys is presented in Fig. 6. This comparison indicates that the Ti-18 alloy exhibits excellent properties for spring application in light
of its high specific strength and low alloying percentage
compared to the alloys Ti-15-3 and ¢C. As the Ti-18 is a
near-¢ alloy, it is possible to further improve its tensile
properties via ageing treatment by controlling the size and
volume of precipitates (isothermal ½ and ¡ phases). Also,
adding Si to the alloy can be an effective way to improve
the alloy’s thermal resistance, which affords the possibility
of using the alloy for high-temperature applications. The thermal resistance of the Ti-18 alloy and the effect of ageing on its mechanical properties needs to be further investigated.
4. Conclusions
In this study, a new low-cost¢-type high-strength titanium
alloy with a lower alloying percentage is developed for spring applications, and the following conclusions are drawn:
(1) The new Ti-18 alloy is located in the near-¢region, and
its¢transus temperature is about 1023 K (750°C).
(2) The alloy could be cold rolled to a reduction ratio of
86.7% without any intermediate heat treatment.
(3) The solutionized alloy exhibits an ultimate strength
of 925 MPa, a 0.2% proof stress of 910 MPa, an
elongation of 18%, and a Young’s modulus of 78 GPa;
all of which make the alloy more competitive compared
to conventionally used alloys (Ti-15-3 and ¢C) for
spring applications.
Acknowledgments
This work was partly supported by China Postdoctoral Science Foundation (Grant No. 2013M530933), the
Funda-mental Research Funds for the Central Universities
(Grant No. N120302002), the Specialized Research Fund for the Doctoral Program of Higher Education (Grant
No. 20130042120043), and the Scientific Research
Founda-tion for the Returned Overseas Chinese Scholars, State Education Ministry.
REFERENCES
1) Y. Q. Zhao, Y. N. Chen, X. M. Zhang, W. D. Zeng and L. Wang:Phase Transformation and Heat Treatment of Titanium Alloys, (Central South University Press, Changsha, 2011) pp. 25.
2) S. R. Seagle, R. Bajoraitis and C. F. Pepka:Mater. Sci. Tech.3(1987) 97100.
3) R. R. Boyer: Proc. 1993 Annual TMS Meeting, ed. by D. Eylon, R. R. Boyer and D. A. Koss, (The Materials Society, Warrendale, Pennsylvania, 1993) pp. 335346.
4) R. Boyer:JOM46(1994) 2023.
5) A. M. Sherman and S. R. Seagle: Proc. Annual Meeting Mater. Soc., ed. by R. R. Boyer and H. W. Rosenberg, (Metallurgical Society of AIME, Warrendale, Pennsylvania, 1984) pp. 281293.
6) Titanium Cooperation of Japan: Titanium and Its Applications, (Translated by L. Z. Zhou, Metallurgical Industry Press, Beijing, 2008) pp. 3133.
7) R. R. Boyer and R. D. Briggs:J. Mater. Eng. Perform.14(2005) 680 684.
8) G. Lütjering and J. C. Williams:Titanium, (2nd Edition), (Translated by L. Ting, X. Y. Yang, and S. M. Fang, Metallurgical Industry Press, Beijing, 2011) pp. 283287.
9) X. Huang, Z. T. Zhu and H. H. Wang:Advanced Aeronautical Titanium Alloys and Applications, (National Defense Industry Press, Beijing, 2012) pp. 226236.
10) X. Zhang, Q. J. Wang and W. Mo: Physical Metallurgy and Heat Treatment of Titanium, (Metallurgical Industry Press, Beijing, 2009) pp. 67115.
11) X. Cheng and C. Ye: Fundamental Research and Applications of Titanium in Aerospace and Biomedical Areas, (Science Press, Beijing, 2012) p. 28.
12) W. Mo: Titanium, (Metallurgical Industry Press, Beijing, 2008) pp. 291294.
0 50 100 150 200 250
Allo
y
ing percentage (%)
The various alloys
Specif
ic strength,
σs
/N·m·g
-1
Specific strength Alloying percentage
0 5 10 15 20 25 30
(T
i-18)
(
β
C)
12 11 10 9 8 7 6 5 4 3 2 1
(T
i-15-3)
[image:5.595.67.272.71.216.2]![Fig. 1Distribution of alloys in the [Mo]eq-[Al]eq map. I: ¡ and near-¡alloys, II: ¡ + ¢ alloy, III: Transition alloy, IV: Near-¢ alloy.](https://thumb-us.123doks.com/thumbv2/123dok_us/317058.530576/2.595.315.542.103.329/distribution-alloys-alloys-alloy-transition-alloy-near-alloy.webp)