Activity of Phosphorus Pent-Oxide and Tri-Calcium Phosphate
in 2CaO·SiO
2-3CaO·P
2O
5Solid Solution Saturated with CaO
Ming Zhong, Hiroyuki Matsuura and Fumitaka Tsukihashi
Department of Advanced Materials Science, Graduate School of Frontier Sciences, The University of Tokyo, Kashiwa 277-8561, Japan
Equilibrium between molten iron and the 2CaO·SiO2-3CaO·P2O5solid solution saturated with CaO was measured by the chemical equilibrium method with the oxygen partial pressure of 5.22©10¹12atm at 1823 K and 1.41©10¹11atm at 1873 K. The activity of P
2O5 relative to hypothetical pure liquid P2O5was determined from the analyzed content of P in molten iron and reported thermodynamic data. For the compositions in which the CaO phase was detected by XRD after reaction, the activity of 3CaO·P2O5was determined by the estimated activity of P2O5and the activity of CaO which was unity due to its saturation. The activity coefficients of P2O5and 3CaO·P2O5in solid solution and the phosphorus partition ratio between molten iron and the mixture of 2CaO·SiO2-3CaO·P2O5solid solution and CaO were also estimated. Besides, the activity of 2CaO·SiO2and SiO2in the solid solution were also estimated by applying the Gibbs-Duhem equation.
[doi:10.2320/matertrans.M-M2015813]
(Received March 6, 2015; Accepted May 14, 2015; Published June 26, 2015)
Keywords: thermodynamics, steelmaking, multi-phaseflux, activity of P2O5, activity of 3CaO·P2O5, phosphorus partition ratio, solid solution,
2CaO·SiO2-3CaO·P2O5
1. Introduction
Since phosphorus causes embrittlement for steel to decrease plasticity and toughness,15) usually it should be removed from molten iron and steel in the process of dephosphorization. As a cheap and efficient dephosphoriza-tion agent, CaO is commonly adopted. The excess CaO is added into slag in order to achieve better dephosphorization efficiency and thus the amount of slag and the consumption of CaO increase. Meanwhile due to CaO which remains unreacted or precipitates during solidification of dephospho-rization slag, the slag is difficult to be reused. In consequence of the harm for environment and human, fluorite is strictly used although it can enhance the dissolution of CaO into slag. During the reaction of solid CaO or 2CaO·SiO2 with molten CaO-SiO2-FeO-P2O5 slag, the formation of solid solution between di-calcium silicate and tri-calcium phos-phate was confirmed by Suito and Inoue.6,7) It was also confirmed that the di-calcium silicate forms a pseudo-binary solid solution with tri-calcium phosphate over a wide range of compositions at the range of steelmaking temperature.8) For the purpose to utilize the solid solution in the process of dephosphorization, the conception of multi-phase flux was considered. The reaction mechanisms between solid CaO and the FeOx-CaO-SiO2-P2O5 slag system were studied by Fukagai et al. and Hamano et al.,9,10) and those between solid 2CaO·SiO2 and the FeOx-CaO-SiO2-P2O5 slag system were studied by Yang et al.1114) Kitamura et al. also conducted the similar experiments to study the mass transfer of P2O5 between 2CaO·SiO2-3CaO·P2O5 solid solution and the CaO-SiO2-P2O5-Fe2O3slag system.15)The phase relation-ship of CaO-SiO2-FeO-5 mass%P2O5(-5 mass%Al2O3) slag system was studied by Gao et al.by applying the chemical equilibrium method.1618) The partition of P
2O5 between 2CaO·SiO2-3CaO·P2O5 solid solution and the CaO-SiO2 -P2O5-Fe2O3or CaO-SiO2-P2O5-FeO slag system was studied by applying the chemical equilibrium method to make equilibrium between 2CaO·SiO2-3CaO·P2O5 solid solution
and the slag by Pahlevaniet al.,19)meanwhile the activity of P2O5 in the solid solution was estimated by applying the regular solution model. Hasegawa et al. estimated the activity of P2O5in the 2CaO·SiO2-3CaO·P2O5solid solution by conducting the equilibrium experiments between molten Cu and the 2CaO·SiO2-3CaO·P2O5 solid solution at 1573 K and applying the established phase relationship.20) The free energy change of the formation of the solid solution between di-calcium silicate and tri-calcium phosphate was measured by Takeshitaet al.21)
ured to obtain the activity of P2O5 at 1823 and 1873 K directly in our current research. The activity of 3CaO·P2O5 was also estimated for the compositions where the CaO phase was detected by XRD after reaction. Furthermore, the activity of 2CaO·SiO2in the solid solution was estimated by applying the Gibbs-Duhem equation at 1823 and 1873 K, respectively, and based on the estimated activity of 2CaO·SiO2the activity of SiO2in the solid solution was also calculated.
2. Experimental
The chemical equilibrium method which is commonly adopted to measure the thermodynamic data was adopted for the current research. The molten iron was equilibrated with the mixture of 2CaO·SiO2-3CaO·P2O5 solid solution and CaO. The electrolytic iron was used whose content of P was less than 0.0003 mass%. The mixture of 2CaO·SiO2-3CaO· P2O5 solid solution and CaO was made by sintering the mixture with various ratios of reagent grade SiO2, CaHPO4· 2H2O and CaO obtained by the calcination of reagent grade CaCO3. The mixture was heated in air at 1873 K in a Pt crucible for 24 h, quenched by Ar stream and then ground into fine powder. These steps were repeated twice to obtain the powder of the mixture of solid solution and CaO. The formation of target phases was confirmed by XRD. For all compositions, SiO2or CaHPO4·2H2O phase was not detected but the solid solution was detected, and CaO phase was detected for some compositions as shown in Fig. 1. About 1.5 g of powder was charged into a steel dies to be pressed into a cylindrical tablet (diameter: 18 mm, thickness: 3 mm) at 50 MPa.
The vertical-resistance furnace with an Al2O3tube (outer diameter: 60 mm, inner diameter: 50 mm, length: 1000 mm) was applied for the experiment. Before each experiment, temperature was measured by a B-type thermocouple from the top of the tube and the suitable hot zone with temperature of 1823 K«1 K or 1873 K«1 K was determined. Temper-ature during the experiment was monitored by a thermocou-ple placed at the bottom of an MgO crucible. The side thermocouple measured the temperature for PID controller. The partial pressure of oxygen was controlled by the mixture of CO and CO2gases according to reaction (1). The CO/CO2 ratio was 110/1 with the totalflow rate of 366 mL/min, in which condition the partial pressure of oxygen was calculated to be 5.22©10¹12atm at 1823 K or 1.41©10¹11atm at 1873 K.
COðgÞ þ12O2ðgÞ ¼CO2ðgÞ
G
1¼ 281000þ85:23TJ=mol22Þ ð1Þ
Before charging the sample, air in the tube was replaced by Ar gas, and then the atmosphere was shifted to CO-CO2 gas. About 10 g electrolytic iron was equilibrated with the synthesized tablet in an MgO crucible at 1823 or 1873 K. According to the preliminary experiments conducted with tablets in the same composition for different reaction time, the concentration of P in Fe barely changed as the reaction time was longer than 12 h. Finally the equilibrium duration was determined to be 24 h for the whole experiments in order to ensure equilibrium for various compositions of tablets.
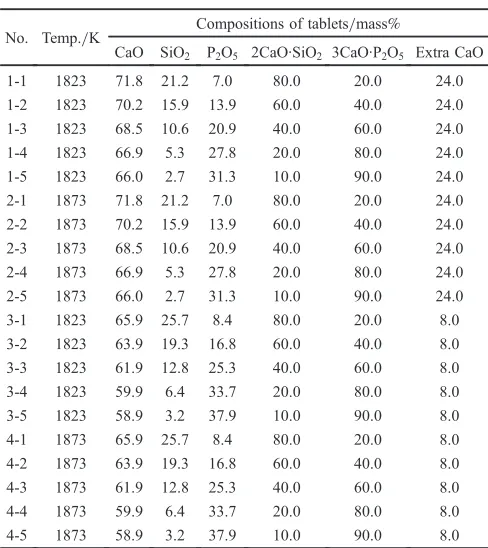
When the equilibrium was established, the sample was quenched by Ar stream at the outside of the furnace. The molybdenum-blue spectrophotometric solvent extraction method or the phosphomolybdate blue spectrophotometric method was adopted for analyzing the content of P in iron. The content of P2O5 in the tablet was analyzed by the phosphomolybdate blue spectrophotometric method. The content of SiO2in the tablet was analyzed by the gravimetry. The contents of CaO, FeO and MgO in the tablet were analyzed by ICP-OES. The formation of phases in the tablet was confirmed by XRD. Table 1 shows the initial conditions for experiments and the initial compositions of tablets were projected onto the CaO-SiO2-P2O5ternary phase diagram as shown in Fig. 2. In Table 1, the 2CaO·SiO2and 3CaO·P2O5 compositions were the mass percent in the 2CaO·SiO2-3CaO· P2O5 solid solution and the extra CaO composition was the
10 20 30 40 50 60 70 80 90
80mass%2CaO⋅SiO2-20mass%3CaO⋅P2O5
Intensity (a.u.)
2θ (deg) CaO
[image:2.595.312.541.70.244.2]Fig. 1 XRD pattern of 80 mass%2CaO·SiO2-20 mass%3CaO·P2O5 solid solution plus 24 mass%CaO.
Table 1 The initial conditions of experiments.
No. Temp./K Compositions of tablets/mass%
CaO SiO2 P2O5 2CaO·SiO2 3CaO·P2O5 Extra CaO
1-1 1823 71.8 21.2 7.0 80.0 20.0 24.0
1-2 1823 70.2 15.9 13.9 60.0 40.0 24.0
1-3 1823 68.5 10.6 20.9 40.0 60.0 24.0
1-4 1823 66.9 5.3 27.8 20.0 80.0 24.0
1-5 1823 66.0 2.7 31.3 10.0 90.0 24.0
2-1 1873 71.8 21.2 7.0 80.0 20.0 24.0
2-2 1873 70.2 15.9 13.9 60.0 40.0 24.0
2-3 1873 68.5 10.6 20.9 40.0 60.0 24.0
2-4 1873 66.9 5.3 27.8 20.0 80.0 24.0
2-5 1873 66.0 2.7 31.3 10.0 90.0 24.0
3-1 1823 65.9 25.7 8.4 80.0 20.0 8.0
3-2 1823 63.9 19.3 16.8 60.0 40.0 8.0
3-3 1823 61.9 12.8 25.3 40.0 60.0 8.0
3-4 1823 59.9 6.4 33.7 20.0 80.0 8.0
3-5 1823 58.9 3.2 37.9 10.0 90.0 8.0
4-1 1873 65.9 25.7 8.4 80.0 20.0 8.0
4-2 1873 63.9 19.3 16.8 60.0 40.0 8.0
4-3 1873 61.9 12.8 25.3 40.0 60.0 8.0
4-4 1873 59.9 6.4 33.7 20.0 80.0 8.0
4-5 1873 58.9 3.2 37.9 10.0 90.0 8.0
[image:2.595.305.549.299.573.2]mass percent of CaO in the mixture of the solid solution and CaO.
3. Results and Discussion
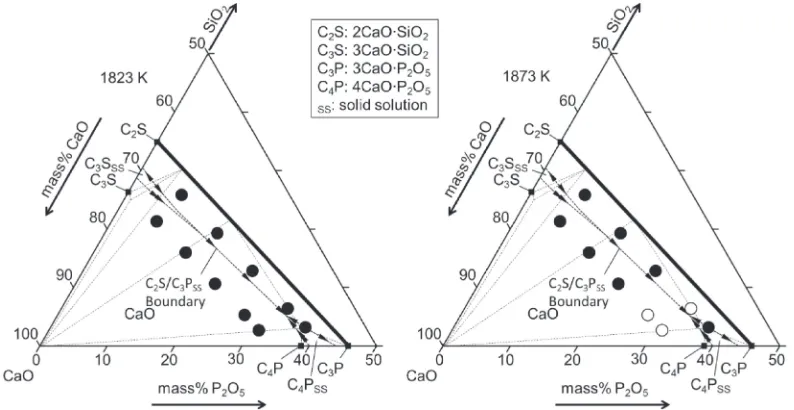
The tablet contained a certain amount of FeO and MgO after reaction. Although the initial compositions of all 2CaO·SiO2-3CaO·P2O5 solid solution plus 8 or 24 mass% CaO tables were solid phase at 1873 K, the tablets for Nos. 2-4, 2-5 and 4-4 in Table 1 turned into slag phase after reaction as shown in Fig. 2 by open circles. The phase relationship for these compositions was not clear in the previous study23) and thus these three compositions are not discussed in the following. Table 2 presents the contents of P in molten iron and the compositions of tablets after reaction.
Since molten iron coexisted, iron oxide in the tablet was assumed to be FeO. Because of the analytical accuracy, the significant digits for the concentration of P in Fe in Table 2 and the thermodynamic data in Table 3 are different.
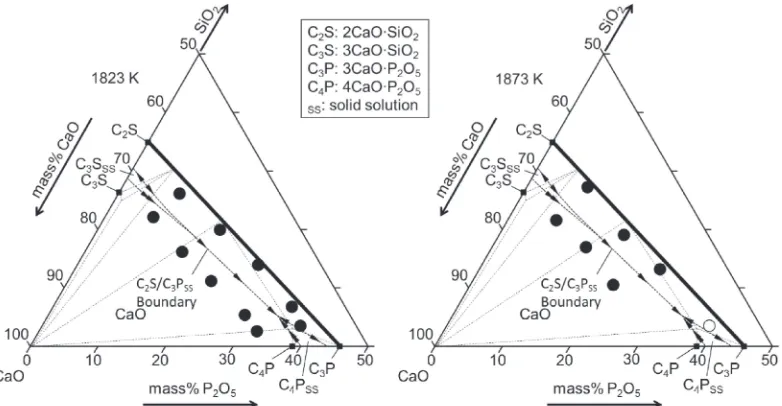
The MgO phase was barely detected in the XRD patterns of the tablets after reaction while the CaO phase was detected for some samples. Figure 3 shows an example of XRD pattern and Fig. 4 shows the projections of the compositions of tables after reaction onto the CaO-SiO2-P2O5ternary phase diagram.
3.1 Contents of FeO and MgO in the mixture of 2CaO·SiO2-3CaO·P2O5solid solution and CaO after reaction
Figure 5 shows the relationship between the P2O5content Fig. 2 Projection of initial compositions of tablets onto the CaO-SiO2-P2O5ternary phase diagram near the CaO corner. The open circle
[image:3.595.101.498.70.275.2]presented the compositions which turned into molten slag after reaction. The boundary and tie lines in the phase diagram were determined at 1773 K by Gutt.23)
Table 2 The compositions of tablets and the content of P in molten iron after reaction.
No. Compositions of tablets/mass% P in Fe/mass% P2O5 SiO2 CaO MgO FeO Total
1-1 6.94 21.23 67.98 0.49 0.38 97.0 0.00479
1-2 13.8 15.37 66.30 0.77 0.42 96.7 0.00917
1-3 20.6 10.68 65.37 0.37 0.39 97.4 0.0153
1-4 28.2 5.187 63.69 0.33 0.47 97.9 0.015
1-5 31.7 2.469 63.45 0.25 0.36 98.2 0.016
2-1 6.98 20.64 68.63 0.65 0.75 97.7 0.00553
2-2 13.8 16.49 67.95 0.53 0.86 99.6 0.0093
2-3 20.6 9.878 65.87 0.74 0.94 98.0 0.0150
3-1 8.73 25.05 62.17 0.28 0.84 97.1 0.0028
3-2 17.2 18.74 58.44 0.23 0.91 95.5 0.0035
3-3 26.5 13.63 58.27 0.39 0.63 99.4 0.00836
3-4 34.7 6.517 56.53 0.27 0.34 98.4 0.0214
3-5 38.0 3.357 57.80 0.30 1.38 100.8 0.0491
4-1 8.58 25.60 60.19 0.39 1.28 96.0 0.0036
4-2 17.2 17.41 57.71 0.36 2.13 94.8 0.00666
4-3 26.5 12.78 59.13 0.67 0.25 99.3 0.0267
[image:3.595.49.292.345.582.2]4-5 38.6 3.262 56.85 0.43 0.29 99.4 0.0734
Table 3 The normalized compositions after reaction and the calculated thermodynamic data.
No. 3CaO·P2O5 /mol%
Extra CaO /mass%
ðmass% PÞ
½mass% P aP2O5 a3CaOP2O5 1-1 12.2 20.9 6.58©102 8.28©10¹25 9.49©10¹6 1-2 27.4 22.0 6.88©102 3.05©10¹24 3.49©10¹5 1-3 44.9 21.7 6.08©102 8.54©10¹24 9.79©10¹5 1-4 69.7 21.2 8.5©102 8.2©10¹24 9.4©10¹5 1-5 84.5 21.8 8.9©102 9.3©10¹24 1.1©10¹4 2-1 12.5 22.7 5.73©102 1.08©10¹24 4.77©10¹6 2-2 26.2 21.2 6.6©102 3.1©10¹24 1.4©10¹5 2-3 46.9 23.9 6.22©102 8.06©10¹24 3.55©10¹5 3-1 12.9 5.3 1.4©103 2.8©10¹25 3.2©10¹6 3-2 28.0 3.3 2.3©103 4.4©10¹25 5.1©10¹6 3-3 45.1 1.4 1.41©103 2.53©10¹24 2.90©10¹5 3-4 69.3 3.3 7.24©102 1.68©10¹23 1.93©10¹4 3-5 82.7 6.6 3.41©102 9.12©10¹23 1.04©10¹3 4-1 12.4 2.4 1.1©103 4.6©10¹25 2.0©10¹6 4-2 29.5 5.2 1.22©103 1.57©10¹24 6.93©10¹6 4-3 46.7 3.9 4.40©102 2.58©10¹23 1.14©10¹4
[image:3.595.304.548.346.578.2]and the FeO or MgO content in tablets after reaction. There was no obvious change in the content of FeO or MgO with the increase of P2O5 content. Since the tablet was contaminated with more or less MgO crucible particles and iron particles when the tablet was separated from the surface of solidified iron at the inside of the MgO crucible, contents of FeO and MgO were larger for some samples. Except the irregular points, both of the contents of FeO and MgO were smaller than 1 mass%.
3.2 Equilibrium content of P in molten iron and phosphorus partition ratio between molten iron and the mixture of 2CaO·SiO2-3CaO·P2O5 solid solution and CaO
Figure 6 shows the relationship between the equilibrium content of P in molten iron and the content of 3CaO·P2O5in the solid solution. The 2CaO·SiO2-3CaO·P2O5solid solution was considered to be the binary system of di-calcium silicate and tri-calcium phosphate. The normalized contents of 2CaO· SiO2 and 3CaO·P2O5 in the solid solution were calculated
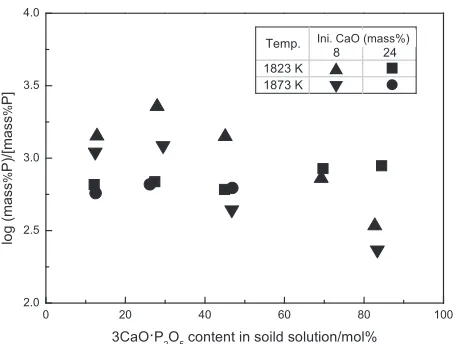
from the analyzed SiO2and P2O5contents, respectively. As a whole, the content of P in molten iron increased with the increase of 3CaO·P2O5 content in the solid solution. For a constant composition of the solid solution, the content of P barely changed with the change of temperature or extra CaO content. The phosphorus partition ratio between molten iron and the mixture of 2CaO·SiO2-3CaO·P2O5solid solution and CaO is shown in Fig. 7 and Table 3. The phosphorus partition ratio decreased with the increase of 3CaO·P2O5 content in the solid solution. For a constant composition of the solid solution, there is no obvious change in the phosphorus partition ratio with the change of temperature and extra CaO content because of the limited accuracy of chemical analyses, though the phosphorus partition ratio decreases with the increase of extra CaO content in principle.
3.3 Activity and activity coefficient of P2O5 in 2CaO· SiO2-3CaO·P2O5solid solution initially adding 8 and 24 mass%CaO
The equilibrium between molten iron and the mixture of
10 20 30 40 50 60 70 80 90
80mass%2CaO⋅SiO2-20mass%3CaO⋅P2O5
Intensity (a.u.)
2θ (deg) CaO
Fig. 3 XRD pattern of 80 mass%2CaO·SiO2-20 mass%3CaO·P2O5 solid solution plus 24 mass%CaO after reaction.
0 1 2 3 4
1823 K
MgO o
r
FeO con
te
nt in
ta
ble
t/m
ass
%
P2O5 content in tablet/mass%
Temp.
MgO
FeO
1823 K 1873 K
Ini. CaO (mass%) 8 24 8 24
0 10 20 30 40 50
Fig. 5 Contents of FeO and MgO in tablets after reaction.
Fig. 4 Projection of the compositions of tablets after reaction onto the CaO-SiO2-P2O5ternary phase diagram near the CaO corner. The compositions in which CaO phase was detected by XRD were marked as solid circles while the composition without CaO phase was marked as an open circle.
[image:4.595.57.292.67.246.2] [image:4.595.194.524.73.246.2] [image:4.595.105.496.288.491.2]2CaO·SiO2-3CaO·P2O5solid solution and CaO is expressed in term of phosphorus as reaction (2).
P2O5ðlÞ ¼2Pðmass%Þ þ5Oðmass%Þ
G
2¼832384632:65TJ=mol24Þ ð2Þ
Since the partial pressure of oxygen was controlled by the mixture of CO and CO2, contents of C and O in molten iron were calculated by eqs. (3) and (4) and the reported interaction coefficients shown in Table 4.
Oðmass%Þ þCOðgÞ ¼CO2ðgÞ
G
3¼ 166900þ91:16TJ=mol25Þ ð3Þ
Cðmass%Þ þCO2ðgÞ ¼2COðgÞ
G
4¼144700129:5TJ=mol25Þ ð4Þ
The activity of P2O5 was calculated by eq. (2) from the analyzed content of P and the reported thermodynamic data. The mole percent of P2O5in the solid solution was calculated by the normalized content of 3CaO·P2O5in Table 3 and the values of the activity of P2O5 were listed in Table 3. The activity of P2O5 is relative to hypothetical pure liquid P2O5. Figures 8 and 9 show the change in the activity and the activity coefficient of P2O5with the content of 3CaO·P2O5in the solid solution. The activity and the activity coefficient of P2O5increased with the increase of 3CaO·P2O5content in the solid solution. For a constant composition of the solid solution, the activity and the activity coefficient of P2O5 barely changed with the change of temperature and extra CaO content. Comparing with the values of P2O5 activity estimated by Hasegawa et al. at 1573 K, the current values were larger. The activity of P2O5 was in the range from 2.8©10¹25 to 2.05©10¹22, and the activity coefficient of P2O5 was in the range from 5.2©10¹24 to 9.44©10¹22.
3.4 Activity and activity coefficient of 3CaO·P2O5 in 2CaO·SiO2-3CaO·P2O5solid solution
For the compositions in which the CaO phase was detected
-3.0 -2.5 -2.0 -1.5 -1.0 -0.5
lo
g [P/ma
ss%
]
3CaO·P2O5 content in solid solution/mol%
Temp.
8 24
1823 K 1873 K
Ini. CaO (mass%)
0 20 40 60 80 100
Fig. 6 Equilibrium content of P in molten iron after reaction.
2.0 2.5 3.0 3.5 4.0
lo
g (mass
%
P)/[mas
s
%
P]
3CaO·P2O5 content in soild solution/mol%
Temp.
1823 K 1873 K
Ini. CaO (mass%)
0 20 40 60 80 100
8 24
[image:5.595.55.282.67.239.2]Fig. 7 Phosphorus partition ratio between molten iron and the mixture of 2CaO·SiO2-3CaO·P2O5solid solution and CaO.
Table 4 The reference data about interaction coefficients of solutes in molten iron.
ej i
j
P C O
i
P 0.05426) 0.12627) 0.1328)
C 0.05127) 0.24325) ¹0.3225)
O 0.0728) ¹0.42125) ¹0.1729)
0 20 40 60 80 100
-28 -26 -24 -22 -20 -18
lo
g
aP2
O5
3CaO·P2O5 content in soild solution/mol%
1573 K by Hasegawa et al.[20]
Temp.
8 24
1823 K 1873 K
Ini. CaO (mass%)
Fig. 8 The relationship between the activity of P2O5in the 2CaO·SiO2 -3CaO·P2O5solid solution saturated with CaO and the 3CaO·P2O5content in the solid solution.
-24 -23 -22 -21 -20
lo
g
γPO2
5
3CaO·P2O5 content in solid solution/mol%
Temp.
1823 K 1873 K
Ini. CaO (mass%)
8 24
0 20 40 60 80 100
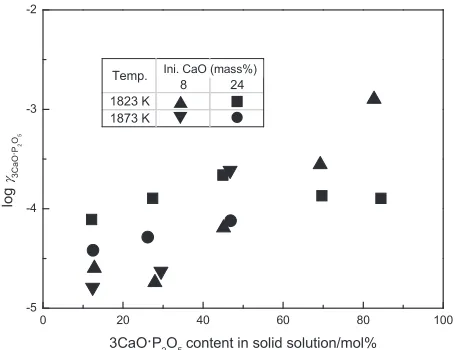
[image:5.595.314.540.69.240.2] [image:5.595.56.284.273.445.2] [image:5.595.313.540.293.464.2] [image:5.595.45.291.515.588.2]as shown in Fig. 4 as solid circles, the activity of 3CaO·P2O5 was calculated by the estimated activity of P2O5 and the activity of CaO which was unity by eqs. (5) and (6). The values of the activity of 3CaO·P2O5 in the 2CaO·SiO2-3CaO·P2O5 solid solution were listed in Table 3. Figures 10 and 11 show the change in the activity and the activity coefficient of 3CaO·P2O5in the 2CaO·SiO2-3CaO·P2O5solid solution with the 3CaO·P2O5content. The activity and the activity coefficient of 3CaO·P2O5 increased with the increase of 3CaO·P2O5 content in the solid solution. For a constant composition, the activity and the activity coefficient of 3CaO·P2O5 barely changed with the change of temperature and extra CaO content. Comparing with the 3CaO·P2O5 activity calculated from the activities of P2O5and CaO estimated by Hasegawaet al.20)at 1573 K by eqs. (5) and (6), the presents results were larger by approximately one to two orders of magnitude, which temper-ature dependence is thermodynamically feasible. The activity of 3CaO·P2O5 was in the range from 2.0©10¹6 to 1.04© 10¹3and the activity coefficient of 3CaO·P
2O5was in the range from 1.6©10¹5to 1.26©10¹3.
3CaOðsÞ þP2ðgÞ þ52O2ðgÞ ¼3CaOP2O5ðsÞ
G
5¼ 2198000þ504TJ=mol30Þ ð5Þ
P2ðgÞ þ52O2ðgÞ ¼P2O5ðlÞ
G
6¼ 1655480þ571:0TJ=mol24Þ ð6Þ
3.5 Activity of 2CaO·SiO2 and SiO2 in 2CaO·SiO2-3CaO·P2O5solid solution saturated with CaO By applying the Gibbs-Duhem equation for the 2CaO· SiO2-3CaO·P2O5 pseudo-binary system composed of two species, namely 2CaO·SiO2 and 3CaO·P2O5, the activity of 2CaO·SiO2 in the solid solution was calculated with the estimated activity coefficient of 3CaO·P2O5 as shown in Fig. 12. The relationship between the logarithmic activity coefficient of 3CaO·P2O5 and the mole fraction of 3CaO· P2O5in the solid solution was expressed by a linear function by the least square method at the compositional range from 0.122 to 0.845 at 1823 K and from 0.124 to 0.469 at 1873 K, respectively. Temperature dependency of the estimated 2CaO·SiO2activity was not obvious within the experimental error range. Moreover, the activity of SiO2in the 2CaO·SiO2 -3CaO·P2O5solid solution saturated with CaO was calculated by the estimated activity of 2CaO·SiO2and eq. (7) as shown in Fig. 13. Temperature dependency of the activity of SiO2
-6 -5 -4 -3 -2
lo
g
a3CaO
·
P2
O5
3CaO·P2O5 content in solid solution/mol%
Temp.
8 24
1823 K 1873 K
Ini. CaO (mass%)
1573 K by Hasegawa et al.[20]
[image:6.595.59.284.68.245.2]0 20 40 60 80 100
Fig. 10 The relationship between the activity of 3CaO·P2O5 in the 2CaO·SiO2-3CaO·P2O5solid solution and the 3CaO·P2O5content.
-5 -4 -3 -2
log
γ3CaO
·
P2
O5
3CaO·P2O5 content in solid solution/mol%
Temp.
8 24
1823 K 1873 K
Ini. CaO (mass%)
[image:6.595.315.539.72.234.2]0 20 40 60 80 100
Fig. 11 The relationship between the activity coefficient of 3CaO·P2O5in the 2CaO·SiO2-3CaO·P2O5solid solution and the 3CaO·P2O5content.
0 20 40 60 80 100
-2.5 -2.0 -1.5 -1.0 -0.5 0.0
log
a2Ca
O
·
Si
O2
[image:6.595.56.284.293.468.2]3CaO·P2O5 content in solid solution/mol% 1823 K 1873 K
Fig. 12 The estimated activity of 2CaO·SiO2in the 2CaO·SiO2-3CaO·P2O5 solid solution by applying the Gibbs-Duhem equation for the 2CaO·SiO2 -3CaO·P2O5pseudo-binary system.
0 20 40 60 80 100
-6.5 -6.0 -5.5 -5.0 -4.5 -4.0 -3.5
log
aSiO
2
3CaO·P2O5 content in solid solution/mol% 1823 K 1873 K
Fig. 13 The estimated activity of SiO2in the 2CaO·SiO2-3CaO·P2O5solid solution saturated with CaO.
[image:6.595.313.540.294.458.2]was also little. The activity of SiO2 in the solid solution saturated with CaO decreased monotonically from 1.0© 10¹4 to 6.9©10¹7 with the increase of the 3CaO·P
2O5 content up to 84.5 mol% at 1823 K.
2CaOðsÞ þSiO2ðsÞ ¼2CaOSiO2ðsÞ
G
7¼ 11900011TJ=mol31Þ ð7Þ
4. Conclusions
By applying the chemical equilibrium method, equilibrium between molten iron and the mixture of 2CaO·SiO2-3CaO· P2O5 solid solution and CaO was measured at 1823 K with the oxygen partial pressure of 5.22©10¹12atm and 1873 K with the oxygen partial pressure of 1.41©10¹11atm. The activity of P2O5relative to the hypothetical pure liquid P2O5 in the 2CaO·SiO2-3CaO·P2O5 solid solution initially con-taining 8 and 24 mass% CaO increased with the increase of the 3CaO·P2O5content in the solid solution in the range from 2.8©10¹25 to 2.05©10¹22 and the activity coefficient of P2O5 was in the range from 5.2©10¹24 to 9.44©10¹22 within the 3CaO·P2O5content in the solid solution from 12.2 to 84.5 mol%3CaO·P2O5. For the compositions in which the CaO phase was detected by XRD after reaction, the activity of 3CaO·P2O5 in the 2CaO·SiO2-3CaO·P2O5 solid solution was in the range from 2.0©10¹6 to 1.04©10¹3 and the activity coefficient of 3CaO·P2O5 was in the range from 1.6©10¹5 to 1.26©10¹3. The activity of 2CaO·SiO
2 calculated by applying the Gibbs-Duhem equation and that of SiO2in the solid solution calculated with the condition of CaO saturation decreased with the increase of 3CaO·P2O5 content in the solid solution at 1823 and 1873 K.
REFERENCES
1) R. Viswanathan:Metall. Trans.2(1971) 809815.
2) C. L. Briant and R. P. Messmer:Acta Metall.30(1982) 18111818.
3) C. L. Briant and S. K. Banerji:Metall. Trans. A10(1979) 123126.
4) C. L. Briant and S. K. Banerji:Metall. Trans. A10(1979) 17291737.
5) R. A. Mulford, C. J. Mcmahon, D. P. Pope and H. C. Feng:Metall. Trans. A7(1976) 11831195.
6) H. Suito and R. Inoue:ISIJ Int.46(2006) 180187.
7) R. Inoue and H. Suito:ISIJ Int.46(2006) 188194.
8) W. Fix, H. Heymann and R. S. Heinke:J. Am. Ceram. Soc.52(1969) 346.
9) S. Fukagai, T. Hamano and F. Tsukihashi:ISIJ Int.47(2007) 187189.
10) T. Hamano, S. Fukagai and F. Tsukihashi:ISIJ Int.46(2006) 490495.
11) X. Yang, H. Matsuura and F. Tsukihashi:ISIJ Int.50(2010) 702711.
12) X. Yang, H. Matsuura and F. Tsukihashi: Mater. Trans. 51 (2010) 10941101.
13) X. Yang, H. Matsuura and F. Tsukihashi:ISIJ Int.49(2009) 1298 1307.
14) X. Yang, H. Matsuura and F. Tsukihashi:Tetsu-to-Hagané95(2009) 268274.
15) S. Kitamura, S. Saito, K. Utagawa, H. Shibata and D. G. C. Robertson:
ISIJ Int.49(2009) 18381844.
16) X. Gao, H. Matsuura, I. Sohn, W. Wang, D. Min and F. Tsukihashi:
Metall. Mater. Trans. B43(2012) 694702.
17) X. Gao, H. Matsuura, I. Sohn, W. Wang, D. Min and F. Tsukihashi:
Mater. Trans.54(2013) 544552.
18) X. Gao, H. Matsuura, M. Miyata and F. Tsukihashi:ISIJ Int.53(2013) 13811385.
19) F. Pahlevani, S. Kitamura, H. Shibata and N. Maruoka:ISIJ Int.50
(2010) 822829.
20) M. Hasegawa, Y. Kashiwaya and M. Iwase:High Temp. Mater. Proc.
31(2012) 421430.
21) H. Takeshita, M. Hasegawa, Y. Kashiwaya and M. Iwase: Steel Research Int.81(2010) 100104.
22) E. T. Turkdogan:Physical Chemistry of High Temperature Technology, (Academic Press, New York, 1980) p. 7.
23) W. Gutt:Nature197(1963) 142.
24) E. T. Turkdogan:ISIJ Int.40(2000) 964970.
25) S. Ban-ya and S. Matoba: Tetsu-to-Hagané48(1962) 925932. 26) K. Yamada and E. Kato: Tetsu-to-Hagané65(1979) 264272. 27) H. G. Hadrys, M. G. Frohberg and J. F. Elliott:Metall. Trans.1(1970)
18671874.
28) D. Dutilloy and J. Chipman: Teans. Metall. Soc. AIME218(1960) 428. 29) H. Sakao and K. Sano: J. Japan Inst. Metals23(1959) 671674. 30) A. Tagaya, F. Tsukihashi and N. Sano: Trans. ISS11(1991) 6369. 31) E. T. Turkdogan:Physical Chemistry of High Temperature Technology,