Real-Time Process Control System of Dieless Tube Drawing
with an Image Processing Approach
Sugeng Supriadi
+, Tsuyoshi Furushima and Ken-ichi Manabe
Mechanical Engineering Department, Tokyo Metropolitan University, Tokyo 192-0397, Japan
Dieless tube drawing is one of the advanced material forming technologies to reduce cross section area of a tube with the absence of dies, mandrel and lubricant. However, this promising technique has technological challenges to improve dimensional stability and accuracy. Machine vision based on image processing technique was selected to monitor deformation behavior on dieless drawing process. The present paper describes real-time monitoring using image processing approach in order to achieve real-time process control of dimensional profile and temperature distribution during dieless drawing process. The results show that machine vision is effective and efficient to monitor dieless drawing process. [doi:10.2320/matertrans.MF201118]
(Received August 18, 2011; Accepted December 26, 2011; Published February 15, 2012)
Keywords: tube dieless drawing, machine vision, real-time monitoring
1. Introduction
The interest inflexible forming is now growing worldwide in the past two decades.1) It is because flexible forming allowed the manufacturer to compete on product differ-entiation and deliver product to the market as soon as possible. The principle of flexible metal forming is to use simple tools, whose position and speed can be controlled to adapt with various workpiece, and desired product shapes.2)
Dieless drawing is one of advanced material forming technologies that can be classified asflexible forming process with the absence of die materials. Various reduction ratios can be achieved without changing the tools. Reduction on dieless drawing is controlled by ratio of feeding speed and drawing speed. Compared with conventional die drawing process dieless drawing have several advantages; the ability to draw low formability materials such as shape memory alloys which are susceptible to strain hardening,3) the ability to produce variable cross-section tube or wire,47)and to fabricate micro-wire and micro-tube since the process is frictionless.810)
Dieless drawing has a technical challenge of increasing dimensional accuracy and reliability.11) Some efforts on theoretical study, Finite Element Analysis (FEA) and experimental study were carried out to improve dimensional accuracy and stability. Fortuner et al. investigated that stability and acceptably constant reduction can be achieved by controlling maximum temperature in very small inter-val.12) Furushima et al. proposed control of drawing speed
acceleration to prevent unstable local deformation using Finite Element Analysis (FEA) approach.13)The problem of
theoretical and FEA approachs are only suitable under ideal condition, while in the actual condition of dieless drawing has many disturbance and unknown variable that affect to the dieless drawing process.
Tiernan et al. introduced a novel control strategy to monitor dieless drawing dimensional stability experimentally. This method was executed to ensure a steady-state process and a high tolerance on the drawn diameter by controlling drawing load in to acceptable variation. However this
technique is difficult to apply on different processing condition such as different materials, processing temper-atures, processing speeds and workpiece size.14)It is due to each processing condition have specific drawing load. Huh
et al.performed real-time control of dieless drawing process by using laser micrometer to monitor dimension of drawn specimen after moves to cooling zone.15) However this technique is less effective since sensing position was not in deformation zone. When unstable deformation occurs, it is difficult to recognize the changing of deformation immedi-ately. It makes improper response from the controller. As the result, oscillation was occurred in the drawn part. It is concluded that sensing technique is essential for to achieve high quality of dieless drawing products. The requirement of sensor for dieless drawing are; not destruct the dieless drawing process, adaptable with complex dieless drawing apparatus, can measure directly on the deformation zone, and
flexible in measuring position. The flexibility on measuring position is important, since deformation zone shifting during process which is depends on feeding speed, reduction ratio, and heating length.16,17)
In other hand, temperature distribution as one of key point to control deformation behavior depends on selected processing conditions and disturbances. By applying another image processing technique intensity of the image can be used to predict process temperature distribution.18)This paper
describes the utilization of machine vision technique to monitor dimensional profile and temperature distribution simultaneously.
2. Principle of Dieless Drawing Process
Dieless drawing is a heat assisted forming technique to reduce cross section area of tube workpiece without any dies and mandrels. Deformation in the drawing occurs due to applying local heating and uniaxial tensile load. Induction heating, electric resistance heating, laser, microwave heating are common technique to produce narrow heating area. In order to maintain narrow temperature distribution, cooling system is utilized. The deformation occurs at heated zone due to decreasing offlow stress. Figure 1 shows basic principle of
+Corresponding author, E-mail: sugeng@eng.ui.ac.id
Special Issue on Advanced Tube Hydroforming Technology for Lightweight Components
dieless tube drawing process by using induction heating coil as heating source and double cooling system. The uniaxial tensile load is created by applying drawing speed (v1) faster
than feeding speed (v2).
There are three zones during dieless drawing process:13) (1) Non-steady state. It is formed in the beginning of
dieless drawing process when drawing speed is gradually increased. As the result, taper profile is produced. This stage is a critical process in dieless drawing process because failure usually occurs in this stage;
(2) Steady state. It is formed when ratio of drawing and feeding speeds are kept constant;
(3) Deformation zone. Reduction from original radius in to desired radius occurs in this zone.
Reduction in radius of for the three zones obeys volume constancy law which mentions that volume before and after dieless drawing is similar as expressed in eq. (1). Where R0
is initial radius, R1 is drawn radius, v2 is feeding speed, v1
is drawing speed and t is time. Therefore drawn radius is controlled by a ratio of v1 and v2 as shown in eq. (2).
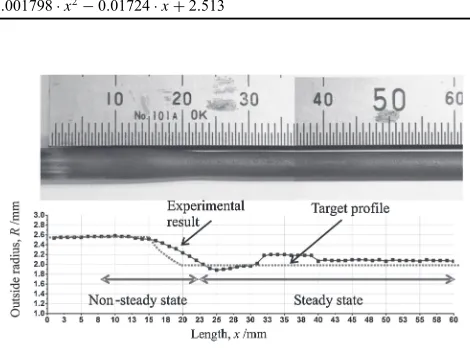
However, the problem on dimensional accuracy appears in the practical dieless drawing process that disobey the reduction rules as shown in Fig. 2. The dimensional problem occurs in non-steady and steady state process.
v2ðtÞ2R0ðtÞ ¼R1v1ðtÞ2 ð1Þ R1ðtÞ ¼R0 ðv1ðtÞ=v2ðtÞÞ0:5 ð2Þ
3. Machine Vision
In order to improve dimensional accuracy of dieless drawing product, a real-time control system is necessary to be done. A reliable control system requires in-situ monitoring process. Contactless monitoring system such as machine vision has been developed to deal with a very sensitive and difficult measuring condition.18) However, at the elevated temperature of dieless drawing workpiece emits a wide range of wavelength that makes difficulties to get focused image. It is due to the wide range of wavelengths were focused by camera lenses on the CCD sensor with different focusing distance. High contrast and focused images are required to
analyze workpiece dimension. Therefore, infrared-pass (IR)
filter is used to select a specific wavelength toward CCD sensor to achieve high contrast and sharpness of hot workpiece images.19)
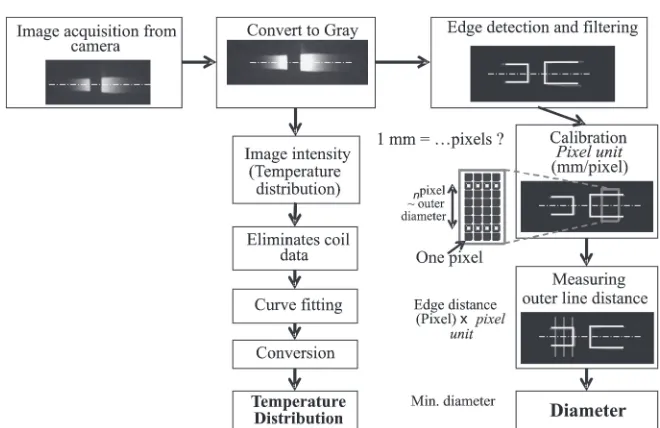
After qualified images were captured, the next process is to get valuable information from the image by applying image processing. Figure 3 shows an algorithm to analyze dimen-sion and temperature distribution. An image is grabbed from CCD camera. Then, the color image is converted to a gray image in order to perform edge detection. Afiltering process is conducted to remove noise on the image. For measuring purposes, it is important to calculate a unit pixel. The unit pixel is defined as a unit length in the metric system per one pixel of the image. The unit pixel is obtained by comparing the initial tube diameter with the number of pixels of that makes up the parts. The outer tube diameter is 5 mm and the distance between two outer lines from image processing is 82 pixels, therefore the unit pixel is 0.06 mm/pixel. The diameter of workpiece is calculated by multiplying the number of pixels between tube outer lines with the unit pixel. Since the output from machine vision only radius in time domain (R(t)), while the desired target shape is radius inx
domain. Therefore, component ofxshould be calculated. The
x component is dieless drawing is a displacement due to applying drawing speed. However from the terminology of product,xis length along axial direction. In the steady state zone, the displacement is calculated by integration of v1.
While in the non-steady state zone, x is calculated by integration ofv1 and multiplied by correction function. It is
due to the displacement at the beginning of process not only occurs in on non-steady state zone but also on deformation zone. Therefore, a correction is needed to calculate the displacement.5)
Temperature distribution is analyzed from the intensity data of the grayscale images. The basic principle of temperature measurement is manipulation of infrared inten-sity from heated workpiece. Figure 3 shows algorithm to calculate temperature distribution. The infrared intensity
Fig. 1 Principle of dieless drawing process.
[image:2.595.309.544.128.302.2]Fig. 2 Dimensional problem in dieless drawing process. Table 1 Various taper profile functions.
Shape Assymetric profile function (R(x))
1 RðxÞ ¼ 0:02274xþ2:50
2 RðxÞ ¼2:871e006x40:0002034x3þ0:005527x2þ 0:08092xþ2:498 3 RðxÞ ¼ 7:01e005x3þ0:001798x20:01724xþ2:513
increases with increasing temperature. Since infrared
pass-filter is employed, only infrared light that can enter the camera sensor. The high infrared intensity increases bright-ness level on the specimen images.
4. Finite Element Analysis (FEA)
The objectives to conduct FEA are to clarify dimension measurement result of the machine vision process and to compare machine vision result with another sensing tech-nique. The FEA was carried out by using commercial software MSC Marc 2005. Figure 4 shows the schematic of dieless forming model in the FEA. Tube wall is modeled axisymetrically by using five nodes. Induction heating was simulated by using heat flux subroutine. Heat flux quantity was adjusted to achieve max processing temperature similar to experimental condition. Cooling system was applied with increasing heat transfer under cooling. The material model and thermal boundary conditions are given in Table 2. Heating length (Hl) was set at 4 mm. Feeding speed was kept
constant at 0.5 mm/s. An isotropic material model was used in the FEA considering strain hardening (n), strain rate sensitivity (m) as function of temperature.20) The elevated
temperature decrease flow stress at heating zone. Therefore reduction in cross sectional area occurs in the heated part. The temperature distribution of this model was clarified with the experimental data as reported in previous works.13,21) Therefore, the validity of the FEA of dieless forming process has been validated. Figure 5 shows incremental of outer radius profile during dieless drawing from the result of FEA to clarify machine vision process.
5. Experimental Method
Figure 6 shows dieless drawing experimental apparatus. A horizontal type dieless drawing machine was utilized in this
Fig. 3 Algorithm of dimensional and temperature monitoring.
[image:3.595.132.462.63.277.2]Fig. 4 Schematic offinite element model of dieless drawing process.
Table 2 Boundary conditions of dieless forming process and material model of SUS 304.
BOUNDARY CONDITIONS
Heating temperature (°C) 1100
Heating length,Hl(mm) 18
Cooling Length,Cl(mm) 5
Heat coefficient of cooling,hc(W.mm2.K¹1) 1000 Heat coefficient of radiation to air, ha(W.mm2.K¹1) 30
Air temperature (°C) 25
Water cooling temperature (°C) 20
Thermal conductivity (W/m.K) 16.3
Specific heat (J/kg.K) 502
Mass density (g/m3) 8030
MATERIAL MODEL
·¼K¾n_¾m
KðTÞ ¼7104T22:1417Tþ1788:3 nðTÞ ¼4:645107T23:628104Tþ0:4367 mðTÞ ¼4:374Tþ1:449103
Where:
[image:3.595.49.287.319.496.2] [image:3.595.304.551.342.566.2]work. Dieless drawing machine consists of specimen clamps and motor system to feed and to pull the specimen, induction and cooling coils, and supporting structure. Dieless drawing machine was equipped with a high frequency induction heating (2.2 MHz) and water cooling system to realize local heating. Induction power can be set to achieve processing temperature up to 1100°C. Distance from heating coil to cooling coil was set at 7.5 mm. Stainless steel SUS 304 tube of 5 mm outer diameter and 1 mm thickness was used in this work. Fixed reduction ratio target and variable reduction along axial direction target were prepared. Various fixed reduction ratios were set at 30, 40, and 50%reduction ratio. Three different variable reduction ratios in axial direction were prepared as given in Table 1. Drawing and feeding speed to produce those targets are shown in Figs. 7(a) and 7(b).
Fig. 5 Outer radius profile along axial direction at the sequence of time which obtained from FEA.
Fig. 6 Dieless drawing machine configuration feeding and machine vision to monitor dieless drawing process.
Fig. 7 (a)v1andv2to produce different reduction ratio (b)v1andv2to produce three different shapes.
[image:4.595.55.282.68.233.2] [image:4.595.105.493.292.568.2] [image:4.595.88.509.621.770.2]Machine vision system was conducted by using commer-cial video camera, infrared filter, and Matlab for image processing software. The output from video camera is an RGB 24 bit image with 720©680 pixel size. Optical measuring microscope is used to measure drawn part in order to verified dimension measurement using machine vision technique. Temperature monitoring was carried out using image processing technique which is clarified and calibrated by using thermocouple.
6. Results and Discussion
6.1 Dimensional measurement
Machine vision allowedflexible measurement position and wide measurement area. All parts in the captured images can be measured as shown in Fig. 6. Therefore multi-section measurement can be done. Laser micrometer that used by previous only allowed single-section measurement.15) A lot
of laser micrometer should be prepared to do multi-section
measurement. However, it is difficult to apply in dieless drawing process because limited workplace in the apparatus as shown in Fig. 6.
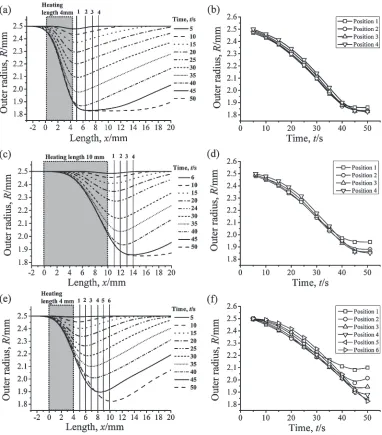
Figure 8(a) shows four section measurements from the FEA result. Figure 8(b) shows measurement result that indicated different measurement result from each section. For single-section measurement, measuring position is critical because affects on the measuring results. In the dieless drawing process is important to monitor the minimum radius (necking) to prevent failure and drawn accuracy. Single-section measurement is cannot identify the necking that shifts with increasing reduction ratio. When heating length is increase to 10 mm, variation from each measuring section increases as shown in Figs. 8(c) and 8(d). For some dieless drawing application, cooling coil is undesired.8,9,13,16)
By eliminating cooling system deformation zone significantly expands. Measuring section should be added in order to monitor necking behavior as shown in Figs. 8(e) and 8(f ). Those results show than variation from each measuring
[image:5.595.108.490.69.504.2]section increase with expanding deformation zone. Machine vision could conduct multi-section measurement and find minimum radius (necking) by using one camera. It makes machine vision effective and efficient as sensor for dieless drawing process.
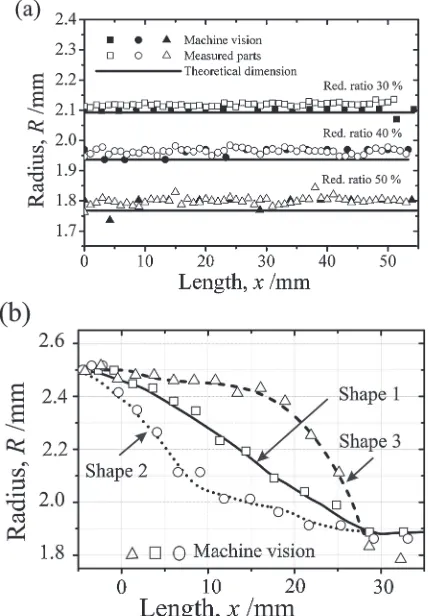
Dieless drawing reduction ratio obeys volume constancy theory as shown in eqs. (1) and (2), however the equations is not consider process parameters such as, heating length, cooling system, processing speed and workpiece geometry. Figure 9(a) shows that the experimental result is bigger than theoretical result, while high radius variation increases with increasing reduction ratio. Therefore real-time dimensional sensing is essential to obtain high drawn quality to improve process capability especially under various processing conditions. The figure also shows machine vision result on various reduction ratios that performs a good agreement with optical microscope measurement. It shows that machine vision is applicable to monitor dimensional accuracy of dieless drawing process duringfixed reduction.
The dimensional monitoring for variable sectional profile along axial direction is more complex, since it is not only focused in radius measurement but also in x direction, whereas x is displacement due to applying drawing speed. The output from machine vision is a radius in time domain so that it should be converted to x domain (R(x)). An accurate calculation of x is essential for correct measure-ment. In the previous work, x displacement was calculated by integrating drawing speed and multiplied by a correction function.5) Figure 9(b) shows that machine vision results
has good agreement with measured parts. There are several factors that contribute to measurement error such as the effect of thermal expansion, low image size, image noise and
fitting problem between measurement and machine vision results.
6.2 Dimensional measurement verification using the FEA
The deformation of dieless forming is initiated by an asymmetric necking phenomenon which is located in heating area. When radius measurement is conducted by using FEA, accurate radius measurement during necking process can be obtained easily. However necking phenomena is cannot be observed properly by using machine vision because this phenomena was blocked by induction heating coil. After the length of deformation zone expands over the heating coil width, machine vision can measure the minimum radius of drawn part accurately. The length of deformation zone increases with increasing reduction ratio. This behavior can be seen in Fig. 10. In the beginning of dieless drawing process, minimum radius measurement by using machine vision result is higher than the FEA result. However over 30 s, machine vision result and the FEA result shows excellent agreement. It shows that in accurate measurement on variable sectional profile using machine vision technique is caused by technical problem of camera position. Stereo machine vision can be developed to optimize this method.
6.3 Temperature distribution
Temperature distribution is changing with increasing reduction ratio.18) It is important to monitor temperature
distribution during dieless drawing process to maintain reduction stability. By using machine vision process, intensity data is transformed as temperature data by using simple approach. Figure 11(a) show the result brightness intensity data and a Gaussian curvefitting. Gaussian function is selected because temperature distribution has good agree-ment with Gaussian function. When curve fitted data is compared with thermocouple data, similar profile is observed as shown in Fig. 11(b). Therefore it requires an equation to convert brightness intensity become temperature value similar as thermocouple data. Equation (3) is constituted to convert brightness intensity to temperature (T). Where,Biis
[image:6.595.63.277.72.380.2]Fig. 9 (a) Figure 3(a) machine vision results forfixed reduction ratio at 30, 40 and 50%and (b) taper profiles on non-steady state zone.
[image:6.595.323.531.72.225.2]brightness intensity,TProcessing(Max.) is maximum processing
temperature, TBi³0 is temperature when brightness intensity
equal to zero, andBi(Max.) is maximum brightness intensity. The equation variables depend on IR-pass filter number which is affect to theTBi³0, camera characteristics which is
affect to theBi(Max.) and the materials which is affect to the
TProcessing(Max.), for SUS 304 maximum processing temper-ature is 1100°C. The intensity value was based on 8 bit gray image which means the image only consist of 256 brightness intensity (Bi) level from zero (black) up to 255 (white).
T ¼Bi ððTProcessingðMax:Þ TBi0Þ=BiðMax:ÞÞ þTBi0 ð3Þ
The conversion result from brightness intensity to temper-ature shows excellent agreement with thermocouple data as shown in Fig. 12(a). Similar temperature distribution was also observed by using different IR-filter as shown in Fig. 12(b). The increasing number of IR-filter increases
TBi³0because high IRfilter decrease amount if infrared light
that transfer to camera sensor, as the result all brightness level decreases.
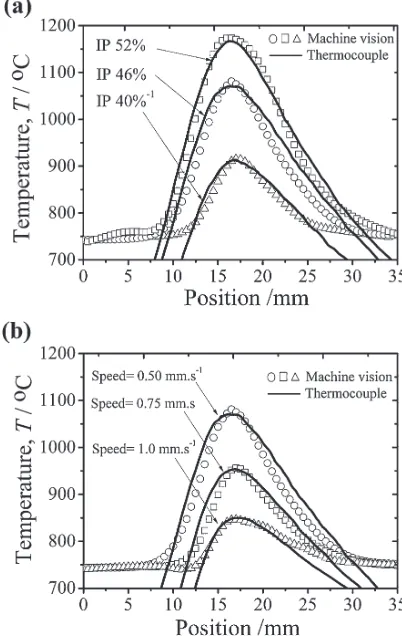
[image:7.595.63.277.70.378.2]In order to verify the image processing algorithm for temperature distribution measurement during increasing processing temperature, machine vision also was conducted with different induction power setting. Figure 13(a) shows temperature distribution data from thermocouple and ma-chine vision that exhibit good agreement. Another verifi ca-tion on temperature distribuca-tion variaca-tion was carried out with increasing feeding speed. As shown in Fig. 13(b), the increasing feeding speed decreases the temperature and shifts the temperature distribution. Machine vision result shows
[image:7.595.327.528.74.376.2]Fig. 11 (a) Brightness intensity level along deformation zone (b) curve fitting of brightness intensity and termocouple data.
Fig. 12 (a) Temperature measurement using converted brightness intensity in machine vision and termocouple data18)(b) temperature distribution measurement using machine vision with various IRfilter number.
[image:7.595.325.526.433.752.2]good agreement with thermocouple data during the increas-ing feedincreas-ing speed. Therefore, it shows that machine vision result on temperature distribution monitoring is valid with various condition of dieless drawing process.
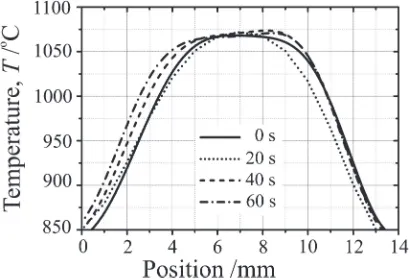
Figure 14 shows dynamic of the temperature distribution during shape 1 fabrication. Temperature distribution shrink-ing at 20 s is caused by increasshrink-ingv2which also increases the
heat transfer rate. Effect of geometrical change on heat transfer capacity is shown in the different temperature distributions at 0 and 60 s. Therefore it is important to conduct real-time monitoring in order to achieve precise control of dieless drawing process because that the heating temperature distribution varies during process.
7. Conclusions
High accuracy and precision dieless drawing part requires real-time control. Whereas the real-time control need reliable sensing technique. Machine vision with image processing technique was proposed to build appropriate real-time sensing for dieless tube drawing. In this paper development on image acquisition technique and image processing process for dieless drawing were described which followed con-clusions:
(1) Machine vision is appropriate to monitor dieless drawing process because:
(a) Flexible and simple sensing tool, Machine vision camera can be placed freely outside of dieless drawing apparatus that has complex machine structure and supporting parts.
(b) Reliable sensing method, machine vision camera able to monitor dieless drawing process free from potential harmful conditions such as high temper-ature of workpiece, magnetic field from the
induction heating coil and splashing water from cooling system.
(c) Machine vision able to do multi-section measure-ment along deformation zone effectively and efficiently. Number of section and range can be set according to processing condition.
(d) Machine vision able to detect temperature fl uctua-tion on dieless drawing process which is important to maintain process stability.
(2) Dimension measurement from machine vision shows good agreement with FEA results. Whereas temperature distribution from machine vision also shows good agreement with thermocouple measurement.
REFERENCES
1) J. M. Allwood and H. Utsunomiya:J. Machine Tools Manuf.46(2006) 19391960.
2) M. Gliga and T. Canta: Wire Industry (1999) 294297.
3) Y. Kawaguchi, K. Katsube, M. Murahashi and Y. Yamada: Wire J.12
(1991) 5358.
4) O. Pawelski, W. Rasp and K. Schmeisser: Proceedings of the 31st MATDOR Conference, Manchester (1995).
5) Z. T. Wang, G. F. Luan, G. R. Bai, K. Kobatake and H. Sekiguchi:
J. Mater. Process. Technol.59(1996) 391393.
6) Z. T. Wang, S. H. Zhang, G. F. Luan and G. R. Bai:J. Mater. Process. Technol.120(2002) 9093.
7) W. Wengenroth, O. Pawelski and W. Raps: Steel Res.72(2001) 402 405.
8) T. Furushima and K. Manabe:J. Mater. Process. Technol.187188
(2007) 236240.
9) T. Furushima and K. Manabe:J. Mater. Process. Technol.191(2007) 5963.
10) Y. Li, N. R. Quick and A. Kar:J. Mater. Process. Technol.123(2002) 451458.
11) M. D. Naughton and P. Tiernan:J. Mater. Process. Technol.191(2007) 310313.
12) R. Fortuner, H. Sassolas and F. Montheillet: Int. J. Mech. Sci.39(1997) 56155627.
13) T. Furushima, S. Hirose and K. Manabe:J. Solid Mech. Mater. Eng.3
(2009) 236246.
14) R. Carolan and P. Tiernan: J. Mater. Process. Technol. 209(2009) 33353342.
15) Y. Huh, B. K. Ha and J. S. Kim:J. Mater. Process. Technol.210(2010) 17021708.
16) T. Furushima, T. Ikeda, Y. Noda and K. Manabe: Steel Res. Int. Special Edition (2011) 302307.
17) S. Supriadi, T. Furushima and K. Manabe: Proc. of the 2011 Jpn. Spring Conf. for Tech. of Plasticity, May 2729, (2011) pp. 632634. 18) S. Supriadi, T. Furushima and K. Manabe: Proc. 5th Int. Conf. on Tube
Hydroforming, TUBEHYDRO2011, (2011) pp. 9295.
19) S. B. Dworkin and T. J. Nye:J. Mater. Process. Technol.174(2006) 16.
20) S. Hashizume: J. JSTP6(1965) 7175 (in Japanese).
[image:8.595.67.272.71.211.2]21) S. Supriadi, T. Furushima and K. Manabe: Proc. 61st Jpn. Joint Conf. Tech. Plasticity (2010) pp. 8990.
Fig. 14 Temperature distribution history of shape 1 from 0 to 60 s by using machine vision.18)