Microstructure and Texture of Al
2Si
x
Sn (
x
=
0, 4, 8 mass
%
) Alloys
Processed by Equal Channel Angular Pressing
Gonzalo Gonzalez
1, Chedly Braham
2, Jean L. Lebrun
3, Yvan Chastel
4,
Wilfrid Seiler
2and Ignacio A. Figueroa
11Instituto de Investigaciones en Materiales, Universidad Nacional Autónoma de México,
Circuito Exterior S/N, Cd. Universitaria, A.P. 70-360, Coyoacán, C.P. 04360, México
2Laboratoire Procédés et Ingénierie Mécanique et Matériaux ENSAM, 151, bd de l’Hôpital 75013, Paris, France 3Laboratoire Arts et Métiers ParisTech d’Angers (LAMPA), 2, bd du Ronceray 49035, Angers, France
4Centre de Mise en Forme des Matériaux, Ecole de Mines, 1, rue Claude Daunesse BP 207, 06904 Sophia-Antipolis Cedex, France
The influence of Sn on the microstructure, microstrain and grain morphology in Al2SixSn samples processed by ECAP is reported and discussed. The pseudo-binary AlxSn alloys (where x=0, 4, 8 mass%) were produced by conventional ingot casting. Samples were characterised by X-ray diffractometry (XRD), transmission electron microscopy (TEM), dynamical mechanical analysis (DMA) and microhardness. Results showed that the initial texture was modified after several ECAP passes and the formation of subgrains were observed. The presence of Sn enhanced the tribological properties of the alloy but, the ECAP capacity for grain refining was reduced. Besides, it was also confirmed that the damping capacity and microhardness behaviour were dependent of the Sn contents. [doi:10.2320/matertrans.M2012011]
(Received January 6, 2012; Accepted April 23, 2012; Published June 25, 2012)
Keywords: aluminium alloys, equal channel angular pressing, nanograins, transmission electron microscopy, Rietveld refinement
1. Introduction
In the recent years, there has been considerable scientific and industrial interest in severe plastic deformation produced by ECAP (Equal Channel Angular Pressing). The ECAP process in aluminium alloys can produce equiaxed grains of submicrometer sizes and, in some cases, a spectacular ductility enhancement can be achieved.1)Some binary alloys with high plastic deformation that belongs to FCC and BCC cell types have been studied, especially under condition of extrusion, wire drawing and rolling. In the last two decades the main efforts have been focused on Cu or Al systems, with body centred cubic (bcc) second phase such as Nb or Ta, i.e., CuX (where X=Nb, Ta, Cr, V or Fe),28) having the objective of increasing the mechanical strength of these alloys. In the 1990’s, some studies started with hexagonal (hcp) metals including TiY,9,10)MgTi,11)AlTi12)and Al Mg,13) however, the understanding of the fundamental mechanisms controlling the mechanical deformation and the microstructure evolution is still unclear.
At present, there are some studies on the deformation behaviour of two cell such as the combination FCC-BCC and Hex, however, the reports on the combination of FCC-Tetragonal cells are still underway. Previous studies have shown that the addition of Sn enhances the UTS of Al based alloys due to the HallPetch mechanism (an increase of 40% on the ultimate tensile strength was obtained with a deformation ©=6.5). These experiments were carried out under high deformation conditions by means of a process of rolling.14)In this study, we will continue these results with a series of ECAP experiments. The AlSn alloys are usually employed as bearings; this is due to their good combination of strength and frictional behaviour properties. The latter property could be interesting during the ECAP process, as this alloy has not been investigated in such conditions. Our objective is to characterise this alloy and investigate the role, beneficial or not, that the Sn could have. Several techniques
concerning the characterisation of microstrain, grain size and crystal texture will be employed.
2. Experimental
Commercial aluminium (Al) containing 2%massSi alloy was melted with Sn in order to achieve the nominal composition Al2SixSn alloys (where x=0, 4, 8 mass%). The ingots were machined into rod shape with cross section of 16 mm©16 mm and length of 130 mm. The rods were then angular extruded at room temperature. The ECAP die consisted of two separated blocks of tool CrV tool steel (H13), which were held together to form a single internal channel having the same square cross section. The angle between the two channels was 110 degrees. The surface of the internal channel was lubricated with MoS2powder and oil in order to reduce the friction between the die wall and the alloy rod. The ECAP passes were performed with a rotation of 180 degrees between the passes.
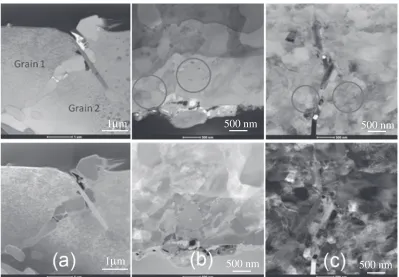
Before starting the ECAP process, the samples were observed by optical microscopy. A standard metallographic preparation was performed over the samples prior the observation. For higher magnification, microstructural char-acterisation by transmission electron microscopy was used with a FEI TECNAI G2. The thin foils samples were prepared by means of the focus ion beam technique (PHILIPS FIB 200).
The determination of the crystallographic texture was performed on a X’Pert MRD 4 circles diffractometer, with
K¡Cu at 40 KV and 40 mA. The device has a primary optical
breadth (¢) peak, following eq. (1):
¢cosðªÞ
¼
1 Dþ4¾
sinðªÞ
ð1Þ
Although the WilliamsonHall model is merely qualitatively, it can evidence the correlations between the number of ECAP passes and the strain and/or crystallite size broadening. The plot of¢cosðªÞvssinðªÞgives directly the crystallite size and the strain from the ordinate intersection and the slope of the linear fit of the experimental points. Within this approach, a slope zero means that the strain is negligible and crystallites are spherical on average. The slope values different of zero represent a strain contribution to the broadening.
More accurate measurements of microstrain and crystallite size values were performed by X-ray diffraction and the Rietveld Method (using FULLPROF program). The refining calculations were based on the use of a pseudo-Voigt-TCH profile. The instrumental function was taken from a calibrated LaB6powder standard.
The FWHM LorentzianHland Gaussian Hg were refined according to the following formulae:
Hg2¼Utan2ðªÞ þ Ig
cos2ðªÞ ð2Þ
Hl¼XtanðªÞ þ Y
cosðªÞ ð3Þ
Where U, X are parameters that depend on strain and Y, Ig depend on crystallite size, andªis the diffraction angle. For a pseudo-Voigt profile, the integral breadth ¢ is related to H and ©(mixing GaussLorentz parameter) as follows:
¢¼ ³ 180
³ 2
H
©þ ð1©Þpffiffiffiffiffiffiffiffiffiffiffiffiffiffi³lnð2Þ: ð4Þ
For separating the Lorentzian and Gaussian contributions, the formula ThompsonCoxHastings (TCH) pseudo-Voigt is assumed:
H5¼Hg5þ2:69269Hg4Hlþ2:42843Hg3Hl2
þ4:47163Hg2Hl3þ0:07842HgHl4þHl5 ð5Þ
The Gaussian and Lorentzian integral breadth are then substituted into the well known StokesWilson formula
¾¼4 tan¢ðªÞ, and the Scherrer equationD¼¢cosðªÞfor thefinal calculation of the microstrain and crystallite size. Since the integral breadth ¢ depends onH and ©, the contribution of both Lorentz and Gaussian profiles to the size and strain effects, gives in a more realisticfitting.
The dynamic mechanical analysis technique (DMA) has been used in order to study the changes in the damping
imaginary parts of the complex elastic modulus, respectively. The damping capacity is defined as:
tanð¤Þ ¼E00
E0: ð8Þ
In this study, we have correlated this quantity with the Sn content and number of ECAP passes. The damping capacity should increase if the number of boundaries grows, so it is an indirect way to know if the ECAP process produces an efficient grain refining.
Microindentation tests were performed on a microhardness tester (Shimadzu HMV-2000). Vickers hardness was calcu-lated from average of ten measurements using 50 g and 15 s loading time measurements. Prior to the indentation, the specimens were electropolished; the measurements were done parallel to the extrusion direction, since the microhard-ness is indirectly a measure of the cold work realized during the extrusion.
3. Results
Figure 1 shows some optical micrographs of the Al2Si xSn samples with the grain size and morphology before the ECAP process. Additions of Sn in the alloy, Figs. 1(a)1(b), does not produce any substantial changes in the micro-structure, however, in the interface between the Al and Sn, the electrochemical attack was more severe and the grain boundaries appear to be darker. The average diameter size estimated was 50 microns.
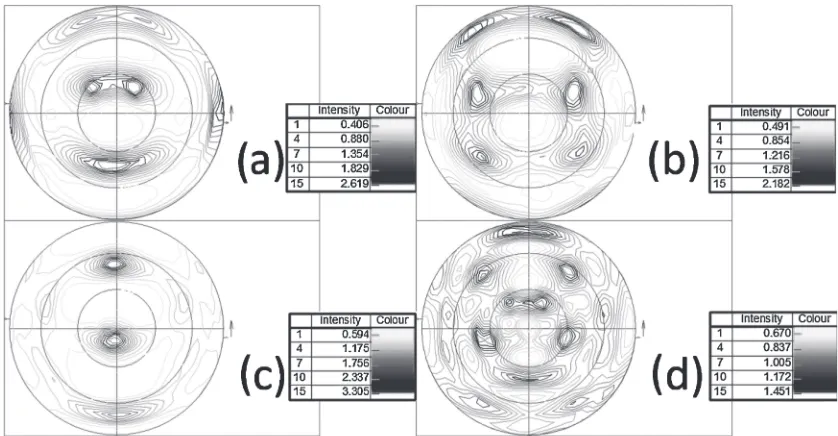
From the pole figures examination of the samples before ECAP, we found that the grains are too large, so there is not enough sampling to make proper measurement by this tech-nique (grain size ranges from 20 to 50 microns in diameter). After the 1st ECAP pass, it appears a strong crystallo-graphic texture. The polefigures are quite similar for all the Sn contents. Figure 3 shows the results for 4%Sn, they are compatibles with a texture component{001}h110iandf112g
h110i. The types of orientation and the intensity of the texture are the same for the different Sn contents studied (average intensity ratios are: 6.92 for 0%Sn, 6.5 for 4% Sn and 6.80 for 8% Sn). It should be noted that the grain number in the volume analysed is large enough, qualitatively demonstrating that the grain size of the material has certainly greatly reduced after thisfirst pass of ECAP.
After 2nd pass, the polefigures are similar for the 3 sample types. On the contrary to what we observed after the 1st pass of ECAP, the intensity ratios vary from one sample to another, (see Fig. 4); which are:
0%Sn: average intensity ratio=3.6 4%Sn: average intensity ratio=5.5 8%Sn: average intensity ratio=2.15
The type of texture is the same,{145}h111i, but the intensity of the texture is much higher for the sample with 4%Sn. The presence of 8%Sn has reduced the texture compared to a Sn-free material. This effect could be beneficial for the alloy.
As summary, on the flow plane, the 1st pass of ECAP generates two texture components: {001} h110i and f112g
h110iin which the planes (001) andð112Þare separated by an angle of 35°. On the other hand, the 2nd pass generates only
Fig. 1 Optical micrographs of the samples showing their initial microstructure before the ECAP process: (a) Al2Si (b) Al2Si4Sn and (c) Al2Si8Sn.
1μm
1
μ
m
500 nm
500 nm
500 nm
500 nm
[image:3.595.85.511.70.246.2] [image:3.595.99.498.292.569.2]one texture component{145}h111i, which intensity depends on Sn content.
Figure 5 shows the effect of the microstrain and particle size on the breadth of the Al diffraction peak (311) for 0 mass% of Sn content, the referred peak was shifted in 2ª and normalised in order to appreciate clearly the XRD broadening effect of ECAP on these alloys. This figure clearly displays the effect of each pass on the diffraction peak broadening, where the main difference was observed between the undeformed sample and the first ECAP pass. However, the difference between thefirst and the second pass was very marginal and could lay within the experimental scatter.
Figures 68 show the Williamson-Hall plots for different Sn contents as a function of the ECAP passes, they show a clear correlation between the strain (slope), the size particle (reciprocal of the ordinate intersection) and the number of ECAP passes. Because of the large initial particle size at
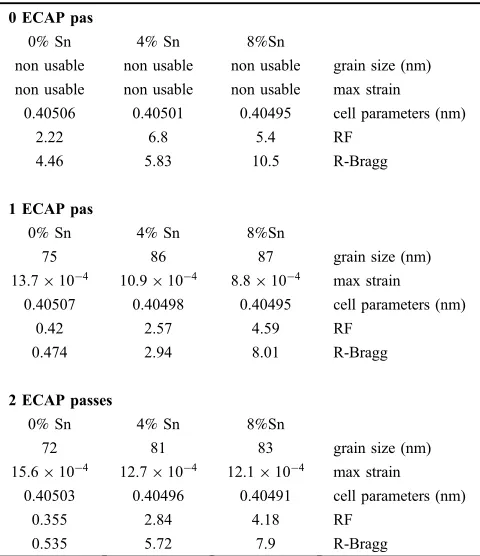
0 pass, the instrumental integral breadth has the same magnitude order than the observed breadth, therefore the measured particle size are irrelevant for 0 ECAP pass, the same consideration applies for the Rietveld refinement results. Table 1 summarises the data obtained from Rietveld refinement, it is noticed that Sn diminishes the microstrain in the material. At the same time, a tendency exists to increase the crystallite size with the Sn content. At identical chemical composition, the different passes of ECAP in-creased the microstrain. The cell parameter remains almost constant. Such observations tend to speculate that Sn plays a tribological role allowing an easier gliding of the surfaces but with a moderate detrimental effect on grain size.
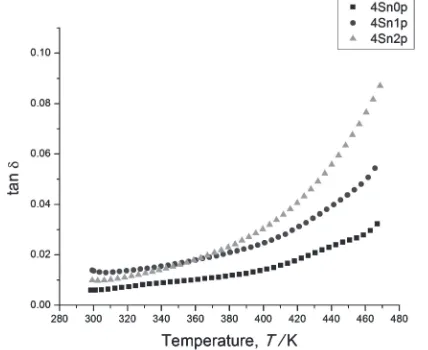
Figures 911 show the damping capacity changes as a function of the temperature, it can be seen that there is quite similar behaviour for 4% and 8% Sn samples, where the damping capacity increases with the temperature and the
Fig. 3 Polefigures of the Al2Si4Sn alloy after 1 ECAP pass: (a) plane (111), (b) plane (200), (c) plane (220) and (d) plane (311).
[image:4.595.89.507.68.290.2] [image:4.595.88.507.328.546.2]number of ECAP passes (Figs. 1011). For the sample without Sn, a different behaviour is observed. Figure 9 shows that the maximum damping occurs for the sample that does not contain Sn and at zero ECAP pass. For 1 and 2 passes of
[image:5.595.324.530.65.222.2]ECAP, the behaviour is very similar. These results confirm that DMA technique and damping behaviour could be used as monitor of grain evolution during ECAP, but also it shows that Sn has an important effect on the elastic behaviour of the alloy. On the other hand, the curves split when the temperature increases, this result was not expected, and suggests a new study at higher temperatures is necessary, and looking for degradation conditions of these alloys will be the objective.
Figure 12 shows the evolution of the Vickers microhard-ness as a function of the Sn content and the number of ECAP passes. The ECAP process increases the Vickers microhard-ness of the alloy, if 2 passes of ECAP are performed, the microhardness value is duplicated. At the same time, it can be observed that Sn content has an effect of diminishing the microhardness. This behaviour is compatible with the DMA results.
Fig. 6 Williamson-Hall plots for the Al2Si alloy at different ECAP passes.
Fig. 8 Williamson-Hall plots for the Al2Si8Sn alloy at different ECAP passes.
0Sn-op
0Sn-1p
0Sn-2p
78° 79°
Intensity (a.u.)
Diffraction angle (2θ)
10 20 30 40 50 60 70
Fig. 5 Broadening effect of 0, 1, 2 ECAP passes for the (311)Alpeak. The
maxima of the profiles are normalized.
[image:5.595.75.263.65.288.2]Fig. 7 Williamson-Hall plots for the Al2Si4Sn alloy at different ECAP passes.
Table 1 Microstrain, grain size, cell parameters and goodness of fit parameters from Rietveld refinement.
0 ECAP pas
0%Sn 4%Sn 8%Sn
non usable non usable non usable grain size (nm) non usable non usable non usable max strain
0.40506 0.40501 0.40495 cell parameters (nm)
2.22 6.8 5.4 RF
4.46 5.83 10.5 R-Bragg
1 ECAP pas
0%Sn 4%Sn 8%Sn
75 86 87 grain size (nm)
13.7©10¹4 10.9©10¹4 8.8©10¹4 max strain
0.40507 0.40498 0.40495 cell parameters (nm)
0.42 2.57 4.59 RF
0.474 2.94 8.01 R-Bragg
2 ECAP passes
0%Sn 4%Sn 8%Sn
72 81 83 grain size (nm)
15.6©10¹4 12.7©10¹4 12.1©10¹4 max strain
0.40503 0.40496 0.40491 cell parameters (nm)
0.355 2.84 4.18 RF
[image:5.595.307.547.291.569.2] [image:5.595.66.279.332.491.2] [image:5.595.65.273.537.692.2]4. Conclusions
The ECAP process can reduce significantly the grain size in only two passes. The texture induced by the process is modu-lated by the different passes but not destroyed. The formation of subgrains seems to be very local, indicating that strain heter-ogeneity exists in the sample (zones where grains are large with practically no dislocation and zones with a high disloca-tion density). The microstrain and grain size measured by XRD showed that Sn plays an important tribological role in the alloy but it reduces the ECAP capacity for refining the grains. Damping capacity and microhardness confirm that Sn affects the elastic behaviour of the alloys and proves that the DMA is a suitable technique for analysing the grain size evolution.
Acknowledgements
The authors would like to thank the funding support for this project by PAPIIT-UNAM through grants IN112010 and IB100712. GG and IAF gratefully acknowledge the funding from DGAPA-sabbatical year and CONACyT-repatriation programme, respectively. Valuable technical support pro-vided by A. Tejeda, O. Novelo-Peralta, G. A. Lara-Rodriguez and C. Flores is also acknowledged.
REFERENCES
1) R. Z. Valiev, D. A. Salimonenko, N. K. Tsenev, P. B. Berbon and T. G. Langdon:Scr. Mater.37(1997) 19451950.
2) J. Bevk, J. P. Harbison and J. L. Bell:J. Appl. Phys.49(1978) 6031 6038.
3) W. A. Spitzig, A. R. Pelton and F. C. Laabs:Acta Metall.35(1987) 24272442.
4) W. A. Spitzig, C. L. Trybus and F. C. Laabs:Mater. Sci. Eng. A145
(1991) 179187.
5) S. Pourrahimi, H. N. Hashemi and S. Foner: J. Mater. Sci. Lett.9
(1990) 14841487.
6) S. Pourrahimi, H. N. Hashemi and S. Foner: Metall. Trans. A23A
(1992) 573586.
7) J. D. Verhoeven, L. S. Chumbley, F. C. Laabs and W. A. Spitzig:Acta Metall.39(1991) 28252834.
8) J. D. Verhoeven, F. A. Schmidt, E. D. Gibson and W. A. Spitzig: J. Metals38(1986) 2024.
9) A. M. Russell, L. S. Chumbley, T. W. Ellis, F. C. Laabs, B. Norris and G. E. Donizetti:J. Mater. Sci.30(1995) 42494262.
10) A. M. Russell, T. W. Ellis and L. S. Chumbley:J. Mater. Sci.30(1995) 20702076.
11) J. A. Jensen, A. M. Russell, T. W. Ellis and L. S. Chumbley:Light Metals, ed. by J. Evans, (TMS, Warrendale, PA, 1995) p. 1367. 12) A. M. Russell, T. Lund, L. S. Chumbley, F. C. Laabs, L. L. Keehner
and J. L. Harringa:Composites Part A30(1999) 239247.
13) K. Xu, A. M. Russell, L. S. Chumbley, F. C. Laabs, V. B. Gantovnik and Y. Tian:J. Mater. Sci.34(1999) 59555959.
14) O. Hernandez and G. Gonzalez:Mater. Charact.59(2008) 534541.
[image:6.595.319.536.62.251.2]Fig. 9 Damping capacity as a function of temperature for the alloy Al2Si. Fig. 11 Damping capacity as a function of temperature for the alloy Al 2Si8Sn.
Fig. 12 Vickers microhardness as a function of ECAP passes and Sn content.
[image:6.595.66.278.74.249.2] [image:6.595.64.278.282.457.2] [image:6.595.316.538.298.438.2]