X-ray Diffraction Study of the Ordered Structures
and Phase Relation in Pd-Mn Alloy System
Suo Yin
1, Miwako Takahashi
1, Rokuro Miida
2, Hiroshi Iwasaki
1and Ken-ichi Ohshima
1;*1
Insititute of Materials Science, University of Tsukuba, Tsukuba 305-8573, Japan
2Tokyo University of Science, Suwa, Chino 391-0292, Japan
This paper reports the results of structural study on the ordered phases formed in Pd-rich Pd-Mn alloys adopting X-ray powder diffraction method. Formations of the tetragonal D023-type Pd3Mn, orthorhombic Pd2Mn and orthorhombic Pd5Mn3reported by previous researchers have
been confirmed. Rietveld refinement of the diffraction data of the latter two phases has determined precisely the atomic parameters and revealed the significance of the shifts of atoms in Pd2Mn. It is shown that the L10-type phase extends to about 33 at% Mn at high temperatures and Pd2Mn
and Pd5Mn3form via two-step ordering from the L10-type phase. A revised phase diagram on the Pd-rich side has been proposed. Discussion is
given on the stability of the relevant ordered phases by making calculation of the total energy by the density functional method.
[doi:10.2320/matertrans.M2010372]
(Received October 26, 2010; Accepted December 17, 2010; Published February 25, 2011)
Keywords: palladium-manganese alloy, ordered structure, X-ray diffraction, atomic phase diagram
1. Introduction
In the past 50 years, structural studies were made for the phases forming on the Pd-rich side of the Pd-Mn alloy system. Primary solid solution of Pd with the face-centered cubic (fcc) structure extends up to about 30% Mn (All the percentages in the present paper refer to atomic %.) and an ordered phase Pd3Mn was found by Watanabe1)by electron diffraction at the composition of 25% Mn. It has a long-period structure based on the L12-type one and is isostruc-tural to the D023-type structure. Sato and Toth2)attributed the stability of the long-period structure to an intimate relation between alloy Fermi surface and Brillouin zone boundaries. Ka´da´r et al.3) proposed on the basis of neutron diffraction
measurements a structure model for the phase Pd2Mn, whose existence was found in an earlier study of Raub and Mahler4)
as 2 phase. Ka´da´r and Kre´n5) also proposed a structure model for the phase Pd5Mn3. Miidaet al.6)made an extensive electron diffraction and microscopic study over the compo-sition range from Pd-24% Mn to 40% Mn and proposed a phase diagram, in which relation among relevant phases is shown.
However, the studies of Watanabe1) and Sato & Toth2) were performed using thin film samples and there might be uncertainty in the composition. In addition, electron diffrac-tion could not afford, due to strong dynamical effects, quantitative information on the atomic parameters. In Ka´da´r et al.’s neutron diffraction study, only a small number of reflections lying in lower diffraction angle region were used and, therefore, not much accuracy could be attached to the detailed structure data.
Manganese shows, unlike other 3d elements, a character-istic behavior as an alloying element and the structure of ordered phases forming in the Mn containing alloys is often of the type not seen in the typical Hume-Rothery alloys. We have performed X-ray diffraction study on the Pd-2846%
Mn alloys to furnish precise structure data of the ordered phases and to establish their relation in the phase diagram. Discussion is given on the stability of ordered structures by calculating total energies using density functional method.
2. Experimental Procedures
A series of alloys with the compositions of Pd-28.1, 30.8, 33.0, 34.5, 36.0, 37.5, 45.8% Mn were prepared using the arc-melting technique in a high-purity alumina crucible. The samples were cut in the form of a plate 12 mm in diameter from the original ingots. After polished, all the samples were capsulated in an evacuated silica tube, annealed at 1273 K for two days and quenched into iced water. The composition of the samples was determined by an electron probe micro-analyser at the Chemical Analysis Center, University of Tsukuba. Data were taken from ten different spots of the sample and the average value was adopted as the alloy composition.
The samples were powdered by filing and heated again in evacuated silica tubes. Further heat treatments were done to attain ordered states in the high temperature region at 1073 K for 5 days for Pd-30.8 and 33.0% Mn and at 1273 K for 3 days for Pd-28.1, 36.0, 37.5, and 45.8% Mn, followed by quenching into iced water. To attain ordered states at lower temperatures, annealing was made at 673 K for 3 months for Pd-33.0% Mn, at 923 K for 3 weeks for Pd-30.8 and 34.5% Mn and at 773 K for 3 weeks for Pd-28.1, 36.0, 37.5, and 45.8% Mn, followed by slow cooling to room temperature.
X-ray diffraction measurements were performed at room temperature employing a two-circle diffractometer (PANalytical PW 3050 X’Pert Pro) installed at a line focus X-ray generator. A reflection-free Si plate was used as a sample stage. CuKa radiation obtained by reflection from a singly bent HOPG crystal was used. Diffraction pattern was recorded using a solid state detector (PANalytical X’Celerator) with a scan speed of 0.5 deg. (in2)/min. up to 150 degrees. Repeated collection of the diffraction data was *Corresponding author, E-mail: [email protected]
made after repacking powdered samples until the effect of preferred orientation of grains became minimum. Rietveld refinement was done for the intensity profile in the whole2
range using the program RIETAN written by Izumi and Ikeda.7)
3. Results and Analysis
3.1 Structure of the alloys at high temperatures
X-ray powder diffraction patterns of Pd-28.1 and 30.8% Mn alloys, both of which annealed at 1273 K and quenched, show that the structures are fcc, in agreement with the earlier phase assignment.8)Diffraction patterns of Pd-36.0, 37.5 and
45.8% Mn alloys annealed at 1273 K are those expected from the L10-type structure (or tetragonally distorted B2-type structure), also in agreement with the earlier phase assign-ment.8)Diffraction pattern taken for the alloy of 30.8% Mn annealed at 923 K shows a two-phase mixture of fcc and L10, while the pattern of the 33.0% Mn alloy shows the existence of only the L10-type structure. Since the ideal composition for this structure is Pd:Mn¼50 : 50, the excess Pd atoms in the 33.0% Mn alloy must occupy the sites of Mn atoms. Smaller deviation from unity in the c/a axial ratio compared with the axial ratio of the alloys richer in Mn supports this.
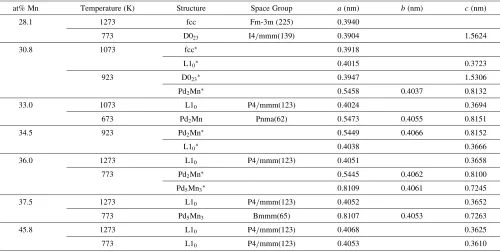
Lattice parameter data of the alloys investigated in the present study are listed in Table 1.
3.2 Structure of Pd3Mn
Figure 1 shows a diffraction pattern of Pd-28.1% Mn alloy annealed at 773 K. Refined lattice parameters show that the M value characterizing the long period is 2.0 in spite of a small deviation in composition from the ideal Pd3Mn. This supports the fixed M value as revealed by Sato and Toth.2)
Sato and Toth2)and Miidaet al.6)reported that the D023 -type phase exists stably on an increase in the Mn content
and changes continuously into the L10-type phase. However, X-ray diffraction pattern obtained in the present study has shown that there is a distinction between the D023-type and L10-type structures in the intensities of superlattice reflections. The D023-type phase exists in a limited range around the composition 25% Mn.
3.3 Structure of Pd2Mn
X-ray diffraction pattern of Pd-33.0% Mn alloy, which was annealed at 673 K for 3 months, is shown in Fig. 2. Number of diffraction peaks has increased, indicating that the lattice symmetry is lower. Attempts were made to index sharp diffraction peaks assuming an orthorhombic lattice and good agreement was obtained with the lattice parameters a¼
0:5473nm, b¼0:4055nm, and c¼0:8151nm. They are in the following relation with the fundamental fcc lattice; a¼pffiffiffi2a0, b¼a0, and c¼ ð3=
ffiffiffi
2
p
[image:2.595.48.548.84.336.2]Þa0, a0 being the lattice
Table 1 Lattice parameters of the alloys investigated in the present study.
at% Mn Temperature (K) Structure Space Group a(nm) b(nm) c(nm)
28.1 1273 fcc Fm-3m (225) 0.3940
773 D023 I4/mmm(139) 0.3904 1.5624
30.8 1073 fcc 0.3918
L10 0.4015 0.3723
923 D023 0.3947 1.5306
Pd2Mn 0.5458 0.4037 0.8132
33.0 1073 L10 P4/mmm(123) 0.4024 0.3694
673 Pd2Mn Pnma(62) 0.5473 0.4055 0.8151
34.5 923 Pd2Mn 0.5449 0.4066 0.8152
L10 0.4038 0.3666
36.0 1273 L10 P4/mmm(123) 0.4051 0.3658
773 Pd2Mn 0.5445 0.4062 0.8100
Pd5Mn3 0.8109 0.4061 0.7245
37.5 1273 L10 P4/mmm(123) 0.4052 0.3652
773 Pd5Mn3 Bmmm(65) 0.8107 0.4053 0.7263
45.8 1273 L10 P4/mmm(123) 0.4068 0.3625
773 L10 P4/mmm(123) 0.4053 0.3610
two-phase mixture.
20000
15000
10000
5000
0
Intensity (arb
. units)
140 120 100 80 60 40 20
2θ(degree)
D023
Fig. 1 X-ray diffraction pattern of Pd0:719Mn0:281alloy annealed at 773 K.
[image:2.595.312.543.370.524.2]parameter of the fundamental lattice. Eight Pd and four Mn atoms are contained in the unit cell. Systemic extinction is observed such that0klreflections withkþl odd are absent andhk0reflections withhodd are absent. This uniquely leads to the space group Pnma, in accord with the assignment by Ka´da´ret al.3)
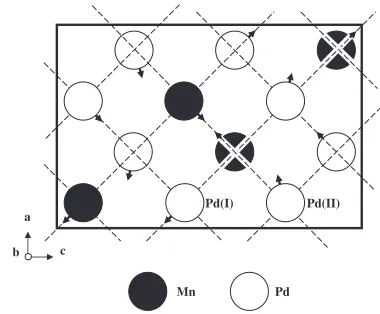
Rietveld refinement was done for the intensity profile in the 2 range between 10 and 150 degrees. The results are shown at the bottom in Fig. 2. Refined atomic parameters along with thermal parameters are listed in Table 2. The reliability factorRis 3.37% and the goodness-of-fit indicator S is 1.55. The atomic arrangements of Pd2Mn thus deter-mined are shown projected onto the (010) plane in Fig. 3. The atoms are located at slightly shifted positions from those of the fundamental lattice, the magnitudes of the shifts beingx¼0:0066nm andz¼0:0079nm for Pd(I) atom,
x¼0:0202nm and z¼0:0033nm for Pd(II) atom and
x¼0:0175nm and z¼0:0092nm for Mn atom. The arrows attached to the atoms show the direction of the shifts. An appreciable change has appeared in the directions and magnitudes of the atomic shifts from those obtained by Ka´da´r et al.3)
The shifts result in an appreciable contraction of the interatomic distances, particularly those between Mn atoms. It would be 0.2798 nm in unshifted structure and has become 0.2554 nm as a result of the shifts. However, if a rigid sphere model is adopted with the radius of Mn atom of 0.126 nm,9)
the distance of contact between Mn atoms will be 0.252 nm, approximately the same as that observed. The distance 0.2711 nm between the larger Pd atoms is not much different from the twice of the atomic radius of Pd, 0.138 nm.
3.4 Structure of Pd5Mn3
X-ray diffraction pattern of Pd-37.5% Mn alloy, which
was annealed at 773 K for 3 weeks, is shown in Fig. 4. Sharp peaks can be indexed in terms of the orthorhombic lattice with the lattice parameters of a¼0:8107nm, b¼
0:4053nm, and c¼0:7263nm. They are in rough accord with those reported by Ka´da´r and Kre´n5)for Pd
5Mn3. The relation between the lattice parameters of Pd5Mn3and those of the fundamental fcc lattice isa¼2a0,b¼a0andc2a0. Ten Pd and six Mn atoms are contained in the unit cell. Systematic extinction of the reflections has led to the B-centered space group Bmmm.
Rietveld refinement was made using observed intensity profile. The results are shown at the bottom in Fig. 4. R is 3.21% and S is 1.60. Refined atomic parameters along with thermal parameters are listed in Table 3. The atomic arrangements of Pd5Mn3are shown projected onto the (010) plane in Fig. 5. According to Ka´da´r and Kre´n,5)introduction
of atomic shifts and partial mixing of Pd and Mn atoms is necessary to get agreement with their observed intensities, but the results of the present structure analysis show that there is no need to introduce mixed occupation of atoms and, furthermore, the shifts of atoms are very small.
3.5 Reconstruction of the phase diagram
Taking all the experimental results in the present study into account, partial phase diagram has been reconstructed, as Pd2Mn
20000
15000
10000
5000
0
Intensity (arb
. units)
140 120 100 80 60 40 20
2θ(degree)
Fig. 2 X-ray diffraction pattern of Pd0:67Mn0:33alloy annealed at 673 K.
[image:3.595.328.518.71.228.2]Results of Rietveld refinement are shown below the intensity profile.
Table 2 Refined atomic parameters of Pd2Mn (space group Pnma).
Atom Site x Y Z B (nm2)
Mn 4c 0.093 1/4 0.072 0.002038
Pd(I) 4c 0.113 1/4 0.407 0.002312
Pd(II) 4c 0.162 1/4 0.746 0.002117
c a
b
Mn
Pd(I) Pd(II)
Pd
Fig. 3 Structure of Pd2Mn determined in the present study. Arrows
attached to the atoms represent the direction of the shifts.
Pd5Mn3 25000
20000
15000
10000
5000
0
Intensity (arb
. units)
140 120 100 80 60 40 20
2θ(degree)
Fig. 4 X-ray diffraction pattern of Pd0:625Mn0:375alloy annealed at 773 K.
[image:3.595.54.286.71.225.2] [image:3.595.311.542.279.432.2] [image:3.595.47.291.292.350.2]shown in Fig. 6. General form of the diagram is similar to that proposed by Miidaet al.,6)but revision has been made in
the range of the D023 phase and the mutual relation among the phases Pd2Mn, Pd5Mn3and L10phase.
4. Discussion
4.1 On the ordered structure of Pd2Mn and Pd5Mn3
A number of ordered structures are known to form in metallic alloys. The most frequently observed in fcc alloys is of the L12-type and its representative is Cu3Au. The
same structure is found in noble metal-based alloys and in transition metal-based alloys. Another common ordered structure in fcc alloys is of the L10-type, the representative being CuAu I. These structures have atomic arrangements with as much unlike nearest neighbors as possible and are favorable in view of the nearest-neighbor pairwise interaction energy. The ordered structures forming in the present Pd-Mn alloys show in general the same tendency; D023-type structure, which is based on the L12-type one, around the composition of Pd-25% Mn and the L10-type structure in the composition range from Pd-33% Mn to 50% Mn. However, the structures Pd2Mn and Pd5Mn3 forming are of the less-common type in fcc alloys. Stability of these structures can not be accounted for in the framework of the nearest-neighbor interaction model.
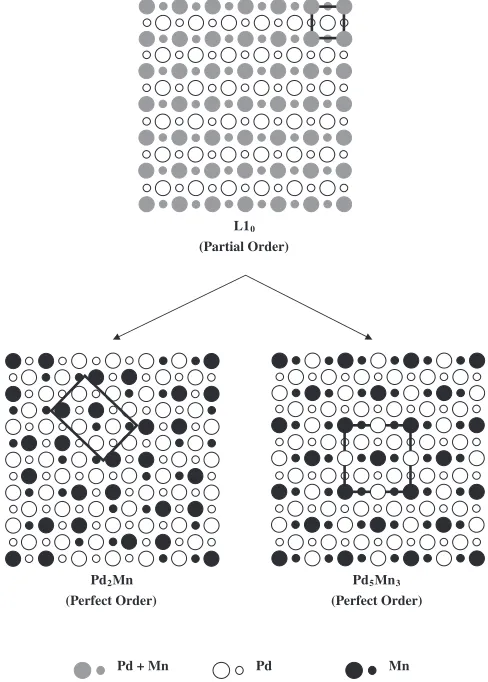
[image:4.595.304.548.74.415.2]Let us consider the mechanism of formation of the structures Pd2Mn and Pd5Mn3. As seen in the phase diagram in Fig. 6, they form on lowering temperature from the L10 -type phase, which contains excess Pd atoms with alternate (001) layers consisting of pure Pd and mixed Mn-Pd planes. The L10-type structure at the compositions of Pd-33.3% Mn and Pd-37.5% Mn can be regarded as partly ordered structure. Figure 7 depicts schematically the atomic arrange-ments of the structure projected onto the (100) plane along with those of Pd2Mn and Pd5Mn3. The sites with mixed occupation are shown by gray circles. It can be seen that the
Table 3 Refined atomic parameters of Pd5Mn3(space group Bmmm).
Atom Site x Y Z B (nm2)
Mn(I) 2a 0 0 0 0.002030
Mn(II) 4h 0.264 1/2 0 0.002041
Pd(I) 2b 1/2 0 0 0.002398
Pd(II) 4e 1/4 0 1/4 0.002444
Pd(III) 4j 0 1/2 0.234 0.002511
a c
b
Mn Pd
Fig. 5 Structure of Pd5Mn3. The shifts of atoms are very small, and are not
shown in this figure.
24 600 700 800 900 1000 1100 1200 1300
fcc
L1
0
Pd
5
Mn
3
Pd
2
Mn
D0
23
T
emperature,
T
/K
Composition, c/ at % Mn
48 46 44 42 40 38 36 34 32 30 28 26
Fig. 6 Revised partial phase diagram on the Pd-rich side of Pd-Mn alloy system. The mark x represents the temperature where the X-ray diffraction pattern was collected.
L10
(Partial Order)
Pd2Mn
(Perfect Order)
Pd5Mn3
(Perfect Order)
Pd + Mn Pd Mn
Fig. 7 Partially ordered L10-type structure (above), the Pd2Mn structure
(below left) and the Pd5Mn3 structure (below right) projected onto the
[image:4.595.45.280.79.386.2] [image:4.595.62.276.433.594.2]transition from the L10-type phase into Pd2Mn or Pd5Mn3 involves a redistribution of Pd and Mn atoms so that every sites are occupied exclusively either by Pd or Mn atom. This transition is a kind of two-step ordering with changing the crystal symmetry. Similar transitions have been reported, for example, in Fe-Al10) and Pt-Mn11)alloy systems, in which, however, the crystal symmetry does not change.
4.2 Stability of the ordered structures
In recent years, there is a remarkable progress in the method of calculating electronic structure of metallic alloys. Hirschl, Hafner and Jeanvoine didab initiodensity functional calculations for Pd-V alloys.12)They could explain stability
of the ordered structures of Pd3V (D0a-type), Pd2V (MoPt2 -type) and PdV3 (A15-type).
We apply the similar method of calculation to the ordered structures forming in the present Pd-Mn alloys by using
the CASTEP13) program. CASTEP solves the Kohn-Sham
equations of local density functional (LDF) theory using a total energy plane-wave pseudopotential method. It replaces core electrons with effective potentials acting only on the valence electrons in the system. Numbers of valence electrons assigned are 10 for Pd and 7 for Mn here. The exchange and correlation effects are included in the local density approximations (LDA) and the spin effects are not considered. The ultrasoft pseudopotentials and an energy cut-off of 330 eV are used in calculations. A smearing width of 0.05 eV is used in density of states (DOS).
Band structure and DOS have been calculated for Pd3Mn, Pd2Mn, Pd5Mn3 and PdMn. For Pd3Mn, calculation was made not only for the observed D023-type structure but also for the competing ordered structures D022-type and L12-type. For Pd2Mn and Pd5Mn3, calculation was made with the shifts of atoms and without them. For PdMn, calculation was made for the L10-type structure and the B2-type structure. Calculation was also made for Pd and Mn metals.
Figure 8 shows the calculated DOS curves for Pd2Mn with the shifts of atoms (a) and without them (b). The DOS curve is similar to each other, and the Fermi level is almost same. However, there is a significant difference that the Mn 3d band width in (a) is a little larger than in (b). It means larger Mn-Mn interactions due to the shifts of Mn atoms towards each other. As Mn 3d band is partially filled with valence electrons, it crosses the Fermi level with the part above the Fermi level empty. Hence, the larger band width makes the centre of gravity of the Mn 3d DOS (dot line in (a) and (b)) move lower, results in lower energy.
Formation energy is defined as the difference between the total energy of the structure and the composition-weighted mean of the total energies of constituent Pd and Mn metals. Figure 9 shows the formation energy of the ordered struc-tures forming in the Pd-Mn alloy system. Solid lines indicate
Density of States, d/eV-1
(a)
Energy
, E/eV
Density of States, d/eV-1
(b)
3d
Mn
Energy
, E/eV
Fig. 8 The calculated DOS curves for Pd2Mn with the shifts of atoms (a) and without them (b). Dot line shows the centre of gravity of the
Mn 3d DOS.
0 -0.4 -0.3 -0.2 -0.1 0.0 0.1
Mn B2
Pd
L12
Pd5Mn3 (U, S)
Pd2Mn (U)
Pd2Mn (S) D023
D022
∆
E, E/eV
Composition, c/ at % Mn L10
100 80
60 40
20
Fig. 9 Formation energy of the ordered structures forming in riched Pd-Mn alloys. In the figure, Pd2Mn(S) and Pd2Mn(U) represent the Pd2Mn
[image:5.595.110.492.70.300.2] [image:5.595.321.533.358.519.2]the stable structures at low temperature. There is little difference on formation energy of Pd5Mn3between with and without atomic shifts, because atomic shifts are very small. The fact that the B2 structure is energetically unfavorable suggests that hetero coordination is no longer a dominant factor in the chemical bonding,12)which is also found in Pd-V
alloy system. The nearest Mn-Mn bonds (in L10) afford a lower total energy than Pd-Mn bonds, since Mn 3d band crosses the Fermi level. On the other hand, it is generally accepted that bcc or bcc-based structures allow larger scale of thermal vibration with a decrease in free energy. They are found at high temperatures in many alloy systems, and the same is true for the present Pd-Mn system. Repulsive energy between ion cores has not been included in the above calculation, but it can be concluded that main origin of the stability of the ordered structures comes from the electronic energy.
5. Summary
We have performed X-ray powder diffraction experiments on Pd-rich Pd-Mn alloys within the composition range of Pd-2846% Mn. The existence of the D023-type ordered structure at the composition near Pd-25% Mn, the Pd2Mn structure near Pd-33% Mn, the Pd5Mn3 structure near Pd-37% Mn, and the L10-type structure from Pd-3346% Mn in the temperature region between 1000 K and 1273 K, has been confirmed. The precise determination of atomic parameters has been made for these structures, and the detailed phase relation in the Pd-rich region has been constructed. We have also noticed the remarkable atomic shifts between Mn-Mn pairs in Pd2Mn structure, in which the movements towards each other in Mn atoms pair are firstly explained by atoms’ hard sphere model pictorially.
The two-step ordering transitions are found in Pd2Mn and Pd5Mn3 compositions. The atomic arrangements in Pd2Mn structure are complicated compared with other fcc-based structures. The origin of phase transition from L10-type structure to the Pd2Mn structure is not yet fully understood, and remains as a future task.
The phase stabilities of the ordered structures have been discussed from the electronic structures based on density functional method. Formation energies are calculated for all observed structures, and also for some possible structures which are not observed. The tendency of more and shorter Mn-Mn bonds was found and explained by the reduction of total energy, resulting from the interactions of about half-filled Mn 3d electrons.
More accurate electronic structural studies using an all-electron method with spin effects and more complicated approximations, e.g., the generalized gradient approximation (GGA), are necessary to obtain complete structural charac-teristics on phase change.
Acknowledgments
We gratefully acknowledge Prof. Nobuhiko Kobayashi of University of Tsukuba for his computer and software supports in an electronic structure calculation.
REFERENCES
1) D. Watanabe: Trans. JIM3(1962) 234–236.
2) H. Sato and R. S. Toth: Phys. Rev.139A(1965) 1581–1593. 3) G. Ka´da´r, E. Kre´n and M. Marton: J. Phys. Chem. Solids33(1972)
212–215.
4) E. Raub and W. Mahler: Z. Metallkde.45(1954) 430–436. 5) G. Ka´da´r and E. Kre´n: Solid State Commun.11(1972) 933–936. 6) R. Miida, T. Tajima, D. K. Saha, M. Y. Wey, D. Watanabe and K.
Ohshima: Mater. Trans.45(2004) 2822–2825.
7) F. Izumi and T. Ikeda: Mater. Sci. Forum321–324(2000) 198. 8) M. Hansen and K. Anderko:Constitution of Binary Alloys, 2nd ed.
(McGraw-Hill, New York, 1958) p. 944.
9) C. Kittel:Introduction to Solid Sate Physics, 6th ed., (John Wiley & Sons, New York, 1986) p. 76.
10) A. Taylor and R. M. Jones: J. Phys. Chem. Solids6(1958) 16–37. 11) M. Takahashi, A. K. Das, R. Nakamura, H. Iwasaki, T. Shishido and
K. Ohshima: J. Phys. Soc. Jpn.75(2006) 013601-1–4.
12) R. Hirschl, J. Hafner and Y. Jeanvoine: J. Phys. Condensed Matter13
(2001) 3545–3572.