Effects of Electron Beam Irradiation on Charpy Impact Value
of Short Glass Fiber (GFRP) Samples with Random Distribution
of Solidi
fi
cation Texture Angles from Zero to 90 Degrees
Michael C. Faudree
1, Yoshitake Nishi
2and Michael Gruskiewicz
31Center of Foreign Language, Tokai University, Hiratsuka 259-1292, Japan
2Doctoral Graduate School of Science and Technology, Tokai University, Hiratsuka 259-1292, Japan
3Premix, Inc., North Kingsville, Ohio, 44068 USA
Compression-molded short-fiber GFRP-BMC panels have random distribution of solidification texture angles from zero to 90 degrees in the center of the mother panels. Hence, there is significantly lower impact strength in the panel center than in the outside. However, experimental results showed homogeneous low voltage electron beam irradiation (HLEBI) applied to the center region apparently enhances the Charpy impact values (auc) 5 to 25%. Fracture mechanism was observed to convert atauc>³5.46.7 kJ·m¹2from clean to secondary microcrack proliferation and/or bends near the main crack, with increasing fracture surface area asaucincreased. SEM observation revealed 0.86 MGy HLEBI treated GFRP had much more polymer adhering tofibers than the untreated. This increased matrix adhesion can be explained by electron spin resonance (ESR) peaks indicating dangling bonds are generated creating repulsive forces between outer shell electrons in the polymer matrix, apparently exhibiting increased compressive stress on thefibers increasing adhesion force. Moreover, the lone pair electrons generated in the matrix may have bonded with thefibers more efficiently. For these reasons, increasedfiber-matrix adhesion seen in the 0.86 MGy samples appears to assist for more internal cracking, increasing resilience to impact of the GFRP-BMC, raising theauc. [doi:10.2320/matertrans.M2012145] (Received April 16, 2012; Accepted May 28, 2012; Published July 25, 2012)
Keywords: glassfiber reinforced polymer (GFRP), bulk molded compound (BMC), impact, texture, electron beam irradiation, electron spin resonance
1. Introduction
Glass fiber reinforced polymer (GFRP) bulk molded
compounds (BMCs) are used for aerospace, automotive parts, housing for electrical wiring, and corrosion-resistant needs, hence mechanical property improvement is essential for durability and use life. BMC is composed of a thermoset
plastic resin with various inert fillers, fiber reinforcement,
catalysts, stabilizers, and pigments that form a viscous paste
for molding.1)Glassfiber reinforcement usually ranges from
5 to 30 mass%while glassfiber length ranges from about 3.2
to 12.7 mm (1/8 to 1/2 in). Fillers such as CaCO3can range
from³35 to over 50 mass%.
Formulations are optimized for precise dimensional
con-trol, flame resistance, high dielectric strength, corrosion and
stain resistance, and color stability. BMCs have excellentflow
characteristics that make them well suited for parts requiring precise dimensions and detail. Compression molding is com-monly used for BMC as it can be easily produced with high productivity for mass production with a smooth and attractive
surface finish. Large presses can accommodate large platen
sizes making it ideal for large components. Further strength-ening has always been expected to develop these lighter
materials for higher durability and more efficient transports
with small energy consumption for the environment. Homogeneous low voltage electron beam irradiation
(HLEBI) has been found to enhance long-fiber GFRPs,
glasses such as silica glass, glassfibers, and a wide range of
polymers.17) For GFRP with long fibers used for
next-generation aircraft, HLEBI has been used to improve Charpy
impact value at all fracture probabilities.3) HLEBI often
enhances the deformation resistivity (elasticity) of polymer.2)
Moreover, HLEBI often induces not only hardening, high wear resistance and sterilization for practical use of polymer,
but also mist resistance of transparent ceramics.810)
Fur-thermore, it is also possible to enhance the interfacial strength induced by surface activation, which is generated by charging and dangling bond formation.
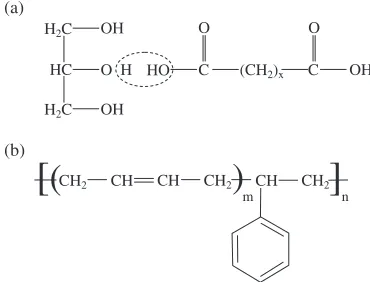
Figure 1 shows the rational formulae of thermoset polyester (a) and styrene-butadiene co-polymer (b). HLEBI generally cuts the atomic bonding at weak chemical bonding sites as shown in Fig. 2 and dangling bonds are formed
at the terminated atoms with low dissociation energy:46)
at methylene groups (CH2CH2: 369 kJ·mol¹1), hydroxyl
groups (CH3OH: 377 kJ·mol¹1), phenyl groups (C6H5R:
<377389 kJ·mol¹1 where R is CH3 or C2H5), and
free-radical hydrogens (HCH: 427 kJ·mol¹1, HOC2H5:
435 kJ·mol¹1, and HOOCCH
3: 469 kJ·mol¹1), and alkene
groups H2C=CH2 with the higher dissociation energy at
720 kJ·mol¹1.11,12)
Based on the radial distribution function (RDF) of silica glass, it has been found HLEBI reduces the normalized
(a)
(b) HC H2C
H2C
O (CH2)x C
O
[
(
CH2 CH)
mCH]
C OH
HO H
OH
O
OH
CH CH2
n
CH2
Fig. 1 Rational formulae of thermoset polyester (a) and styrene-butadiene co-polymer (b).
[image:1.595.333.518.385.526.2]coordination numberND/NO, and raises the normalized mean
atomic distance rD/rO resulting in volume expansion.7)
Therefore, compressive stress has been confirmed in the
silica glass. Repulsive force occurs between the outer shell electrons, probably inducing compressive stress and stress relaxation similar to the role of a cushion. Therefore the effects of HLEBI on hardening, elasticity, ductility enhance-ments, and strengthening of ceramics, polymers and their composites can be expected.
The previous research on HLEBI has been conducted on relatively ordered one- or two-phase systems of polymers,
fibers, and long-fiber reinforced polymer GFRPs and
CFRPs.27) This research investigates Charpy impact of
a three-phase system of compression-molded short-fiber
GFRP-BMC panels containing a high percentage (55 mass%)
of CaCO3 filler that undergoes complex flow patterns. As
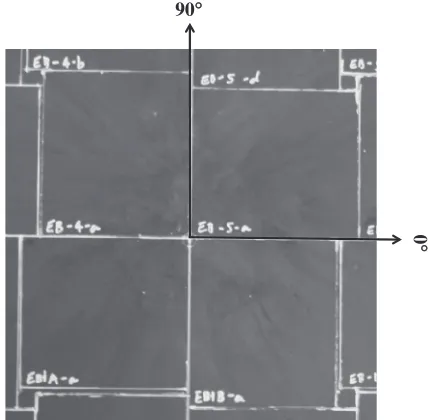
shown in Fig. 3, the texture angles, ªt (degrees) between
mold flow and longitudinal direction of testing sample are
45«45° (0 to 90°) for section-a, 68«7° for section-b,
45«10° for section-c and 17.5«17.5° for section-d,
respectively. In the a-sections, the impact values are much
lower (10 to 70%) than the outer sections b, c, d due to
highly turbulentflow and a slower onset of cure where chains
probably have a harder time moving to different confi
g-urations. Hence, the effects of EB were investigated for samples of section-a (Fig. 3 thick lines). Investigating outer
sections‘b’,‘c’and‘d’was beyond the scope of this study.
Figure 4 shows the center section-a where the charge of
paste isfirst compressed characterized by rough texture with
weak resin-rich areas, anisotropy of fiber and filler density
gradients that exhibit high flaw sensitivity. This anisotropy
can result in higher variance in impact values of section-a from panel-to-panel and at different areas within each panel. Given these conditions, it is important to strengthen parts such as electrical housing that can be exposed to outside environments to withstand possible impacts and maintain long use life.
Up to now, there has been no or little research on
improving mechanical properties by HLEBI of short-fiber
GFRP. However, since HLEBI has been found to enhance the
long-fiber GFRPs, glasses such as silica glass, glass fibers,
and a wide range of polymers,27)it is predicted that HLEBI
can enhance the Charpy impact strength 5 to 25% in the
center region of the compression-molded BMC GFRP mother
panels constructed with short glass fibers, CaCO3 filler and
unsaturated polyester/styrene-butadiene block copolymer.
2. Experimental
2.1 Preparation of GFRP
GFRP panels 304.8©304.8 mm (12©12 in) and 2 mm
thick illustrated in Fig. 3 were provided by Premix, Inc., HC
H2C
H2C
O C
O H O
H 377 kJ mol-1
(CH3-OH)
427 mol-1 (H-CH)
469 kJ mol-1 (H-OOCCH3)
369 kJ mol-1 (CH2-CH2)
435 kJ mol-1 (H-OC2H5)
(a)
O H
OH
O H
C (C)x
HO H
[(
CH2 CH)
mCH]
<377~389 kJ mol-1 (C6H5-R)
720 kJ mol-1 (H2C
(b)
369 kJ mol-1 (CH2-CH2)
CH2)
CH CH2 CH2
n
Fig. 2 Schematic illustration of thermoset polyester (a) and styrene-butadiene co-polymer (b), respectively, after electron beam irradiation showing approximate bond dissociation energies and dangling bonds.11,12)
90°
0
°
45 ° Textur
e Angle,
θ
t
Fig. 3 Schematic of Charpy impact sample cutting from the GFRP panel. Moldflow is raidially outward from center. Samples in“a sections”in center were tested that have random distribution of solidification texture angles (from longitudinal direction of a-samples) from 0 to 90°.
0
°°
90° °
[image:2.595.308.538.74.292.2] [image:2.595.61.280.78.292.2] [image:2.595.318.533.357.567.2]North Kingsville, Ohio with components: 13.75 mass%
propylene glycol maleate polyester resin (33 mass% styrene
solution), 12.75 mass% styrene butadiene copolymer (70
mass% solution in vinyl toluene), 11 mass% commercial
E-glass fibers, 55 mass% calcium carbonate filler (CaCO3),
3 mass% aluminum silicate filler (AlO)2SiO3, 0.5 mass%
magnesium hydroxide Mg(OH)2and the balance proprietary.
The components were mixed in a double-arm sigma blade mixer for 20 min at room temperature prior to molding at
5.56.9 MPa (8001000 psi) in a matched metal die
com-pression mold at 422°K (149°C). A single charge mass of paste was placed in the center of the mold, compressed and
cure time was 2 min. Volume fractions, Vf of glass fiber,
CaCO3filler and remaining polymer mixture were calculated
to be 0.080, 0.377 and 0.543, respectively.
Panel mold flow direction was outward from center. The
material is orthotropic, where material properties in three perpendicular axes: axial, circumferential and radial are different, similar to wood. For simplicity, isotropy was assumed across the axial 2 mm thickness. The panel was sectioned into 4 quadrants which were further sectioned into
4 quadrants cut in spiral configuration into ‘section-a’,
‘section-b’, ‘section-c’ and ‘section-d’, respectively since
flow is approximately radially outward during the
com-pression molding process. This is in accordance with ASTM D 6110-02 (2002) which calls for specimens to be cut in both lengthwise and crosswise directions from
anisotropic panels.13)
2.2 Charpy impact tests
Charpy impact test utilizes a drop-weight pendulum and evaluates the impact absorption characteristics and relative impact toughness of materials often used in quality control applications employed as an inexpensive and fast way to estimate reaction to impact.
To evaluate dynamic fracture toughness, Charpy impact values for GFRP samples from the center a-sections (Fig. 3) with and without HLEBI were measured. Unnotched Charpy impact samples were cut with a diamond cutter (MC-201,
MARUTO) to dimensions 80©10©2 mm conforming to
JIS K 7077-1991 testing standard.14,15)Concerning
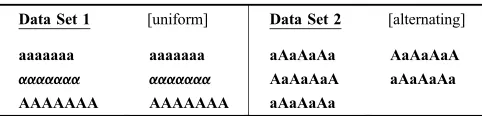
variabil-ity in the a-sections, Charpy impact tests were conducted according to two data sets as shown in Table 1, where each
7-letter group represents specimens 17 in Fig. 3 and symbols
‘A’, ‘¡’ and ‘a’ are 0.86, 0.30 EB irradiated and untreated
samples, respectively. In Data Set 1 (uniform) all specimens
17 are given the same treatment. In Data Set 2 (alternating)
specimens are given alternating treatments, for example in
the first line 1, 3, 5, 7 are untreated and 2, 4, 6 are EB
irradiated.
A standard impact fracture energy measurement system (Shimadzu Corp. No. 51735) was employed according to
JIS K 7077-199114,15) to obtain impact fracture energy,
E(kJ) calculated in eq. (1)
E¼WR½ðcos¢cos¡Þ
ðcos¡0cos¡Þð¡þ¢Þ=ð¡¡0Þ ð1Þ
where, W,R, ¢,¡ and ¡A are: hammer mass (W=0.86 kg),
length of hammer weight point from pivot center (R=
0.21 m), maximum angle after impact (Radians), start angle
before impact (¡=2.3 Radians) or 132°, and maximum
angle of a blank test, respectively. The hammer impacts the sample across its entire width with a hemispherical tip approximately 1.5 mm in diameter. When the Charpy impact
test impact velocity,vhitting the sample is calculated as:16)
v¼ ½2gRð1cos¡Þ0:5 ð2Þ
where g is gravitational constant (9.8 m·s¹2), then v of the
hammer hitting the specimen is ³1.74 m·s¹1. The surface
area, Aof the impactor hitting the sample is small soKE/A
is large.
Charpy impact value, auc, (kJ/m2) was calculated by the
following equation:14,15)
auc¼E=ðbtÞ ð3Þ
where b and t were sample width and thickness (mm),
respectively. The distance between supporting points was
40 mm. Evaluating the probability of fracture (Pf) has been a
convenient method of quantitatively analyzing experimental values relating to fracture, often used in industry to determine
manufacturing reliability in quality control.Pfis expressed by
the following equation which is a generalized form of the
median rank method:17)
Pf ¼ ðI0:3Þ=ðNsþ0:4Þ ð4Þ
whereNsandIare total number of samples and the ascending
strength order of each sample, respectively. Impact tests were
carried out 30«0.5 h after EB irradiations.
2.3 Homogeneous low voltage electron beam irradiation (HLEBI)
Samples were homogeneously irradiated using an
electron-curtain processor (Type LB250/15/180L), Energy Science,
Inc., Woburn, MA, Iwasaki Electric Group, Ltd.,
Tokyo)46,1820) with the electron beam through a titanium
thin film window attached to a vacuum chamber, ³240 mm
in diameter. A tungstenfilament in the vacuum was used to
generate the electron beam at an acceleration potential of 170 kV and irradiating current of 2.68 mA. To prevent
oxidation, the samples were kept in a 1 atm N2 atmosphere
with a residual O2concentration below 300 ppm. The N2gas
molarflow rate was 89 N/min. The distance between sample
and Ti window was 30 mm. Samples were transported in a
200©150 mm aluminum plate holder on a conveyor at
a speed of 10 m/min. One sweep going one way was
0.0423 MGy for the short time of 0.20 s to avoid excess heating of the sample. Repetitive applications to both side surfaces were applied to achieve the desired dose of HLEBI, with a gap interval of 20 s between each sweep. The resulting EB dosage was proportional to the yield value determined
from the irradiation current, I (mA) conveyor speed, S
[image:3.595.306.547.83.141.2](m·min¹1), and number of irradiations,N:21)
Table 1 Designation of the two data sets.
Data Set 1 [uniform] Data Set 2 [alternating]
aaaaaaa aaaaaaa aAaAaAa AaAaAaA
¡¡¡¡¡¡¡ ¡¡¡¡¡¡¡ AaAaAaA aAaAaAa
D¼0:216ðI=SÞN ð5Þ
The yield value was calibrated by FWT nylon dosimeters (Far West Technology, Inc. 330-D South Goleta, CA 93117).
2.4 Electron spin resonance (ESR) measurement
To obtain more precise information on atomic-scale structural changes in the BMC-GFRP, the dangling bond density was obtained using an electron spin resonance spectrometer (ESR, JES-FA2000, Nippon Denshi, Ltd.,
Tokyo).2,6) ESR is utilized to detect unpaired electrons by
their spins (ms=«1/2) since electrons have a magnetic
moment and spin quantum number. The unpaired electrons’
magnetic moments either align themselves parallel or
anti-parallel to an induced magnetic field producing a peak at a
particular magnetic field, B. ESR analysis of polymers
demonstrated spectra are affected by coexistence of several kinds of radicals, effect of state of aggregation of polymer,
and effect of irradiation dose and dose rate.22)The microwave
frequency range used in the ESR analysis was the X-band at
9.0374«0.0005 GHz with a field modulation of 100 kHz.
The microwave power was 1 mW. The magnetic field was
varied from 297.000 to 347.000 mT. The electron spin
density was calculated using a Mn2+standard sample. Only
ESR spectra, instead of spin densities, were given.
3. Results
3.1 Effect of HLEBI on impact values: Data Set 1
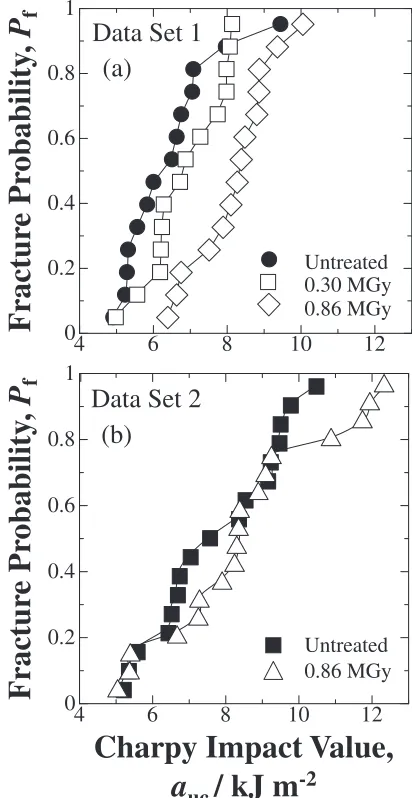
Experimental results from Data Set 1 in Fig. 5(a), show applying 0.86 and 0.30 MGy HLEBI homogeneously
appar-ently enhances the Charpy impact values (auc) of the GFRP
near the center of the mother panel (a-sections) at all fracture
probabilities (Pf) except in one sample where the high Pf
of 0.94 (9.45 kJ·m¹2) was higher than that of the 0.30 MGy.
Moreover, HLEBI apparently enhanced auc33 and 8.7% at
mid-fracture probability (Pf=0.50) at 0.86 (8.33 kJ·m¹2) and
0.30 (6.81 kJ·m¹2) MGy over the untreated (6.26 kJ·m¹2).
Moreover, in Data Set 1 HLEBI of both 0.86 and
0.30 MGy doses apparently raises the averageauc(8.17 and
6.88 kJ·m¹2, respectively) of the GFRP 27.5 and 7.3%, over
the untreated samples (6.41 kJ·m¹2). Standard deviations are
1.06 (13%), 1.02 (14.8%) and 1.24 (19.3%) kJ·m¹2, for the
0.86, 0.30 MGy EB and untreated samples, respectively. EB at the stronger dose of 0.86 MGy results in the lowest standard deviation of the Data Set 1.
3.2 Effect of HLEBI on impact values: Data Set 2
Experimental results from Data Set 2 in Fig. 5(b), show
although HLEBI does not readily enhance the auc from
Pf=0 to 0.2 and 0.55 to 0.75, the 0.86 MGy HLEBI
apparently enhances auc remarkably at the high values of
Pf=0.79 from 9.48 to 10.88 kJ·m¹2, toPf=0.96 from 10.49
to 12.33 kJ·m¹2, and slightly at the mid-Pf from 7.58 to
8.33 kJ·m¹2. From the Data Set 2, 0.86 MGy HLEBI
apparently improved auc 9.9% at mid-fracture probability
(Pf=0.50) (8.33 kJ·m¹2) over the untreated (7.58 kJ·m¹2),
although not as high as the Data Set 1 enhancement. For Data Set 2, HLEBI of 0.86 MGy dose apparently raises
the averageauc(8.57 kJ·m¹2) of the GFRP 10.5%, over the
untreated samples (7.75 kJ·m¹2). Although standard
devia-tions are higher for the 0.86 MGy irradiated samples 2.22
(25.9%), than the untreated 1.69 (21.7%) kJ·m¹2, HLEBI
raises the average auc.
3.3 Effect of HLEBI: Data Sets 1 and 2 combined
For both Data Sets 1 and 2 combined averageaucis 8.33
(1.77) and 7.15 (1.63) kJ·m¹2 (standard deviations in
brackets) for the 0.86 MGy EB and untreated samples,
respectively with a 16.7%increase by the HLEBI.
3.4 Effect of solidification texture angles on impact values of untreated samples
Figures 5(a) and 5(b) show the auc of the untreated
samples taken from the center a-sections of the two data sets,
1 and 2. The Data Set 1 had significantly lower averageauc
(6.41 kJ·m¹2) than Data Set 2 (7.75 kJ·m¹2) for untreated
samples. Since there is a highly random distribution of
solidification texture angles from zero to 90 degrees from
panel-to-panel and at different areas within each panel, the
high difference in average auc can be explained. The auc
Charpy Impact Value,
a
uc/ kJ m
-2Fractur
e Pr
obability
,
P
fFractur
e Pr
obability
,
P
fUntreated 0.30 MGy 0.86 MGy
4
6
8
10
12
0
0.2
0.4
0.6
0.8
1
(a)
(b)
4
6
8
10
12
0
0.2
0.4
0.6
0.8
1
Untreated 0.86 MGy
Data Set 1
Data Set 2
[image:4.595.323.529.73.472.2]difference is an affect of the anisotropy, rather than difference between uniform and alternating samples of the two data sets.
3.5 Effect of HLEBI at each fracture probability
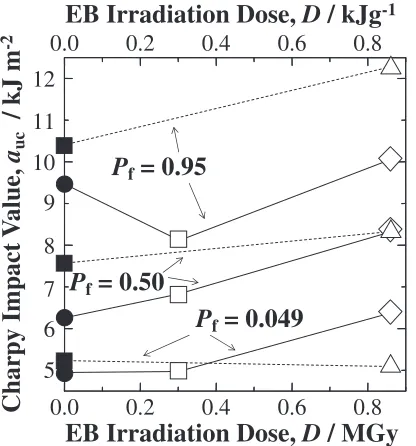
Figure 6 shows effect of EB irradiation dose on
exper-imental impact values (auc) from Fig. 5 at low (Pf=0.049),
mid- (0.50) and high (0.95) fracture probabilities of GFRP-BMC samples from Data Set 1 (solid lines) and 2 (dotted lines). Overall, applying HLEBI at the higher dose of
0.86 MGy increases the auc of the GFRP samples at all
fracture probabilities with the exception of Data Set 2 at
Pf=0.049. Althoughaucat the highest experimental fracture
probability ofPf=0.95 is reduced from 9.45 to 8.14 kJ·m¹2
by the 0.30 MGy EB in Data Set 1, the 0.86 MGy irradiation
increases theaucfrom 9.45 to 10.05 kJ·m¹2in Data Set 1 and
from 10.49 to 12.31 in Data Set 2.
4. Discussion
4.1 Effect of HLEBI on Weibull analysis of impact values
The Weibull coefficient (n) is one of the standard and
traditional factors to compare with many other structural
materials.23) When a
uc and ao are the measured Charpy
impact value and a constant, the fracture probability (Pf) as
a function of risk of rupture (auc/ao) is expressed by the
following equation:24)
Pf ¼1exp½ðauc=aoÞn ð6Þ
wheren is the 2-dimensional Weibull coefficient. The linear
relationship is expressed as the following equation.
lnðlnð1PfÞÞ ¼nlnauclnao ð7Þ
Figure 7 shows the resulting Weibull plots for each EB
irradiation level and untreated for Data Sets 1 and 2. Then
value corresponds to the slopes of the Weibull plot relations.
Figure 8 shows the n obtained for each irradiation dose. In
Data Set 1, the EB irradiations of 0.30 and 0.86 MGy raised
the Weibull coefficient from 5.81 (untreated) to 7.33 and
8.43, respectively. Although, in Data Set 2 the Weibull
coefficient was reduced from 5.01 to 4.24 by the 0.86 MGy
EB, the impact values were increased 9.9%.
The differences innfor Data Sets 1 and 2 are probably due
to rough texture with weak resin-rich areas, and anisotropy
of fiber andfiller density gradients. Thus, the high variance
in impact values of section-a from panel-to-panel and at different areas within each panel can be explained. Over-coming this, the impact values are apparently raised by applying HLEBI of 0.86 MGy.
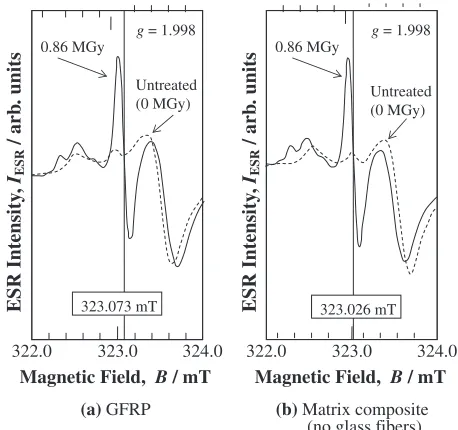
4.2 ESR signals
Figure 9 shows HLEBI produces detectable ESR signals
in the GFRP (a) and matrix composite without fibers (b).
EB Irradiation Dose, D / kJg
Char
py Impact
V
alue,
a
uc/ kJ m
-2
EB Irradiation Dose, D / MGy
0.0
0.2
0.0
0.2
5
7
9
11
6
8
10
12
P
f= 0.95
P
f= 0.50
P
f= 0.049
0.8
0.4
0.6
0.4
0.6
0.8
-1
Fig. 6 Effect of EB irradiation dose on experimental impact values (auc) at low (Pf=0.049), mid- (0.50) and high (0.95) fracture probabilities of GFRP-BMC samples from Data Set 1 (solid lines) and 2 (dotted lines).
ln
a
ln [ -ln ( 1 –
P
f
)]
1.5
2
2.5
-3
-2
-1
0
1
Untreated 0.86 MGy Data Set 2 Untreated
0.30 MGy 0.86 MGy Data Set 1
uc
Fig. 7 Weibull plots of GFRP irradiated by electron beam at each dose for Data Set 1 (solid lines) and 2 (dotted lines).
EB Irradiation Dose, D / MGy
W
eib
ull Coeff
icient,
n
EB Irradiation Dose, D / kJ g
-10.0
0.4
0.0
4
5
6
7
8
9
Data Set 1
Data Set 2
0.2
0.4
0.6
0.8
0.2
0.6
0.8
[image:5.595.321.530.68.263.2] [image:5.595.68.276.71.294.2] [image:5.595.325.533.317.546.2]In both cases, a signal peak is generated from 0.86 MGy EB (solid line). In contrast, no sharp peak is observed in the untreated GFRP samples (dotted line). For the GFRP and matrix composite the signal peaks are generated at
inflection points of 323.073 and 323.026 mT, respectively,
indicating an increase in unpaired electrons in the EB irradiated GFRP-BMC, which are probably dangling bonds. ESR signals of the GFRP and matrix composite are similar
in shape and magnetic field value, thus it is possible the
dangling bonds observed are from the polyester styrene-butadiene polymer.
The signal magnetic fields,Bof 323.073 and 323.026 mT
correspond closely to that of studies of Si-glass network
(323.7 mT, g-factor=2.001)25) and close to EB-irradiated
polypropylene (PP) film at 321322 mT,
polydimethylsilox-ane (PDMS) at 322.7 mT,26)and novolak-type phenol resin at
322.8 mT.21) Therefore, dangling bonds are detected in the
polymer.
Upfield between 323.4 and 324 mT, there is a dip in the
signal which is the same in both untreated and treated samples so is not considered to be dangling bonds.
4.3 SEM and fracture mechanism to raiseauc
SEM observation of entire fracture surfaces seem to show 0.86 MGy HLEBI treated GFRP has much more polymer
adhering to the glassfibers than the untreated although very
little is observed in the untreated. Figures 10 and 11 show SEM of fracture surfaces for the untreated (a) and 0.86 MGy
treated (b) samples at lower and higher magnifications,
respectively, showing the 0.86 MGy HLEBI treated GFRP
has more polymer adhering to fibers (arrows) than the
untreated. Figures 10 and 11 show fracture surfaces of two
Data Set 1 samples selected atPf=0.47, the most
improve-ment in auc (auc=6.01 and 8.27 kJ·m¹2 for untreated and
0.86 MGy, respectively). SEM observations of two additional
fracture surfaces of Data Set 2 selected at Pf=0.96
(auc=10.49 and 12.33 kJ·m¹2 for untreated and 0.86 MGy,
respectively) yield the same results. SEM observation shows
the increased fiber-matrix adhesion seen in the 0.86 MGy
samples appears to assist for more internal matrix cracking,
or more energy for a higherauc. Since thefibers get stronger
adhesion along the sides, the composite structure is held
together more efficiently, hence cracks have to twist and
ESR Intensity
,
IESR
/ arb
. units
322.0 323.0
Magnetic Field, B / mT
g = 1.998 g = 1.998
323.073 mT 0.86 MGy
Untreated (0 MGy)
(a)GFRP (b)Matrix composite (no glass fibers)
323.026 mT 0.86 MGy
Untreated (0 MGy)
ESR Intensity
,
IESR
/ arb
. units
322.0 323.0
Magnetic Field, B / mT
324.0 324.0
Fig. 9 ESR signals of GFRP (a) and matrix composite (b), respectively before (dotted line) and after 0.86 MGy (solid line) HLEBI.
Untreated,
P
f= 0.47
a
uc= 6.01 kJm
-2WD 20mm 20.0 kV 500x 50
μ
m
(a
)
0.86 MGy,
P
f= 0.47
a
uc= 8.27 kJm
-2WD 24mm 20.0 kV 700x 50
μ
m
[image:6.595.320.532.56.647.2](b
)
[image:6.595.54.283.70.285.2]branch out avoiding the compressive sites increasing impact resistance.
This increased matrix adhesion can be further explained by the ESR peaks (Fig. 9), where dangling bonds are generated creating repulsive forces between outer shell electrons in the polymer matrix. The matrix would therefore, impart
in-creased compressive stress on thefibers increasing adhesion
force. Moreover, the lone pair electrons in the matrix may
bond with thefibers more efficiently.
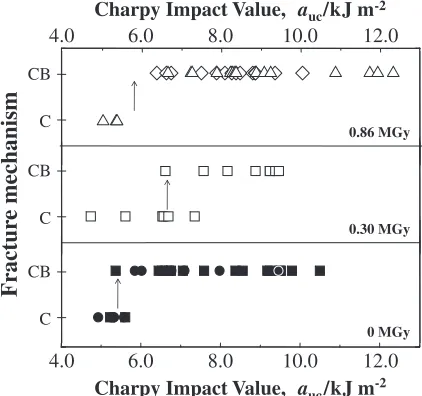
Furthermore, while all Charpy impact specimens fracture
completely, asaucincreases fracture surface area is observed
to increase. For example, Fig. 12 illustrates the two main fracture mechanisms for Data Sets 1 and 2 combined. At low
auc, samples exhibit a clean straight fracture perpendicular
to the specimen length. At auc>³5.46.7 kJ·m¹2 fracture
mechanism is observed to transform from the clean fracture
(C), to secondary microcrack proliferation and/or bends (CB)
near the main crack. The microcracks, branching from or
occurring³0.5 to 3 mm from the main crack, and bends are
generated on the tensile and compressive sides, respectively, and are single or multiple. The trend seems to follow independent of EB dose or untreated as shown in Fig. 13
where conversions occur at ³5.8, 6.7, and ³5.4 kJ·m¹2 for
0.86 and 0.30 MGy EB irradiated, and untreated GFRP
samples, respectively. Above auc>³5.46.7 kJ·m¹2 up to
the maximumaucobtained at 12.33 kJ·m¹2, fracture surface
area is observed to increase in the form of more jagged shape and increasing secondary cracks visible on the tension side.
For these reasons, increased fiber-matrix adhesion seen in
the 0.86 MGy samples appears to assist for more internal cracking, increasing resilience to impact of the GFRP-BMC,
raising theauc.
5. Conclusions
By using homogeneous EB irradiation Charpy impact
strength was apparently improved 5 to 25% in the center
region of compression-molded BMC GFRP panels.
(1) HLEBI of 0.86 apparently increased Charpy impact values in the GFRP at the center of the mother panel
Untreated,
P
f= 0.47
a
uc= 6.01 kJm
-2(a
)
WD 19mm 20.0 kV 2500x 10
μ
m
0.86 MGy,
P
f= 0.47
a
uc= 8.27 kJm
-2WD 24mm 20.0 kV 2500x 10
μ
m
[image:7.595.64.275.68.652.2](b
)
Fig. 11 SEM micrograph at high magnification of singlefibers showing untreated GFRP (a) and 0.86 MGy HLEBI treated (b) having more polymer adhering to afiber than the untreated.
auc > 5.4 ~ 6.7 kJm-2
Bends on one or both sides of crack on compressive side
single or multiple cracks on tensile side
CB Crack(s) and/or Bend(s) auc < 5.4 ~ 6.7 kJm-2
C Clean fracture
10 mm
2 mm
[image:7.595.318.534.70.300.2]l = 80 mm
Fig. 12 Illustration showing dominant fracture mechanisms of the GFRP undergoing impact tests were a clean fracture (C) for samples with
with texture angles with respect to the longitudinal direction of sample from 0 to 90 degrees.
(2) HLEBI of 0.30 MGy apparently increased Charpy
impact values (auc) over the untreated at nearly all
fracture probabilities (Pf).
(3) Impact values appeared to improve with increasing EB dose up to 0.86 MGy in two experimental Data Sets 1 and 2.
(4) Differences in n for two Data Sets 1 and 2 were
probably due to highflaw sensitivity typical of
GFRP-BMC: rough texture with weak resin-rich areas,
anisotropy of fiber and filler density gradients in the
center of the mother panel. Thus, the high variance in impact values of section-a from panel-to-panel and at different areas within each panel can be explained. Overcoming this, the impact values were apparently
raised 16.7%overall by HLEBI of 0.86 MGy.
(5) Fracture mechanism was observed to convert at
auc>³5.46.7 kJ·m¹2 from clean to secondary
micro-crack proliferation and/or bends near the main crack,
with increasing fracture surface area asaucincreased.
(6) SEM observation revealed 0.86 MGy HLEBI treated
GFRP had much more polymer adhering to fibers than
the untreated. ESR peaks indicated dangling bonds are generated creating repulsive forces between outer shell electrons in the polymer matrix, apparently exhibiting
increased compressive stress on the fibers increasing
adhesion force. Moreover, the lone pair electrons generated in the matrix may have bonded with the
fibers more efficiently. For these reasons, increased
fiber-matrix adhesion seen in the 0.86 MGy samples
appears to assist for the increased internal micro-compressive stress sites at the impact point, absorbing and dispersing the energy by increased internal cracking, increasing resilience to impact of the
GFRP-BMC, raising theauc525%.
Acknowledgements
The authors extend their sincere gratitude to Mr. Shota Iizuka M.S., of Tokai University for his great assistance with the electron beam irradiation, electron spin resonance equip-ment and his technical knowledge. Mr. Sho Iishi is gratefully acknowledged for his great assistance with the electron microscope. Dr. Masae Kanda, Dr. Keisuke Iwata and Mr. Naoya Tsuchikura are gratefully acknowledged for their expertise and valuable input. Premix, Inc. is gratefully acknowledged for their generous support.
REFERENCES
1) M. Faudree and Y. Nishi:Mater. Trans.51(2010) 23042310. 2) H. Sato, Y. Inoue, K. Iwata, A. Tonegawa and Y. Nishi:J. Jpn. Inst.
Met.72(2008) 520525.
3) Y. Nishi, H. Kobayashi and M. Salvia:Mater. Trans.48(2007) 1924 1927.
4) Y. Nishi, A. Mizutani and N. Uchida:J. Thermoplastic Compos. Mater. 17(2004) 289302.
5) Y. Nishi, T. Toriyama, K. Oguri, A. Tonegawa and K. Takayama: J. Mater. Res.16(2001) 16321635.
6) Y. Nishi, A. Mizutani, A. Kimura, T. Toriyama, K. Oguri and A. Tonegawa:J. Mater. Sci.38(2003) 8992.
7) N. Yamaguchi, K. Oguri, A. Tonegawa and Y. Nishi:J. Jpn. Inst. Met. 68(2004) 198201.
8) K. Oguri, N. Iwataka, A. Tonegawa, Y. Hirose, K. Takayama and Y. Nishi:J. Mater. Res.16(2001) 553557.
9) K. Oguri, K. Fujita, M. Takahashi, Y. Omori, A. Tonegawa, N. Honda, M. Ochi, K. Takayama and Y. Nishi:J. Mater. Res.13(1998) 3368 3371.
10) K. Oguri, N. Iwatani, H. Izumi, A. Tonegawa, K. Takayama and Y. Nishi: Proc. 2nd Japan-France Seminar on Intelligent Materials and Structures, (University of Louis Pasteur Strasbourg, France) (1998) pp. 142144.
11) A. James and M. Lord: Macmillan’s Chemical and Physical Data, London and Basingstoke, (The Macmillan Press, Ltd., 1992) pp. 484 485.
12) A. Gordon and R. Ford:The Chemist’s Companion: A Handbook of Practical Data, Techniques, and References, (Wiley Interscience Publication, 1972) pp. 112113.
13) American Society for Testing and Materials: ASTM D 6110-02 (2002). 14) Japanese Industrial Standards Committee: JIS K 7077 (1991). 15) Y. Nishi, K. Inoue and M. Salvia:Mater. Trans.47(2006) 28462851. 16) J. Splett, H. Iyer, C. Wang and C. McCowan: National Institute of Standards and Technology (NIST) Recommended Practice Guide, Computing Uncertainty for Charpy Impact Test Machine Test Results; Special publication 960-18, (US Department of Commerce: Boulder, Colorado, 2008) pp. 2729.
17) T. Nishida and E. Yasuda: Evaluation of Dynamic Properties of Ceramics(Ceramics no rikigaku tokusei hyouka in Japanese), (Nikkan Kogaku Shimbun Sha, Tokyo, 1986) pp. 5051.
18) D. Thomas: Plast. Rubber Int.8(1983) 5357. 19) M. Dowell: Plast. Eng.33(1977) 3132.
20) A. Mizutani and Y. Nishi:Mater. Trans.44(2003) 18571860. 21) H. Takei, K. Iwata, M. Salvia, A. Vautrin and Y. Nishi:Mater. Trans.51
(2010) 22592265.
22) S. Ohnishi, Y. Ikeda, M. Kashiwagi and I. Nitta:Polymer2(1961) 119 141.
23) W. Weibull:Ingeniörs vetenskaps akademien, nr. 151, (Generalstabens litografiska anstalts förlag, Stockholm, 1939) pp. 1214.
24) W. Weibull:Ingeniörs vetenskaps akademien, nr. 153, (Generalstabens litografiska anstalts förlag, Stockholm, 1939) pp. 1622.
25) K. Iwata, H. Kobayashi and Y. Nishi:J. Jpn. Inst. Met.69(2005) 1016 1020.
26) Y. Nishi, H. Kawazu, H. Takei, K. Iwata, H. Kudoh and K. Mitsubayashi:Mater. Trans.52(2011) 19431948.
Charpy Impact Value, auc/kJ m -2
Fractur
e mechanism
Charpy Impact Value, auc/kJ m-2
0.86 MGy
0.30 MGy
0 MGy
C CB
C CB
C CB
4.0
4.0 6.0 8.0 10.0 12.0
[image:8.595.64.275.72.270.2]6.0 8.0 10.0 12.0