Removal of Trace Impurity from Limestone Using Flotation Techniques
Masami Tsunekawa
1;*, Yugo Honma
1, Kyoungkeun Yoo
2, Naoki Hiroyoshi
1and Mayumi Ito
11Graduate School of Engineering, Hokkaido University, Sapporo 060-8628, Japan 2Korea Institute of Geoscience & Mineral Resources, Daejeon 305-350, Korea
High grade limestone was obtained by removing trace impurities through reverse and carrier flotation techniques. A simple method for measuring the impurity content of limestone was developed by correlating the amount of impurities and the turbidity of suspensions of residue from limestone dissolved in 20% acetic acid.
Impurity removal more than 50% with limestone recovery better than 85% was obtained under suitable conditions by both reverse flotation and carrier flotation using sodium oleate (NaOl) and dodecylammonium acetate (DAA) as collectors. Limestone containing more than 0.15 mass% impurity was used as the carrier. These results suggest that limestone treated by flotation can be used as high quality limestone in paper manufacturing. [doi:10.2320/matertrans.M-MRA2008839]
(Received January 23, 2008; Accepted October 7, 2008; Published December 3, 2008)
Keywords: trace impurity, limestone, reverse flotation, carrier flotation
1. Introduction
A large amount of limestone (CaCO3) is used widely in
various industries such as cement, plastic, and paper, due to its low cost.1–3)However, high grade limestone deposits are
being depleted and low grade deposits need to remove their impurities before they can be utilized.3)
Limestone to be used as filler for paper requires strict quality control in properties such as particle size and whiteness.2)Limestone containing more than 0.1 mass% of trace impurities is difficult to use, because the impurities decrease the whiteness of paper and the durability of the equipment used in paper manufacturing. Here, the impurities are defined as materials not dissolved by acetic acid through a method developed in this study. Due to this, limestone with more than 0.1 mass% impurities is only used for cement. The establishment of a method to remove trace impurities from limestone with impurity contents above 0.1 mass% is important to be able to utilize such resources as filler for paper manufacturing.
Flotation is the most important and versatile mineral processing technique for fine particle processing and upgrad-ing of ore. Both uses and applications of flotation are beupgrad-ing expanded to treat greater tonnages and to cover new areas.4) There are various flotation researches related to lime-stone:3,5–10)(1) calcite or limestone is removed as a gangue
to recover fluorite,5,6) apatite,7) or phosphate ore;9,10) (2)
limestone is beneficiated to use for cement or paper manufacturing;11–14)and (3) silica is removed from limestone
using an emulsion flotation technique.12) However, there
have been no papers reporting the removal of trace impurities from limestone using flotation, obtaining high grade lime-stone as filler in paper manufacturing.
The present study characterized trace impurities in a limestone by X-ray diffractometry and X-ray fluorescence analysis, then determined the turbidity using 20% acetic acid and glycerol, and the trace impurities were removed by a modified flotation technique.
2. Materials and Experimental Procedures
2.1 Materials
Two samples of limestone from the Kawara mine in Fukuoka, Japan were used and the impurity contents were determined to be 0.13 mass% and 0.15 mass% by the method described below in 2.2. The sample with 0.13 mass% impurity was ground with a ball mill (UBM-2L, Masuda Co. Ltd., Japan) and the ground product was used as feed for the flotation tests. The median diameter of the ground product was 9.45mm and the 90% of cumulative undersize (D90)
particle diameter was 40.54mm. The limestone with 0.15 mass% impurity was used as carrier in the flotation tests, because aside from it can adsorb the impurities, it can be used for cement and has little effect on the grade of the concentrate.
Impurity particles in the limestone were collected by dissolving limestone in 20% acetic acid (Wako Pure Chemi-cal Industries, Ltd.) at 5 mass% pulp density and centrifuging the suspension at 17600g centrifugal acceleration for 10 min in a RS-18III high speed refrigerated centrifuge (TOMY SEIKO Co. Ltd., Japan). The precipitate was dried at 65C overnight and characterized by the method described in 2.3.
2.2 Quantitative analysis of impurity in the limestone by turbidity measurement
The impurity particles in limestone collected from the centrifuge tube by the method described in 2.1 (residue obtained by dissolving limestone with 20% acetic acid) were added to a mixture of 25 cm3 of glycerol and 25 cm3 of
distilled-deionized water (DDW). After agitation, the sus-pension was introduced into a glass cell, and the turbidity of the suspension in the glass cell was measured with a turbidimeter (SEP-PT-201, Nihon Seimitsu Kagaku Co., Ltd., Japan).
2.3 Characterization of the impurities
The impurity particles obtained using the method describ-ed in 2.2 were analyzdescrib-ed with an X-ray diffractometer (XRD,
following conditions: radiation, Cu K, 30 kV, 200 mA; step scanning; time constant 0.5 seconds; and angle range 0–60 degree/2. The XRF was measured under the following conditions: Rh, 30 kV; time 300 seconds. Before analyzing the particle size, the impurity particles were conditioned to disperse fully by ultrasonic treatment for 30 seconds.
The zeta potentials of the impurities were analyzed with a zeta potential analyzer (Zeta-Plus, Brookhaven Instruments Co., USA).
m
tests. All flotation experiments were performed using a flotation tester (FT-1000, Heiko Seisakusho Ltd.): flotation cell 8 cm long, 8 cm wide, and 12 cm high, and with a 5 cm diameter impeller blade. The pH of the suspensions was adjusted with 1 kmolm3 of NaOH or H
2SO4. All reagents
were of analytical grade.
The removal ratio was calculated by determining the differences between the amount of impurities in 3 g of limestone before and after the flotation tests.
removal ratio¼impurity amount before flotationimpurity amount after flotation
impurity amount before flotation 100
The recovery ratio was determined by the following equation:
recovery ratio¼amount of limestone in non-froth product
limestone amount of feed 100
2.4.1 Reverse flotation
A 40 g of limestone feed was added to 340 cm3of
distilled-deionized water (DDW). With a magnetic stirrer, the suspension was agitated at 600 rpm for 5 min, then 0.015 cm3 methyl isobutyl carbinol (MIBC, Nippon Kasei Chemical Co., Ltd.) as frother and 0.015–0.03 cm3 kerosene (Wako Pure Chemical Industries, Ltd.) as collector were added. The suspension was agitated for conditioning at 600 rpm for 5 min. After conditioning, the suspension was introduced into the flotation cell, and 60 cm3 of DDW was
added to adjust the pulp density to 10 mass%, and the pH of the suspension was adjusted to a desired value. Flotation was conducted under the following conditions: air flow rate, 1,200 cm3min1; flotation time, 5 to 30 min; impeller
speed, 1200 rpm. The impurities were removed as froth, and the froth and the non-froth product were dried at 105C for one day, then weighed and their impurity contents were measured.
2.4.2 Carrier flotation combined with reverse flotation
The limestone with 0.15 mass% impurity was used as the carrier. Carrier flotation was conducted using sodium oleate (NaOl) or dodecylammonium acetate (DAA) as collectors under the following conditions: for the limestone, suspension 30 g of limestone feed was added to 270 cm3of DDW; for the
carrier suspension, 10 g of carrier was added to 90 cm3 of
DDW. Each suspension was agitated at 600 rpm for 10 min with a magnetic stirrer and then for another 3 min after adding a desired amount of collector. The two suspensions were mixed and conditioned in a flotation cell at 1700 rpm for 5 min after adding 0.015 cm3 of MIBC, 0.015 cm3 of
kerosene (or isooctane), and 40 cm3of DDW, and adjusting
the pH. Flotation was conducted for 10 min under the same conditions as in the reverse flotation.
3. Results and Discussion
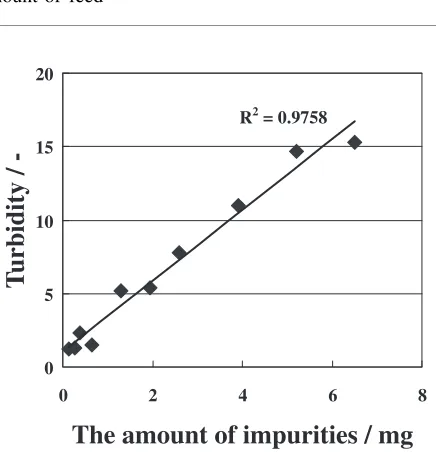
The impurity content of the limestone is extremely low. A
simple and accurate method was developed to determine trace amounts of impurities by dissolving limestone in 20% acetic acid solution. Figure 1 shows the turbidity of suspen-sions containing known amounts of impurities. There was a good correlation between the turbidity and the amount of impurities (R2¼0:9758). The trace amount of impurities
was determined by this method using the calibration curve shown in Fig. 1.
Figure 2 shows the XRD pattern of the impurities with peaks for quartz and calcite observed; some calcite remains after dissolving the limestone with 20% acetic acid. As can be seen in Table 1, the results of the XRF analysis indicate that the major components of the impurities are Si and Ca, agreeing with the results of XRD. The impurities were analyzed with a CHN-corder to measure the carbon content
R2 = 0.9758
0 5 10 15 20
0 4 8
The amount of impurities / mg
T
urbidity /
-2 6
[image:2.595.320.538.324.550.2]and the result is shown in Table 2. The carbon content other than CaCO3 is 10.5 mass% in the impurities, showing that
quartz is a main component of the impurities. As shown in Fig. 3, microscopic observation indicated that the silicate particles are partly coated with carbon components.
Figure 4 shows the particle size distribution of the impu-rities. The cumulative undersize of 10, 50, and 90% were obtained as 8.39mm, 44.35mm, and 158.70mm, respectively. Because 90% of the impurities were coarser than 9mm, about 90% of the impurities could be liberated by grinding limestone to finer than 10mm.
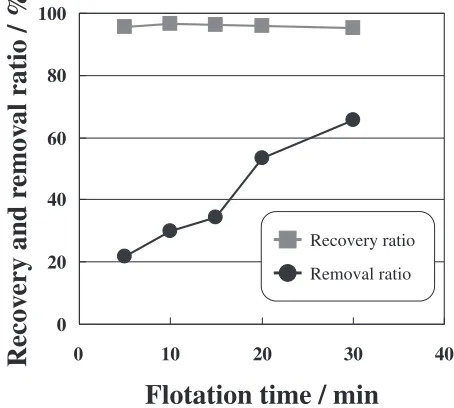
Because the impurities are coated partly with carbon, it is expected that they can be removed by flotation using kerosene as a collector for carbon. This flotation technique was conducted to obtain high grade limestone as the non-froth product, therefore this is termed as reverse flotation. Figure 5 shows the removal ratio of the impurities and the recovery ratio of the limestone as a function of flotation time. The removal ratio increases from 21.0% at 5 min to 65.7% at 30 min, while the recovery ratio is almost constant and higher than 97%. To obtain high removal ratio, longer flotation time is needed due to low collision probability of air bubbles and few amount of impurities. Figure 6 shows the relation between the removal ratio and the recovery ratio to kerosene addition with flotation time kept at 10 min in the reverse flotation. The removal ratio increases from 34.2 to 58.8% with increase in the amount of kerosene and the
Q Q
Q
Ca
1000
2000
3000
10 20 30 40 50 60
0
2
/ Deg.
Intensity/counts
CaCa
[image:3.595.57.282.72.233.2]Fig. 2 XRD pattern of impurities collected from the limestone dissolved with 20% acetic acid. Q, quartz; Ca, calcite.
Table 1 Composition of the impurities analyzed with XRF, where the impurities were collected as residue by dissolving limestone with 20% acetic acid.
Element Ca Si Fe P Al Mg Zn Cr
[image:3.595.320.535.74.265.2]w/w% 39.8 34.8 10.2 6.8 4.0 2.6 1.3 0.5
Table 2 Amounts of C, H, and N in the impurities determined by CHN-corder, where the impurities were collected as residue by dissolving limestone with 20% acetic acid.
Element C H N
w/w% 10.5 0.7 Not detected
50 m
Fig. 3 Microscopic observation of impurities collected from the dissolved limestone.
0 20 40 60 80 100
0 10 20 30 40
Flotation time / min
Recov
ery and r
emov
al ratio / %
Recovery ratio
Removal ratio
Fig. 5 Limestone recovery and impurity removal ratios with increasing flotation time in reverse flotation. Conditions: suspension vol. 400 cm3; pulp concentration 5%; MIBC 0.0015 cm3; kerosene 0.0015 cm3.
0 20 40 60 80 100
1 10 100 1000
Particle size /
Cumulativ
e / %
µm
[image:3.595.313.540.329.533.2] [image:3.595.47.291.415.606.2]recovery ratio is always higher than 95%. Generally, kerosene adsorbs on surfaces of hydrophobic particles such as carbon and it accelerates adhesion of particles on the bubbles and improves flotation performance. This would be the reason why the removal ratio of impurities increases with increasing amounts of kerosene.
As stated above, the reverse flotation using kerosene as a collector is an effective method to remove impurities in limestone, but the removal ratio of impurities is not sufficient when kerosene amounts are low and flotation times are short: for example the removal ratio is only 21.0% with 5 min of flotation time and 0.015 cm3kerosene addition.
There are two reasons for the low removal ratio of impurities in the reverse flotation: (1) when the surface coverage of silica particles with carbon is small due to low carbon content, the particles behave as hydrophilic and this causes the low floatability of particles. In this case, addition of collector, which will change the silica surface to hydro-phobic, may be effective to improve the removal of silicate impurities; (2) because the inertia of very fine impurities is very small, they move together with the fluid and the probability of collision between particles and bubbles is low. To overcome this, carrier flotation combined with reverse flotation was applied, where carrier particles of sizes sufficiently large to collide with bubbles were introduced in the flotation pulp. The carrier attaches to the fine particles, then adsorbs on bubbles and floats. It has been widely reported that carrier flotation is effective to remove fine particles in small amounts15) with coal,16) anatase,17) and
gold.18)In the carrier flotation, a low-grade limestone with
0.15 mass% impurities and of 106–149mmparticle size was used as the carrier, because the low-grade limestone is easily obtainedin situ and the carrier/impurity mixture recovered by the flotation can be expected to find usage in cement production.
The quartz surface is negatively charged over a wide pH range and with a cationic surfactant (DAA) it can be expected to adsorb on silica surfaces by electrical attraction19)and act
as a collector. For simplicity, the carrier flotation using DAA is termed as ‘‘DAA-carrier flotation’’ in the succeeding paragraphs.
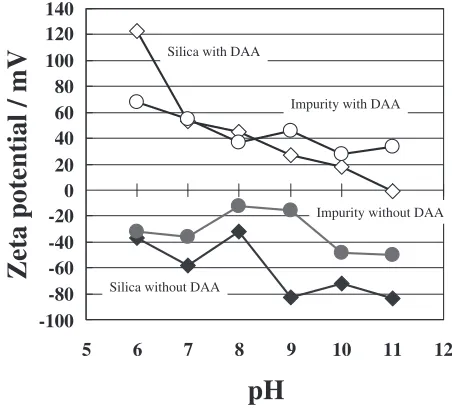
Prior to the DAA-carrier flotation experiments, the zeta potentials of the impurities and silica with and without 0.0001 moldm3 DAA were determined to confirm if the
potential of the impurities is similar to that of silica. The result is shown in Fig. 7. Here, silica was used as the substitute for the main component of the impurities, i.e. quartz. The zeta potentials of the impurities without DAA agree well with the reported values20,21)for quartz and the
curve shapes of the impurities and silica were similar. Both the zeta potentials of the impurities and silica with DAA changed from negative to positive and are close to each other. This suggests that the surfaces of the impurities behave like the silica surface and that DAA can be adsorbed.
Carrier flotation using 0.001 moldm3DAA as a collector
and 0.015 cm3 isooctane as an accelerator was performed.
Figure 8 shows that the removal and the recovery ratios decrease with the increase in pH from 9 to 11. The dissociation constant of dodecylammonium ions is 10.63,22) and above pH 10.6 the capability of DAA as a collector would decrease. The highest removal ratio of 58.3% was obtained at pH 9.
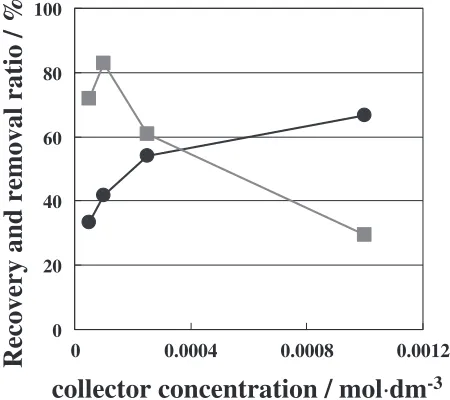
The effect of DAA concentration on the recovery and the removal ratios was investigated at pH around 10. As shown in Fig. 9, with increasing DAA addition, the removal ratio increases and the recovery ratios decreases sharply. The cationic collector DAA adsorbs on the negatively charged surface of impurities and carrier, and both collide and adhere to each other mainly due to hydrophobic bond, then float. Because DAA acts both as a collector and a frother, the increase in DAA addition produces an abundant froth volume, causing the decrease in the recovery of limestone as non-froth product.
Sodium oleate (NaOl) acts as a collector for quartz23,24)in the presence of Ca2þ ions. The preliminary experiment results of bubble pick-up tests for the impurity showed that 0
20 40 60
Recovery ratio
Removal ratio
Amount of collector added / cm
3Recov
ery and r
emov
al ratio / %
0 0.01 0.02 0.03 0.04
Fig. 6 Limestone recovery and impurity removal ratios with increasing amounts of collector added in the reverse flotation: pulp concentration 5%; MIBC 0.0015 cm3; flotation time 10 min.
-100 -80 -60 -40 -20 0 20 40 60
5 6 7 8 9 10 11 12
pH
Zeta potential / mV
Impurity without DAA
Silica without DAA
Impurity with DAA
[image:4.595.313.539.75.279.2] [image:4.595.57.282.76.272.2]the impurity particles became hydrophobic with NaOl, thus carrier flotation using NaOl was conducted and is termed as ‘‘NaOl-carrier flotation’’.
The effect of particle size of the carrier in NaOl-carrier flotation was investigated with these carrier size fractions: 149–210mm, 210–297mm, 297–590mm, and 590–850mm. Figure 10 shows that the removal ratio decreases with increasing carrier size, while the recovery ratio remains almost constant. This could be explained from the fact that smaller sized carriers have larger specific surface areas and adsorb more impurity particles such as quartz and carbon. The 149–210mmcarrier was used in the succeeding experi-ments.
Figure 11 shows the effect of pH on the removal ratio in the NaOl-carrier flotation. The highest ratio (56.3%) with 85.2% recovery was obtained in the pH region between 10 and 11, where activation of the quartz by calcium species dissolved from limestone is expected to occur.23,24) This
activation is explained by the formation of Ca-oleate salts in solution or in the vicinity of the quartz surface followed by adsorption. This adsorption mechanism requires the presence of Ca(OH)þions in solution, which only becomes significant near pH 11.23)At pH values lower than 11, concentrations of Ca(OH)þ decrease, and this would cause a decrease in the adsorption amount of the collector on the quartz surface and a decrease in its floatability.
As discussed above, the impurity removal ratio of more than 50% with limestone recovery higher than 85% was 0
20 40 60 80 100
9 10 11
pH
Recov
ery and r
emov
al ratio / %
Recovery ratio
Removal ratio
Fig. 8 The effect of pH on limestone recovery and impurity removal ratios in the DAA-carrier flotation. Conditions: suspension vol. 400 cm3; pulp concentration 5%; MIBC 0.0015 cm3; isooctane 0.0015 cm3; DAA 0.0001 moldm3; flotation time 10 min.
0 20 40 60 80 100
0 0.0008
collector concentration / mol
·
dm
-3Recovery and removal ratio / %
0.0004 0.0012Fig. 9 The effect of DAA concentration added on limestone recovery and impurity removal ratios in the DAA-carrier flotation. Conditions: suspension vol. 400 cm3; pulp concentration 5%; MIBC 0.015 cm3; isooctane 0.015 cm3; flotation time 10 min; pH 10.0. The symbols are the same as in Fig. 9.
0 20 40 60 80 100
149-210 210-297 297-590 590-850
Carrier size /
µ
m
Recov
ery and r
emov
al ratio / %
Recovery ratio [image:5.595.55.284.75.283.2]Removal ratio
Fig. 10 The effect of carrier size on limestone recovery and impurity removal ratios in the NaOl-carrier flotation. Conditions: suspension vol. 400 cm3; pulp concentration 5%; MIBC 0.015 cm3; kerosene 0.015 cm3; NaOl 0.0004 moldm3; flotation time 10 min; pH 8.0–8.4.
3 4 5 6 7 8 9 10 11 12 13
Product Recovery (%)
56.3%
10-4M Carrier Size:-210
0 20 40 60 80 100
pH
Removal (%)
0 20 40 60 80 100
Removal (%) Product Recovery (%)
NaOl: 3.74
+150 m
[image:5.595.315.541.77.276.2] [image:5.595.313.540.353.535.2] [image:5.595.57.282.354.554.2]high quality limestone in paper manufacturing.25)
4. Conclusions
Trace impurities from limestone were removed by reverse flotation and carrier flotation combined with reverse flotation. A simple method of measuring impurity content of limestone was developed by correlating the amount of impurity and the turbidity of residue suspensions prepared by dissolving limestone with 20% acetic acid.
In the reverse flotation with kerosene as collector, the removal ratios increased from 21.0% to 58.8% and 65.7% with the increase in the amount of collector and flotation time, respectively. In the carrier flotation combined with reverse flotation, where limestone with 0.15 mass% impuri-ties was used as the carrier, the removal ratios were 56.3% with NaOl as collectors at pH 10–11 and 58.3% with DAA at pH 9, respectively. These results suggest that more than 50% of trace impurity can be removed by flotation techniques, and the non-froth product can be used as a high quality limestone in paper manufacturing.
Acknowledgements
The authors gratefully acknowledge the support provided by Taiheiyo Cement Corporation, and would like to thank Mr. S. Okawa and Mr. S. Okada for their help.
4) B. A. Wills:Mineral Processing Technology(6th ed.) (Butterworth-Heinemann, Oxford, 1997) pp. 267–344.
5) V. V. Morozov, H. Baldauf and H. Schubert: Int. J. Miner. Proc.35 (1992) 177–189.
6) M. Tsunekawa and T. Takamori: J. MMIJ97(1981) 1187–1192. 7) J. Hanna and I. Anazia: Miner. Metall. Proc.7(1990) 84–89. 8) Y. Hu and Z. Xu: Int. J. Miner. Proc.72(2003) 87–94. 9) N. A. Abdel-Khalek: Miner. Eng.13(2000) 789–793.
10) R. C. C. Ribeiro, J. C. G. Correia, M. B. M. Monte, P. R. Seidl, C. G. Mothe and C. A. Lima: Miner. Eng.16(2003) 873–875.
11) H. Peter: Pit and Quarry77(1984) 36–40. 12) O. Ofor: J. Min. Geology33(1997) 35–38. 13) F. J. Wellenkamp: Miner. Proc.41(2000) 522–528.
14) S. Rao, B. V. Narayana and S. Subramanian: Indian J. Eng. Mater. S.4 (1997) 139–144.
15) T. V. Subrahmanyam and K. S. Eric Forssberg: Int. J. Miner. Proc.30 (1990) 265–286.
16) G. Atesok, F. Boylu and M. S.Celı˘k: Miner. Eng.14(2001) 661–670. 17) S. Mathur: J. Colloid Interface Sci.256(2002) 153–158.
18) L. Valderrama and J. Rubio: Int. J. Miner. Proc.52(1998) 273–278. 19) M. C. Fuerstenau, Oxide, Silicate Flotation:Flotation Science and
Engineering(K. A. Matis, Eds., Marcel Dekker Inc., New York, 1995) p. 91.
20) K. P. Ananthpadmanabhan, P. Somasundaran and T. W. Healy: Trans. SME/AIME266(1979) 2003–2009.
21) J. S. Laskowski and J. Ralston: Colloid Chemistry in Mineral Processing(Elsevier, Amsterdam, 1992) p. 252.
22) M. Tsunekawa, E. Ogata, H. Habata, T. Takamori and T. Hirajima: J. Soc. Powder Technol. (Jpn.)27(1990) 603–608.
23) S. C. Brown, Y. I. Rabinovich and B. M. Moudgil: Miner. Metall. Proc. 21(2004) 164–168.
24) F. Rashchi, Z. Xu and J. A. Finch: Colloid Surface A 132(1998) 159–171.