Munich Personal RePEc Archive
Demand side management - electricity
savings in Danish households reduce load
variation, capacity requirements and
associated emission
Klinge Jacobsen, Henrik and Juul, Nina
DTU Managemnt Engineering, Technical University of Denmark
July 2015
Online at
https://mpra.ub.uni-muenchen.de/80060/
DEMAND SIDE MANAGEMENT - ELECTRICITY SAVINGS IN
DANISH HOUSEHOLDS REDUCE LOAD VARIATION,
CAPACITY REQUIREMENTS AND ASSOCIATED EMISSION
Henrik Klinge Jacobsen & Nina Juul, DTU Management Engineering, Technical University of
Denmark
Working Paper 2015
Abstract
Energy savings are seen as contributing substantially to reducing the fossil fuel dependence in Denmark and improving energy efficiency. Electricity savings in households is contributing to this through the marginal effect of generating the electricity. As the fossil fuel content of generation varies across the hours also the fossil fuel reduction varies based on the hourly profile of the electricity saved. Using the hourly profile of savings, the different effect on emissions and power capacity requirements from varying electricity savings in households is compared. The value of the savings hereby depends on the profile of the reduced electricity demand.
We establish the link between the aggregated hourly household load profile in Denmark and specific categories of household appliances. The objective is to evaluate the fossil fuel effect and value of increasing the average
efficiency of different types of appliances. More efficient appliances are assumed to reduce the load curve for each appliance category proportionally.
Policy implications relate to the finding that different types of electricity savings have very different emissions and capacity value effects. Potentially it may be relevant to support electricity savings (investment in efficient appliances) differently depending on the hourly profile of the savings. We want to clarify if some end-uses provide better social return on the investment in the efficient appliance model/version than others? The result suggests that savings in efficient lighting have much higher value than a corresponding annual saving in cold appliances.
Introduction
Demand side management can reduce not only electricity demand, but also the load variation and capacity requirements. If consumption categories with high peak hour and winter share can be targeted the effect on the aggregate load profile can be substantial. Reducing the variation of load will reduce the absolute required flexibility in the power system and contribute to a integrating more fluctuating generation such as wind and PV. This is a secondary contribution to flexibility that reduces the need for other kinds of flexible demand, flexible generation capacity, interconnection capacity and storage.
Private household consumption is one of the consumption categories that have the highest share of consumption in wintertime and during the late afternoon/evening peak hours, especially in Denmark. If electricity savings can be targeted not only households but also the appliance categories of households with highest winter and peak hour consumption, then savings of this kind should be incentivised the most through public schemes or standards. Targeted savings with this profile also contribute to reduce emissions and costs in the power sector as well as for the consumers and this will contribute to the same objective as increasing the fluctuating renewable wind and PV capacity in the power mix. Demand side options to increase flexible demand and reduce required power system flexibility thus include measures such as programmes targeting behavioural changes, investment in control equipment and investment in efficiency for electric end use technologies. These solutions add to the primary flexibility measures on the supply side such as direct and indirect electricity storage, heat storage and electricity based heat production in district heating networks.
Flexibility requirements depends on the profile of demand, thereby demand side management that reduce the variation in demand across hours and seasons will also contribute to reducing the required flexibility. For example, the peak demand hours of a year will be characterised by different situations with regard to non-controllable generation from wind and PV. A few of these peak hours will have little or no wind generation and thereby the need for controllable generation including imports will be defined by these hours. Reducing the electricity demand in these hours from households is especially important if it is possible to target parts of household demand that is having a large fraction of demand in hours with high fossil fuel content and in peak load hours. Household electricity demand in Denmark overall contributes substantially to peak load as the seasonal pattern is particularly winter heavy and its daily peak coincide with system peak where households in the peak hours constitute 35-40% of total load relative to their average annual share of 20% (2013).
New demand from electric vehicles and residential heat pumps can potentially provide flexibility, but it is very unlikely that these small demands from a lot of individuals/households will behave optimally for the power system providing short term flexibility. However, it is possible to provide a substantial contribution to reducing the requirement for flexibility if these loads can be affected such that their average profile is with the major part of the demand outside the day and evening peak hours. This, for example, means avoiding charging electric vehicles for free at work during working hours or immediately after returning home in the late afternoon.
Demand side management and demand side response in Denmark
Demand side response to flexibility requirements in the power sector are seen as very important for incorporating large amounts of fluctuating generation from wind and PV. The flexibility however seems very limited when examining household electricity demand, contrary to the flexibility in large scale heat pumps, boilers and some parts of industrial demand. Large heat pumps and boilers in district heat production in Denmark can be expected to contribute much more to flexibility in the future, but these are part of the energy supply system and not the demand side. The demand side has potential to contribute to flexibility, but the evidence and economic incentive for households to switch to active short term adjustment of demand following price changes is very limited (Andersen et. al., 2014). In other countries with lower residential electricity price and similar income levels the electricity consumption is higher and partly because of this in some countries heating is based to a higher degree on electric heating (or air-conditioning) or heat pumps. Here the value of active adjustment of consumption and incentive is higher since the amount of switchable consumption is higher than in most DK households.
Therefore traditional demand side management measures might produce an impact on the power system that still contribute to reduce emissions and even may contribute to peak savings at hours where wind is not available. Households are expected to react very little to the price changes for electricity in the short run and may often not even be exposed to the short run hourly price changes. Specifically for Denmark the energy duty and tax part together with network charges is a very high share of the household tariff (approx. 80%). Therefore the price impact and signal from fluctuation in wholesale electricity markets are weakened substantially at the household retail level.
Price impacts are more likely observed for the long term adjustments of household consumption patterns and also when choosing the technology variants of the appliances in a household. Electricity demand in households may be affected in the long term through the prices of efficient appliance variants relative to the less efficient versions. Our objective here is to quantify if the effect on emissions in the power sector and the contribution to reduce peak demand is different depending on which part of household demand is being affected. Such difference exists if the hourly profile of the consumption from different appliances varies across the day and across seasons. If the profile varies so does the effect of savings for each appliance category. The relevance of this lies in the policy implication from such difference:
Potentially, the choice in favour of efficient appliances should receive different levels of support due to differences in the value in terms of both emission reduction (fossil fuels) and reduction of peak electricity requirements.
This paper aims to clarify if some end-uses provide better social return on the investment in the efficient appliance model/version than others and policy should be designed accordingly?
Methods
1) Danish hourly load profile for the aggregated household demand in 2008 (Danish Energy Agency, (1))
2) Danish composition of stocks of appliance categories and the their annual electricity consumption (Danish Energy Agency)
3) REMODECE project data for appliance category load profiles (3,4) and EURECO data for comparison
By combining the three types of data we are able to scale the REMODECE load profile for each type of appliance with the Danish annual consumption for a similarly defined category. Following this we calibrate to the total Danish load profile for households.
Construction of the aggregated Danish households load profile:
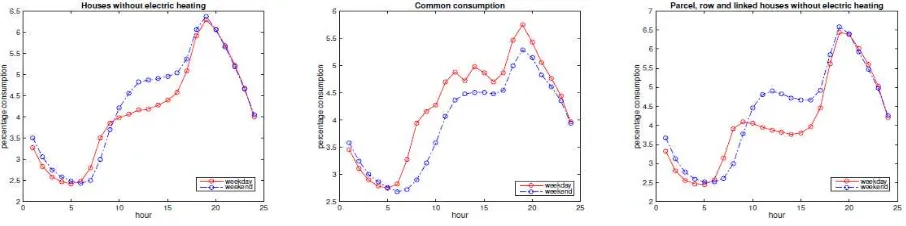
[image:4.612.79.532.264.377.2]First of all the actual aggregated Danish load profile for one household during an average day of 2008 is calculated. The chosen year is 2008 in order for it to be comparable with REMODECE project which is dated to 2008. Data were taken from (1) The available data set contains the aggregated load of an average Danish household as percentage of the total yearly load, for each of the 8760 hours of the year. Therefore, in order to obtain the average weekday and weekend of the year, the 365 days of one year were sorted in weekdays and weekends first. Afterwards, the average of each of the 24 daily hours for weekdays and weekends were calculated separately, resulting in the load profile of the actual Danish average weekday and weekend. This procedure was repeated for each of the five different types of buildings considered in the data set. The results are presented in Figure 1.
Figure 1 Load profiles in DK for three categories of households, comparison of weekdays and weekends
In the figure the load profile for 24 hours are given as a fraction of the total consumption over 24 hours. The data represent the weighted average over one year, such that the sum adds to 100% of the total consumption for each category if multiplied by annual demand in the category. This is the profile that the consumption from all appliance categories should add up to. The comparison was done separately for average week and weekday profiles. The main observation from the load profiles are that load variation within household consumption over 24 hours is very substantial and it is also larger than the other consumption categories. Reducing load variation for this consumer segment is where the impact on overall load variation will be the largest.
Electricity savings for lighting and cold appliances could reduce load variation
and flexibility requirements
We choose to examine a possible difference between two categories with expected load profile that diverge, namely lighting and cold appliances.
The analysed saving scenarios compare the effects of savings of equal amount of annual electricity consumption from the two appliance categories. In both cases we reduce the consumption of the appliance category with 260GWh per year, where the total household consumption is approximately 8650 GWh. The savings corresponds to around 100 kWh per household per year and about 3% of the household electricity consumption. The average annual household consumption in Denmark is 3435 kWh.
The savings for each of the two categories correspond to around 20% efficiency increase for each. This is only achievable in time as the more efficient choice for replacement has to diffuse through the stock of appliances. The example thus implicitly assumes a time horizon of 5-10 years if the more efficient version is 25-50% better than the average version of the appliance bought.
should be included but here we disregard that possible effect as unlikely or at least rather small and not affecting the profile of the savings.
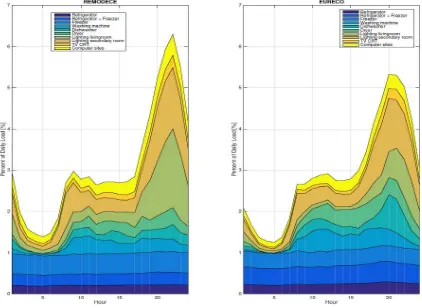
Figure 2 Composition of load profiles for household electricity demand in Denmark, comparing two datasets
Examining two different datasets based on panel data of household measured consumption for actual appliances, we compare the composition on appliance categories. The left pane illustrates the composition from the most recent study (2008) with the largest number of appliance categories included. This dataset is based on a cross section of European countries and as such may deviate a bit from the Danish profile. Therefore a comparison with the EURECO dataset (right pane) is made, where specific Danish households in the Odense area are included, but this dataset is old (around 2000) and the number of households and appliance categories are less. There is a quite good correspondence between the datasets for the distribution on appliance categories and the overall profile, but the peak is located later in the REMODECE data. Therefore an adjustment is made for the location of the peak using the REMODECE left pane data and shifting the hours around the peak corresponding to the annual average total profile according to the profile in Figure 1.
Comparing the effects on the power system for emissions and peak load
electricity demand from the appliance categories. The 4 seasons are based on simulation for one particular weak of each season.
Figure 3 Fuel shares in DK electricity generation (Balmorel simulation)
Figure 4 Specific CO2 emissions in DK generation per hour for seasons (Based on previous fig)
Figure 5 Emission effect of savings in lighting and cold appliances in Denmark, winter season
The emission distribution across the hours of the days mainly illustrate the large variation in household electricity demand throughout the day. The variation in specific emissions does not have a big impact. For winter season Figure 5 show that the largest absolute savings are during day time and especially at peak hours. The left pane give the absolute emissions related to total electricity consumption for one household for each hour of the day. The right pane illustrates the accumulated emissions for the household over one day. The two saving options are illustrated with the yellow (cold appliances) and red (lighting) curves. These two curves illustrate total household electricity consumption reduced by the savings in just one of the appliance categories at a time. It can be observed that the lighting consumption contributes much more to reducing emissions during peak hours simply because there is a higher electricity consumption for lighting in these hours with limited daylight.
[image:8.612.91.396.436.683.2]In the summer season the opposite pattern for the two appliance categories compared to winter season show up. During night and also the morning the absolute savings in the cold appliances category is the largest. Even for the evening peak the savings in the lighting category is only at the same level as savings for cold appliances.
Figure 7 Emission effect of savings in lighting and cold appliances in Denmark, spring
Figure 8 Emission effect of savings in lighting and cold appliances in Denmark, autumn
The spring and autumn seasons have the same variation in demand during the day and night. However the situation is more in between with regard to the lighting category. This is also seen from the right pane where accumulated emission over one day is reduced approximately the same (the two curves cannot be distinguished) for the two categories.
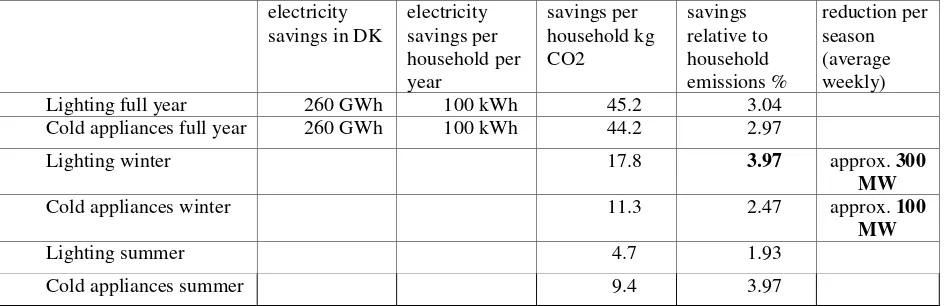
[image:9.612.91.424.380.621.2]electricity savings in DK
electricity savings per household per year savings per household kg CO2 savings relative to household emissions % reduction per season (average weekly) Lighting full year 260 GWh 100 kWh 45.2 3.04
Cold appliances full year 260 GWh 100 kWh 44.2 2.97
Lighting winter 17.8 3.97 approx. 300 MW
Cold appliances winter 11.3 2.47 approx. 100 MW
Lighting summer 4.7 1.93
[image:10.612.67.540.36.189.2]Cold appliances summer 9.4 3.97
Table 1 Summary of the seasonal electricity savings, emissions and possible effect on peak demand
Table 1 report the main results with regard to emission savings for the two appliance categories and for summer and winter season. Overall the two saving options compared result in almost identical savings of emissions with lighting only marginally better than cold appliances. The differences are only observed for the seasons where lighting reduces emissions almost 4% during winter (where emissions are highest) and cold appliances only 2.5%. In the summer season this is reversed with cold appliances contributing 4% here. Lighting is however much more interesting than cold appliances if considering the likely impact on peak demand. With a rough estimate the contribution to reducing peak load in Denmark is almost 300 MW for lighting compared to only 100 MW for cold appliances. This is a very large difference in impact and should not be neglected even though the actual benefit is depending on many assumptions about how the rest of the power system and loads evolves. The actual figure is uncertain since this is based entirely on data for one particular week. Secondarily the actual peak for a full winter season will be influenced by endogenously determined power prices as dependent on the reduced demand from the household appliance category and this is not considered in the analysis here. Other electricity savings in households and changes in composition of demand from various consumer segments may change this effect on the peak. Changes in the supply side both from the stochastic elements from wind and solar and particularly the interconnection capacity does also influence the value of reducing the peak load. With more than sufficient interconnection capacity and access to outside capacity in the peak hours this value is not that high, but if regulatory restrictions (obligations) enforce capacity requirements then the effect on peak load is associated with a high value.
Summer savings contribute much less to the total emissions savings than do winter savings. Summer contribution for lighting is only 10.4% compared to savings contribution in winter season of 39.4% of the annual savings for lighting.
Conclusions
Demand side management in households do not provide a lot of short term flexibility but efficiency increase of electric appliances can still produce a lot of contribution to fossil fuel savings in Denmark and even savings on peak capacity. However, the categories of appliances produce very different contributions to these elements and it is therefore important to construct the load profiles for the different categories of household consumption in Denmark. This work made an important contribution towards that by matching several panel data studies with appliances to the profile of overall household consumption for all of the hourly profiles for all weeks of the year.
It is evident from Figure 2 that the load profile of households in Denmark is very differently influenced by the appliance categories. Some of the categories have a stable profile whereas e.g. lighting, dishwasher, TV has a large fraction of the consumption in peak hours (household peak).
The value of demand reduction is highest for the peak hours and therefore also the value of improving appliance efficiency is the highest for those categories that have the largest fraction of consumption in these hours.
dishwasher; TV appliances etc. are categories where annual efficiency increases should be supported (incentivised) more than for other categories with more stable load pattern (for example, freezers).
There does not seem to be a big difference between the electricity savings impact on fossil fuel from the two categories of savings. This is partly due to the power system composition and associated fuel use (present system) on which the Balmorel analysis was based. We are calculating the effects based on average emission per hour including the generation from non-fossil resources. Marginal emissions in each hour can be expected to have higher emission content as it will rarely be wind and PV that will be the marginal generation. In a future system with less coal CHP capacity in Denmark, this may change in a way where emissions content are much higher in peak hours and during winter time, due to more gas based generation in peak hours and little fossil fuel use outside peak hours. In our results the peak load hours have only slightly higher fossil fuel content and it is mainly observed in autumn and summer seasons. In a future scenario there will probably be a larger difference between the two categories, with winter and daytime savings have a much higher impact on emissions (lighting) than savings distributed more evenly across hours and seasons (cold appliances).
An energy policy with a fossil fuel reduction objective should thus focus more on reducing consumption from these appliance categories than from others given that the (support) costs per annual reduction unit is similar. Combining the fossil fuel reduction objective and the value from power capacity reduction the policy conclusion is thus:
Public support for electricity savings (eg. saving obligations) should be considered differentiated across different load categories (for example, household appliances)
References
1. http://www.elforbrugspanel.dk/Pages/Rapportering.aspx, Danish Energy Agency, visited 03/26/2105. 2. Demand-side management - end-use metering campaign in 400 households of the European community -
assessment of the potential electricity savings, Commission of the European Communities, 2002. SAVE PROGRAMME CONTRACT N° 4.1031/Z/98-267.
3. Residential monitoring to decrease energy use and carbon emissions in Europe, ISR - University of Coimbra, Coimbra, Portugal, 2008. IEEA programme.
4. B. Grinden, Analysis of monitoring campaign in Europe, ISR - University of Coimbra, Coimbra, Portugal, 2008. REMODECE project, IEEA programme.
5. Andersen FM, Larsen HV, Kitzing L, Morthorst PE. (2014) Who gains from hourly time-of-use retail prices on electricity? An analysis of consumption profiles for categories of Danish electricity customers , WIRE's Energy and Environment, 3, issue 6, p. 582-593. doi: 10.1002/wene.120