Nat. Hazards Earth Syst. Sci., 13, 2271–2278, 2013 www.nat-hazards-earth-syst-sci.net/13/2271/2013/
doi:10.5194/nhess-13-2271-2013
© Author(s) 2013. CC Attribution 3.0 License.
EGU Journal Logos (RGB) Advances in
Geosciences
Open Access
Natural Hazards and Earth System Sciences
Open Access
Annales Geophysicae
Open Access
Nonlinear Processes in Geophysics
Open Access
Atmospheric Chemistry and Physics
Open Access
Atmospheric Chemistry and Physics
Open Access
Discussions
Atmospheric Measurement
Techniques
Open Access
Atmospheric Measurement
Techniques
Open Access
Discussions
Biogeosciences
Open Access Open Access
Biogeosciences
Discussions
Climate of the Past
Open Access Open Access
Climate of the Past
Discussions
Earth System Dynamics
Open Access Open Access
Earth System Dynamics
Discussions
Geoscientific Instrumentation
Methods and Data Systems
Open Access Geoscientific
Instrumentation Methods and Data Systems
Open Access
Discussions
Geoscientific Model Development
Open Access Open Access
Geoscientific Model Development
Discussions
Hydrology and Earth System
Sciences
Open Access
Hydrology and Earth System
Sciences
Open Access
Discussions
Ocean Science
Open Access Open Access
Ocean Science
Discussions
Solid Earth
Open Access Open Access
Solid Earth
Discussions
The Cryosphere
Open Access Open Access
The Cryosphere Natural Hazards and Earth System Sciences
Open Access
Discussions
Seismic behavior of buried pipelines constructed by design criteria and construction specifications of both Korea and the US
S.-S. Jeon
School of Civil & Urban Engineering, Construction Technology Research Center, INJE University, Kimhae, South Korea Correspondence to: S.-S. Jeon (ssj@inje.ac.kr)
Received: 19 January 2013 – Published in Nat. Hazards Earth Syst. Sci. Discuss.: 5 March 2013 Revised: 6 August 2013 – Accepted: 6 August 2013 – Published: 13 September 2013
Abstract. Earthquake loss estimation systems in the US, for example HAZUS (Hazard in US), have been established based on sufficient damage records for the purpose of preven- tion and efficient response to earthquake hazards; however, in Korea, insufficient data sets of earthquakes and damage records are currently available. In this study, the earthquake damages to pipelines in Korea using the pipeline repair rate (RR) recommended in HAZUS was reevaluated with the de- gree of confidence when RR is used without modification for the damage estimation of pipelines in Korea. The nu- merical analyses using a commercial finite element model, ABAQUS, were carried out to compare stresses and strains mobilized in both brittle and ductile pipelines constructed by the design criteria and construction specifications of both Ko- rea and the US. These pipelines were embedded in dense sand overlying three different in situ soils (clay, sand, and gravel) subjected to earthquake excitations with peak ground accelerations (PGAs) of 0.2 to 1.2 g and 1994 Northridge and 1999 Chi-Chi earthquake loadings. The numerical re- sults show that differences in the stress and strain rates are less than 10 %. This implies that RR in HAZUS can be used for earthquake damage estimation of pipelines with a 90 % confidence level in Korea.
1 Introduction
Buried pipelines, one example of lifelines, have not been damaged by previous earthquakes in Korea. However, vibra- tions of the ground and buildings were perceived by people living in both Busan and Masan, located in the southern part of Korea, during the 2005 Fukuoka earthquake that occurred in Japan (Park et al., 2005). In recent years, earthquakes have
become frequent in Korea and thus the behavior of buried pipelines subjected to seismic loading is examined in this pa- per.
There have been a number of studies related to buried pipelines. For example, Wang and Cheng (1979) performed a simplified quasi-static seismic deformation analysis for buried pipelines subjected to earthquake loadings to exam- ine the effects of seismic parameters. They found that the be- havior of buried pipeline was dominantly influenced by the time delay of seismic waves and the nonuniformity of soil resistance.
Takada and Tanabe (1987) developed a three-dimensional quasi-static numerical analysis of continuous or jointed pipelines subject to large ground deformations or seismic ground motions. The wave propagation hazard for a particu- lar site is characterized by the peak ground motion parame- ters as well as the appropriate propagation velocities.
O’Rourke and Liu (1999) analyzed the ground strain and curvature due to wave propagation and discussed the influ- ence of various subsurface conditions on ground strain. Tran- sient ground strains are recognized to govern the response of buried elongated structures, such as pipelines and tunnels, under seismic wave propagation.
Scandella and Paolucci (2010) investigated the shear strain and the longitudinal strain variability with depth through qualitative examples and comparisons with analytical for- mulas. In Korea, Lee et al. (2009) performed earthquake time-history analyses for a buried gas pipeline using vari- ous parameters such as the type of buried gas pipeline, end restrain conditions, soil characteristics, single and multiple earthquake input ground motions, and burial depths.
Buried pipeline damage correlations are a critical com- ponent of loss estimation procedures applied to lifelines
Published by Copernicus Publications on behalf of the European Geosciences Union.
Table 1. Brittle and ductile pipelines classified by pipe materials (Ministry of Environment, 2010a, b).
Types of pipeline Pipe materials
Ductile Ductile iron, steel, galvanized steel, polyethylene, stainless steel, copper, polyethylene sheeting, fiber reinforced
Brittle Steel reinforced concrete, cast iron, earthen, centrifugal reinforced concrete, lime cast iron, steel reinforced concrete box, Hume concrete
1
0 20 40 60 80 100 120
PGV (cm/sec)
0 1 2 3 4 5
R e p a ir R a te ( e a /k m )
Brittle Pipe Ductile Pipe
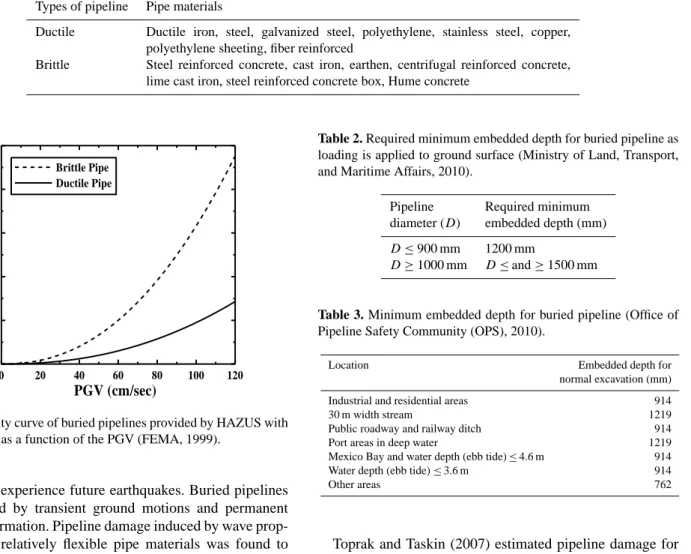
Fig. 1. Fragility curve of buried pipelines provided by HAZUS with the repair rate (RR) given as a function of the peak ground velocity (PGV) (FEMA, 1999)
Fig. 1. Fragility curve of buried pipelines provided by HAZUS with the RR given as a function of the PGV (FEMA, 1999).
expected to experience future earthquakes. Buried pipelines are damaged by transient ground motions and permanent ground deformation. Pipeline damage induced by wave prop- agation for relatively flexible pipe materials was found to be somewhat less than damage of relatively brittle material (O’Rourke and Ayala, 1993). Permanent ground deforma- tion and its effect on pipelines has been extensively inves- tigated (O’Rourke et al., 1998), especially in countries of high seismicity. During representative earthquakes, includ- ing the Loma Prieta earthquake in 1989, buried pipelines were damaged mostly in landfill areas by means of joint pull- out failures and pipeline cracking. In addition to these dam- age patterns, artificial connections between relatively rigid pipelines and largely deformable plastic pipe experienced damage during the Kobe earthquake in 1995. Trunk pipeline damage and cracks in the axial direction of concrete pipelines were assessed. Pipeline repair rates (RRs) following the 1994 Northridge earthquake were evaluated and explained (Jeon, 2002; Jeon and O’Rourke, 2005).
Shih and Chang (2006) performed a seismic fragility anal- ysis of underground polyvinyl chloride (PVC) pipelines and demonstrated that there was no significant difference be- tween the analyses results and the empirical equation used by HAZUS (Hazard in US), i.e., earthquake loss estimation software developed by the Federal Emergency Management Agency (FEMA).
Table 2. Required minimum embedded depth for buried pipeline as loading is applied to ground surface (Ministry of Land, Transport, and Maritime Affairs, 2010).
Pipeline Required minimum diameter (D) embedded depth (mm) D ≤ 900 mm 1200 mm
D ≥ 1000 mm D ≤ and ≥ 1500 mm
Table 3. Minimum embedded depth for buried pipeline (Office of Pipeline Safety Community (OPS), 2010).
Location Embedded depth for
normal excavation (mm)
Industrial and residential areas 914
30 m width stream 1219
Public roadway and railway ditch 914
Port areas in deep water 1219
Mexico Bay and water depth (ebb tide) ≤ 4.6 m 914
Water depth (ebb tide) ≤ 3.6 m 914
Other areas 762
Toprak and Taskin (2007) estimated pipeline damage for each damage relationship and earthquake scenario. The re- sults show that the variation in ductile pipeline damage esti- mations by various relationships was higher than the vari- ation in brittle pipeline damage estimations for a partic- ular scenario earthquake. Pineda-Porras and Ordaz (2007) proposed a new seismic intensity parameter utilizing peak ground velocity (PGV) and peak ground acceleration (PGA) to estimate damage in buried pipelines due to seismic wave propagation.
Tan and Chen (1987) estimated the probability of system serviceability as the ratio of the number of networks that were found to be serviceable to the sample size used for sim- ulation. The water transmission network was adopted and an- alyzed to serve as a numerical example demonstrating how to assess the probabilities of system unserviceability under a set of assumed parameter values deemed reasonable. Filho et al. (2010) developed a decision support system for the management of geotechnical and environmental risks in oil pipelines using GIS.
Historical data and recorded data sets after 1905 show that
Korea is in a zone of low to medium seismicity but it has
a high frequency of earthquake occurrences. In this study,
Table 4. Mechanical characteristics of soils used in numerical anal- ysis.
Soil γ E ν c ϕ
types (kN m
−3) (MPa) (kPa) (
◦)
Clay 15.0 5 0.35 10 20
Loose sand 18.6 15 0.3 0 25
Medium dense sand 19.0 25 0.3 0 28
Dense sand 19.4 45 0.3 0 30
Dense sand and gravel 20.0 120 0.25 0 35
pipelines were classified by their mechanical properties fol- lowed by a numerical analysis which examined the behavior of the buried pipelines constructed by the design criteria and construction specifications of Korea and the US. The anal- ysis considered seismic parameters including PGA achieved from previous earthquake records, pipeline types, and in situ ground conditions.
This paper is organized as follows. First, the repair rate (RR) of pipelines (Sect. 2) is described based on historical literature review. Second, the design criteria and construction specifications (Sect. 3) are examined for the pipelines in both Korea and the US. Then, a dynamic behavior of the pipeline using numerical analysis (Sect. 4) is evaluated by using the commercial finite element software ABAQUS (2006).
2 Repair rate of pipelines
The damages of water pipelines in HAZUS were assessed by historical data of pipeline repairs from previous earthquakes.
As shown in Fig. 1, the algorithm of RR for brittle and duc- tile pipelines in HAZUS was developed by O’Rourke and Ayala (1993). They developed the empirical relationship of RR with PGV based on the damage reports of the pipelines from previous earthquakes (FEMA, 1999).
Since the mechanical characteristics of pipelines, design criteria, and construction specifications of both Korea and the US are very similar, the pipeline damages induced by seismic loadings in Korea has been predicted by RR sug- gested in HAZUS. As the seismic loading was applied to buried pipelines constructed based on the design criteria and construction specifications in Korea and the US, the mobi- lized stresses and strain rates of pipelines were examined and compared.
As listed in Table 1, buried utilities in Korea, including water, gas, and communication pipelines, were classified into two categories; ductile and brittle (Ministry of Environment, 2010a, b).
3 Design criteria and construction specifications The burial depth, the backfill compaction ratio, and the di- ameter and thickness of pipelines listed on the construction
2
0 5 10 15 20 25 30 35 40
Time (sec)
-1.0 -0.8 -0.6 -0.4 -0.2 0.0 0.2 0.4 0.6 0.8 1.0
A c c e le r a ti o n ( g )
Northridge
Fig. 2. History of ground acceleration record during the 17 January 1994 Northridge (M
w= 6.7) earthquake (COSMOS, 2010)
0 10 20 30 40 50 60 70 80 90
Time (sec)
-0.6 -0.4 -0.2 0.0 0.2 0.4 0.6 0.8 1.0
A c c e le r a ti o n ( g )
Chi-Chi
Fig. 3. History of ground acceleration record during the 21 September 1999 Chi-Chi (M
w= 7.6) earthquake (COSMOS, 2010)
Fig. 2. History of ground acceleration record during the 17 Jan- uary 1994 Northridge (M w = 6.7) earthquake (COSMOS, 2010).
2
0 5 10 15 20 25 30 35 40
Time (sec)
-1.0 -0.8 -0.6 -0.4 -0.2 0.0 0.2 0.4 0.6 0.8 1.0
A c c e le r a ti o n ( g )
Northridge
Fig. 2. History of ground acceleration record during the 17 January 1994 Northridge (M
w= 6.7) earthquake (COSMOS, 2010)
0 10 20 30 40 50 60 70 80 90
Time (sec)
-0.6 -0.4 -0.2 0.0 0.2 0.4 0.6 0.8 1.0
A c c e le r a ti o n ( g )
Chi-Chi
Fig. 3. History of ground acceleration record during the 21 September 1999 Chi-Chi (M
w= 7.6) earthquake (COSMOS, 2010)
Fig. 3. History of ground acceleration record during the 21 Septem- ber 1999 Chi-Chi (M w = 7.6) earthquake (COSMOS, 2010).
specifications were used in a numerical analysis to examine the dynamic behavior of pipelines as seismic loading was ap- plied.
3.1 Korea
As listed in Table 2, the burial depths, considering traffic
loading, should be greater than 1.2 and 1.5 m for the 900 and
1000 mm diameter pipelines, respectively (Ministry of Land,
Transport, and Maritime Affairs, 2010). The burial depth for
large diameter pipelines should be greater than their diameter
but, in the case that a burial depth of 1.2 m is not available due
to spatial constraints associated with adjacent underground
structures, the burial depth can be reduced to 0.6 m with per-
mission from the officer in charge of roadway management
(Ministry of Land, Transport, and Maritime Affairs, 2010).
Table 5. Mechanical characteristics of pipelines used in numerical analysis.
Types of γ E ν
pipelines (kN m −3 ) (MPa)
Ductile 69.1 160 000 0.28
Brittle 22.5 19 600 0.17
3.2 The US
Table 3 lists the specifications for the burial depth of pipelines with respect to construction sites where there are no special conditions (Office of Pipeline Safety Community (OPS), 2010). Pipeline burial depth should be greater than the frozen ground depth or frost line. High quality soil is used as backfill material for buried pipelines. Each layer of back- fill should have a thickness less than 0.3 m and a compaction ratio of greater than 90 % and, at important construction sites, the water content of backfill materials should be around the optimum water content and at most 0.2 m lifts with high com- paction ratios are required (OPS, 2010). Sands used as trench backfill material should have a high compaction ratio with moisture near the optimum water content and the use of soil lifts is recommended (OPS, 2010).
Lift thicknesses of 20–50 % of the minimum diameter of a pipeline are required in Korea (Ministry of Land, Transport, and Maritime Affairs, 2010). A lift thickness corresponding to one-eighth of the minimum diameter of the pipeline or 100 mm is required in the US (OPS, 2010).
4 Evaluating dynamic behavior of the pipeline using numerical analysis
In this study, a numerical analysis using the commercial fi- nite element software ABAQUS (2006) was carried out to analyze the dynamic behavior of pipelines subjected to seis- mic loading. The analysis’s results show the strain rates and stresses of buried pipelines constructed by the design criteria and construction specifications suggested by both Korea and the US. The applied seismic loadings were generated from real PGV time records measured at strong motion stations (SMSs) No. 24436 and CHY080 for the 1994 Northridge (M w = 6.7) and 1999 Chi-Chi (M w = 7.6) earthquakes, re- spectively. Figures 2 and 3 show the measured PGV time records of Northridge and Chi-Chi earthquakes, respectively (COSMOS, 2010). In addition to these, the virtual values of various PGAs, such as 0.2, 0.4, 0.6, 0.8, 1.0, and 1.2 g, at a period of 0.5 s and earthquake duration of 10 s were applied as seismic loadings. Numerical modeling will first be exam- ined, followed by dynamic behavior of the pipeline.
Fig. 4. Configuration of numerical model associated with pipeline and an in situ soil depth and width of 30.5 and 120 m, respectively.
Fig. 5. Finite element mesh configuration and boundary conditions for pipelines and an in situ soil depth and width of 30.5 and 120 m, respectively.
4.1 Numerical modeling
The numerical analyses for brittle and ductile pipelines with a greater than 1000 mm diameter and constructed based on the design criteria and construction specifications of both Ko- rea and the US were carried out. Since a compaction ratio of 90 % for backfill materials is required in both countries, dense sand soil properties were used. The analyses were per- formed considering various in situ ground conditions such as clay, loose sand, medium dense sand, dense sand, and sand with gravel. In Korea, the diameter and thickness of the brit- tle and ductile pipelines used in the analyses were 1050 and 75 mm and 1130 and 16 mm, respectively. For the US, these values were 1058 and 75 mm and 1144 and 16 mm, respec- tively.
Figures 4 and 5 show the configuration and finite differ-
ence meshes of numerical analysis associated with pipeline,
ground conditions, and boundary conditions. The figure
shows an in situ soil depth of 30.5 m with a 120 m width
ground. No horizontal displacements are allowed at the left
and right sides and no horizontal nor vertical displacements
are allowed at the bottom. In Korea and the US, a depth of
soil cover above the pipe (h B1 ) of 1.5 and 0.9 m and a bed-
ding thickness beneath the pipe (h B2 ) of 0.25 and 0.15 m,
Table 6. Mobilized strain difference (%) of pipeline modeled based on Korea and US design criteria and construction specification.
Pipe Soil\PGA (g) 0.2 0.4 0.6 0.8 1.0 1.2 Avg 1 SD 2
Ductile pipe
Clay 8.8 8.6 8.7 8.9 8.3 6.4 8.3 0.94
Loose sand 9.8 9.8 8.3 8.5 7.8 7.4 8.6 1.02
Medium dense sand 9.7 8.7 8.6 7.9 4.8 7.7 7.9 1.65
Dense sand 9.1 6.1 5.0 6.3 6.2 3.5 6.1 1.85
Dense sand and gravel 8.8 4.8 5.0 4.6 4.6 4.5 5.4 1.69
Brittle pipe
Clay 8.5 8.5 4.9 4.4 3.8 6.0 6.0 2.09
Loose sand 8.8 9.9 6.0 3.0 3.1 4.1 5.8 2.97
Medium dense sand 8.9 7.5 5.2 3.1 3.0 2.8 5.1 2.62
Dense sand 9.9 9.3 8.0 4.4 2.2 3.3 6.2 3.28
Dense sand and gravel 9.8 6.7 8.0 4.2 5.3 5.4 6.5 2.06
1Avg: average;2SD: standard deviation.
Table 7. Mobilized stress difference (%) of pipeline modeled based on Korea and US design criteria and construction specification.
Pipeline Soil\PGA (g) 0.2 0.4 0.6 0.8 1.0 1.2 Avg 1 SD 2
Ductile pipe
Clay 11.3 8.8 5.2 7.2 5.7 4.7 7.2 2.53
Loose sand 11.8 9.7 7.1 5.9 4.9 4.7 7.3 2.84
Medium dense sand 10.1 7.9 9.3 5.9 6.3 4.7 7.4 2.10
Dense sand 11.7 9.2 4.1 5.9 2.9 2.6 6.1 3.69
Dense sand and gravel 10.7 4.6 5.9 5.4 6.1 3.9 6.1 2.39
Brittle pipe
Clay 8.0 9.3 7.2 7.5 5.6 4.2 7.0 1.82
Loose sand 7.2 9.3 6.4 6.6 5.1 4.4 6.5 1.73
Medium dense sand 7.8 6.1 6.3 6.4 4.8 4.7 6.0 1.15
Dense sand 7.0 9.1 8.0 6.5 6.8 4.7 7.0 1.49
Dense sand and gravel 6.9 7.5 8.2 4.9 6.7 7.1 6.9 1.08
1Avg: average;2SD: standard deviation.