National Institute for Materials Science, Tsukuba 305–0047, Japan
2University of Tsukuba, Tsukuba 305–8577, Japan
Effect of deformation temperature on low-cycle fatigue properties of an Fe-28Mn-6Si-5Cr shape memory alloy was investigated. Cyclic push-pull loadings at a total strain range of 0.02 were applied to the alloy at various deformation temperatures ranging from 223 to 523 K. The microstructures and fracture surfaces in the fatigue tested samples were analyzed by means of X-ray diffraction, scanning electron microscopy and electron backscattering diffraction. The highest fatigue life of 22,400 cycles was obtained at 423 K. Increasing or decreasing the deforma-tion temperature resulted in a decrease in fatigue life to several thousand cycles. The specimens deformed to fatigue fracture at temperatures below 298 K exhibited microstructures with ε-martensite and brittle characteristics of the fracture surface, while the specimens deformed above 473 K exhibited the single γ-phase and ductile characteristics of the fracture surface. The deformation at 423 K resulted in a moderate amount of the ε-martensite and a mixed brittle/ductile fracture surface patterns. It is suggested that the highest fatigue life can be obtained when the fatigue temperature lies between Msσ and Md. [doi:10.2320/matertrans.MBW201503]
(Received October 14, 2015; Accepted February 22, 2016; Published April 1, 2016)
Keywords: martensitic transformation, shape memory alloy, low-cycle fatigue, seismic damping, ε-martensite, electron backscattering dif-fraction, fractography, phase stability, stacking fault energy
1. Introduction
Fe-Mn-Si-based alloys are well known to exhibit a shape memory effect associated with a deformation-induced mar-tensitic transformation from γ-austenite with a face centered cubic (FCC) structure to ε-martensite with a hexagonal close-packed (HCP) structure and its reversion on subsequent heat-ing1). Fe-Mn-Si-based alloys have been attracted much atten-tion as low-cost shape memory alloys, and have been utilized in connecting tools, such as pipe joints and crane-rail fish plates2). Recently, Sawaguchi et al. reported that Fe-Mn-Si-based alloys exhibit superior low-cycle fatigue (LCF) proper-ties owing to a reversible γ↔ε transformation under alterna-tive tension-compression loading, and proposed a design concept for improving LCF life3) of the Fe-Mn-Si-based al-loys. A suitable application of the fatigue-resistant Fe-Mn-Si alloys is seismic damping of buildings4). An Fe-15Mn-10Cr-8Ni-4Si seismic damping alloy was developed based on the design concept and has been applied to a skyscrapers, recent-ly.
Recent report3) on the LCF properties of ferrous high-Mn alloys with various compositions have revealed that, there are three necessary conditions to improve the LCF life: (i) stack-ing fault energy (SFE) bestack-ing Γ ≈ 20 mJm−2, or thermody-namic phase stability balance between the γ- and ε-phases, (ii) suppression of the α-phase formation and (iii) addition of Si of approximately 4 mass%. These factors determine the deformation modes of the alloy. High-Mn austenitic steels show various deformation modes, such as ε- and α -martensi-tic transformation, deformation γ-twinning, and extended or perfect dislocation slip, depending on the relative phase sta-bilities and the SFE of the γ-austenite5,6).
Deformation temperature can also affect the fatigue life of the Fe-Mn-Si-based alloys, because the deformation
tem-perature strongly affects the phase stability and the SFE in the austenite. However, the effect of deformation temperature on LCF properties in the Fe-Mn-Si-based alloys has not been reported yet. In this report, the temperature dependence of fatigue properties of an Fe-28Mn-6Si-5Cr shape memory al-loy (Ms = 314 K, Af = 403 K), was investigated at various tem-peratures ranging from 223 K (below Ms) to 523 K (above
Af). The fatigue microstructures and fracture surfaces were also observed. The effect of the phase stability and the SFE of the austenite on LCF properties are discussed.
2. Experimental
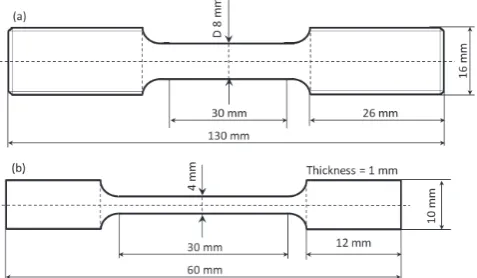
An Fe-28Mn-6Si-5Cr (mass%) alloy ingot was produced by high frequency induction melting. The ingot was hot forged and rolled at 1273 K into rods with a cross section of 17.5 mm square. They were then subjected to solution an-nealing for 1 hour at 1237 K followed by water quenching. Cylindrical LCF test samples and rectangular tensile test samples with the dimensions shown in Fig. 1(a) and (b), re-spectively, were machined from the annealed rods. LCF tests
*1
Corresponding author, E-mail: [email protected] *2
[image:1.595.309.548.630.769.2]were carried out with a symmetrical tension-compression loading under total strain control mode at a total strain range of 0.02. Fatigue samples were deformed at a strain rate of 4.0 × 10⁻³ s−1 at temperatures ranging from 223 K to 523 K using a servo-hydraulic testing machine. In order to examine the deformation-induced martensitic transformation behavior at various deformation temperatures, tensile testing was car-ried out at the strain rate of 2.5 × 10⁻⁴ s−1 in the same tem-perature range.
The constituent phases after tensile and LCF tests were de-termined by X-ray diffraction (XRD) analysis, and the inter-nal microstructures were observed by scanning electron mi-croscopy (SEM) with electron backscattered diffraction (EBSD) analysis. The samples for XRD and the EBSD anal-ysis were sectioned in a manner as shown in Fig. 2(a) and (b), respectively.
The XRD samples were prepared by mechanical grinding with SiC-emery papers and then were chemically polished in a 1:10 solution of hydrofluoric acid and hydrogen peroxide, and etched in hydrochloric acid in order to remove the surface layer damaged by machining. XRD measurements are carried out with using a monochromatized Co-Kα1 radiation at 40 kV and 35 mA with a scan step of 0.05 . Fatigue fracture surfaces were observed using a ZEISS SIGMA scanning electron mi-croscope at an accelerating voltage of 25 kV. The deforma-tion microstructures and their crystallographic characteristics were analyzed with the ZEISS SIGMA SEM equipped with an EBSD analyzer and TSL-OIM software. The samples for EBSD analysis were electro-chemical polished at 30 V using an electrolyte of ethanol: water: butyl-cellosolve: hydrochlo-ric acid = 35: 6: 5: 4.
3. Results
3.1 Mechanical properties
Figure 3 shows the temperature dependence of the tensile 0.2% proof stress, σ0.2, in the present alloy. Ms, As, and Af of the alloy measured by differential scanning calorimetry (DSC) are also indicated by arrows in the Fig. 3. The slope of the proof stress versus temperature (σ0.2–T) curve is negative below 298 K, positive between 298 K and 373 K, and nega-tive above 373 K. The posinega-tive temperature dependence of the
σ0.2 in the medium temperature range just above the Ms indi-cates that the onset of plastic deformation is dominated by the stress-induced7) or stress-assisted8)γ → ε martensitic trans-formation. The slope of the σ0.2–T curve changes from posi-tive to negaposi-tive at about 373 K. This critical temperature is
so-called the Msσ temperature, above which the critical stress
for inducing the martensitic transformation exceeds the yield stress of the parent γ-phase and the dislocation glide governs the plastic yielding. However, even above the Msσ
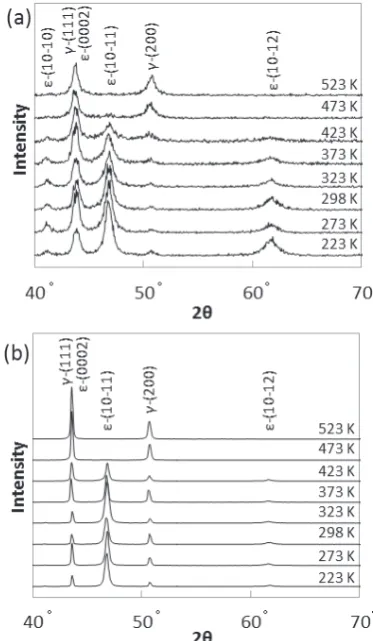
tempera-ture, the deformation-induced γ → ε martensitic transforma-tion is still possible with the aid of dislocatransforma-tions that serve as nucleation sites for the ε-martensite, referred to as strain-in-duced martensitic transformation. Figure 4(a) and (b) show XRD patterns of the alloy tested in the temperature interval from 223 K to 523 K under monotonic tensile loading and cyclic loading, respectively. The intensity of martensite peaks Fig. 3 Effect of the deformation temperature on 0.2% proof stress of
Fe-28Mn-6Si-5Cr alloy.
Fig. 4 XRD patterns obtained from samples after (a) uniaxial tensile defor-mation (b) push-pull defordefor-mation at temperatures between 223 K and 523 K.
[image:2.595.319.537.70.229.2] [image:2.595.48.289.74.172.2] [image:2.595.331.518.273.594.2]decreases with increase in the temperature from 223 K to 473 K, and totally disappears at 523 K. Thus, the upper tem-perature limit for the strain-induced martensitic transforma-tion, Md, is considered to be close to 473 K.
Figure 5(a) shows the temperature dependence of the num-ber of cycles to failure (Nf). The constituent phases deter-mined by XRD analysis are also shown on Fig. 5(a). High Nf values are obtained in the temperature range between 373 K and 473 K, and, in particular, the highest Nf of 22401 cycles was reached at 423 K that is placed between Msσ and Md. At
temperatures below 423 K, Nf decreases with decreasing test-ing temperature, while at temperatures above 423 K, Nf de-creases rapidly with increasing testing temperature.
The stress amplitude versus the number of cycles of the specimens deformed at each deformation temperature be-tween 223 K and 523 K are indicated in Fig. 5(b). Three types of cyclic hardening/softening characteristics are clearly correlated to the three temperature ranges divided by Msσ
(373 K) and Md (473 K), which are shown in Fig. 3: (i) Sig-nificant initial hardening followed by a plateau in temperature range below Msσ (range I), (ii) moderate monotonic harden-ing in range between Msσ and Md (range II), and (iii) initial hardening, subsequent softening, with or without the second-ary hardening in range above Md (range III). The deformation
saturates above 100 cycles. The stress level increases with a decrease in the deformation temperature.
On the other hand, in the temperature range III, where the
γ-austenite is strongly stabilized against ε-martensite, a rapid increase in the dislocation density may account for the high initial hardening rate. The hardening / softening behavior in this temperature range resembles that observed in a 316-type austenitic steel9), in which the initial hardening and subse-quent softening stages are ascribed to an increase in disloca-tion density and rearrangement of dislocadisloca-tions, respectively. Furthermore, at 473 K, the secondary hardening stage also appeared from 500 cycles leading to the final failure stage starting at approximately 4000 cycles. The specimen de-formed at 523 K was failed without showing the secondary hardening stage at obviously lower Nf than that of the speci-men deformed at 473 K.
A distinct cyclic deformation behavior was observed at the intermediate temperatures 373 < T < 473 K (range II), where superior Nf values are obtained. The cyclic softening was sup-pressed and the increase in the stress was rather slow. In par-ticular, the specimen deformed at 423 K that shows the high-est Nf exhibited a continuous and moderate hardening behavior. Because of the deformation temperature below Md, the cyclic deformation-induced ε-martensite is still detected in the fatigue fractured specimen, but the Gibbs free energy difference between the γ and ε phases are considered to be small. This thermodynamic condition may affect the distinct mild hardening behavior in this range, which will be dis-cussed in detail later. The specimen deformed at 373 K showed an intermediate deformation behavior between range I and II, where gradual primary hardening occurred until 80 cycles, and secondary hardening started after 500 cycles. This indicates that the change from range II to I is depending on the continuous change in the thermodynamic stability of the
γ and ε phases.
Hence, we found that the observed cyclic hardening / soft-ening behavior can be classified into three temperature ranges defined by martensitic transformation temperatures, Msσ and
Md. The temperature range which gives improved Nf is asso-ciated with the particular cyclic deformation behavior charac-terized by the continuous mild hardening.
3.2 Fatigue microstructure
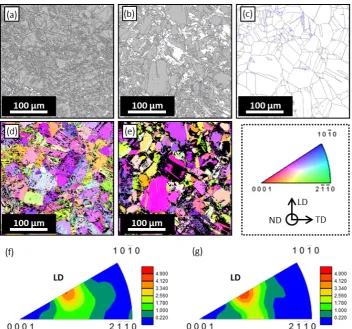
Figure 6 shows phase maps ((a), (b), (c)), inverse pole fig-ures (IPF) maps for the ε-martensite with respect to Loading direction (LD) ((d), (e)), and the corresponding inverse pole figures ((f), (g)) after fatigue failure tested at 298 K ((a), (d), (f)), 423 K ((b), (e), (g)) and 523 K (c), respectively. In the phase maps, γ-austenite and ε-martensite are indicated in white and gray, respectively. Black and blue lines indicate high-angle grain boundaries (15 < θ) and low-angle grain boundaries (2 < θ < 15 ), respectively. The deformation tem-Fig. 5 (a) Temperature dependence of number of cycles to failure. (b)
[image:3.595.59.278.71.432.2]peratures 298, 423 and 523 K are selected as representatives for three types of deformation behavior related to the tem-perature ranges characterized in Section 3.1; namely, 298 K as a representative for the temperature ranges I (T < Msσ),
423 K for II (Msσ < T < Md), and 523 K for III (Md < T).
Phase maps (Figs. 6(a), (b) and (c)) show that the micro-structure after fatigue failure in the temperature ranges I, II, and III are characterized by the ratio of area fractions of
ε-phase and γ-phase. In the temperature range I (T < Msσ) where the deformation-induced martensitic transformation is reported to dominate the plastic deformation7,8), very large amount of ε-martensite is observed (Fig. 6(a)). The deforma-tion-induced martensitic transformation is still active in the temperature range II, as shown in Fig. 6(b); however, its con-tribution to plastic deformation is considered to be smaller than that in the temperature range I. The martensitic transfor-mation no longer contributes to plastic defortransfor-mation when de-formation temperature is elevated to the range III, that is above Md.
IPF maps of the ε-phase and the corresponding inverse pole figures with respect to the deformation axis (LD) are represented in Fig. 6(d) and (f), and Fig. 6(e) and (g), respec-tively. A fiber texture nearly oriented to [10-12]//LD is de-veloped both in temperature ranges I and II. Because the uni-axial tensile deformation induces the ε-martensite variant with the highest Schimd factor and the defined crystallo-graphic orientation relationship between the γ- and ε-phases, which is known as Shoji-Nishiyama orientation relationship,
the basal plane of the deformation-induced ε-martensite is inclined from the deformation axis. The angle between the basal plane of ε-martensite and deformation axis giving the highest Schmid s factor is 45 . As a consequence, both basal and prism planes of the ε-crystal are rarely parallel to the ob-served plane that is parallel to the deformation axis. Instead, the planes close to the (10-12), approximately 43.21 apart from the basal plane, appear on the observed plane.
3.3 Characteristics in fracture surface
Figure 7 shows low magnification SEM images of fracture surfaces for the specimens deformed to fatigue failure at 298 K (range I), 423 K (range II), 523 K (range III). Typical brittle and ductile characteristics of fracture surface were ob-served at lower (range I) and higher (range III) temperatures, respectively. The fracture surface for the intermediate tem-perature (range II) exhibits the mixture of them.
Figures 8(a) and (b) show enlarged images of typical brittle fracture surfaces taken at 298 K (range I). Figure 8(a) shows flat surface with shallow dimples, which is reported to be a quasi-cleavage fracture at the γ/ε boundary in tensile defor-mation10), and cyclic deformation11). The dimples are in ar-rays along {111} traces, reflecting the collision of the different
ε-variants on the rapturing γ/ε interface. Figure 8(b) shows step-like surface pattern that resembles to a typical fracture surface on [10-10] prism planes called as fluting in HCP metals such as α-Titanium alloys12). Figures 9(a) and (b) show enlarged images of typical ductile fracture surfaces for Fig. 6 Microstructures after fatigue failure tested at different temperatures. (a,b,c) Phase maps obtained at 298 K (a), 423 K (b) and 523 K (c). (d,e) inverse
[image:4.595.122.475.67.396.2]high temperature range III. Figure 9(a) shows striations, which are known as a typical fracture surface pattern appear-ing in an early stage of ductile fatigue crack propagation un-der cyclic deformation13). Figure 9(b) shows deep and large dimples, which characterize that here is the final rupture place.
Figures 10(a–f) show enlarged images of four typical brit-tle/ductile fracture surfaces observed for intermediate tem-perature range II. Figures 10(a) and (b) exhibit quasi-cleav-age fracture and fluting, respectively. They are similar to those observed in the low temperature range I. Figures 10(c) and (d) show striations and dimples, respectively. They are similar to those observed in the high temperature range III. Figures 10(e) and (f) show examples of various irregular sur-face patterns, which cannot be classified to either of the above typical brittle or ductile fracture surface patterns. Figure 10(e) shows river patterns of cleavage plane and steps. Figure 10(f) shows ridge-like patterns with ductile nature. It should be noted that the majority of the surface patterns in the tempera-ture range II are the irregular types rather than the typical brittle patterns (quasi-cleavage and flutings) and typical duc-tile patterns (dimples and striations).
4. Discussion
4.1 Transition of deformation modes under cyclic load-ing
In this research, effect of deformation temperature on cy-clic deformation behavior of the Fe-28Mn-6Si-5Cr shape memory alloy was investigated systematically. It was revealed that the fatigue deformation microstructures and fatigue frac-ture surfaces can be classified into the following three groups with respect to the martensitic transformation temperatures,
Msσ and Md: range I (below Msσ), range II (between Msσ and Fig. 7 Low magnification SEM images for fatigue fracture surfaces in the
specimens tested at (a) 298 K (b) 423 K and (c) 523 K.
Fig. 8 Enlarged SEM images of typical brittle fracture surfaces in the spec-imen tested at 298 K, showing (a) quasi-cleavage fracture and (b) fluting.
[image:5.595.303.548.67.319.2]Fig. 9 Enlarged SEM images of typical ductile fracture surfaces after fa-tigue at 523 K, showing (a) striations and (b) dimples.
[image:5.595.48.290.667.747.2]Md), and range III (above Md). The plastic deformation modes accounting for the deformation characteristics in each tem-perature ranges can be interpreted as shown below.
4.1.1 Cyclic deformation associated with the γ → ε
transformation and the plastic deformation of the
ε-martensite
Below Msσ (range I), the stress-assisted γ → ε martensitic
transformation is reported to occur under tensile loading7), which may also occur throughout cyclic loading. Our previ-ous LCF tests on variprevi-ous Fe-Mn-Si-based alloys at room tem-perature suggested that the ε-martensite should gradually in-crease under cyclic deformation, probably accompanying reversible forward/reverse transformation (reversible two-way transformation) of the tension- and compression-induced
ε-marntesite10,14,15).
Below Ms, the ε-martensite is much more stable than above
Ms, and the some amount of ε-phase already exists in the ini-tial microstructure. This difference does not change the cyclic deformation behavior, namely, initial hardening followed by a plateau. However, the stress level of the plateau continuous-ly increases, when deformation temperature is decreased across Ms.
The most plausible mechanism responsible for the initial hardening is the cyclic-deformation-induced martensitic transformation. Irrespective of the deformation temperature, the cyclic stress is saturated above 100 cycles, where the
ε-martensite becomes dominant, and further cyclic deforma-tion may be implemented by plastic deformadeforma-tion of the
ε-martensite. The higher stress level inherent to the lower temperatures is a normal temperature response of the stresses required for the plastic deformation of the ε-phase either by slip or twinning.
The features of fracture surface in this temperature range represent brittle characteristic as the crack propagations on prism planes (fluting) and on the γ/ε interfaces (quasi-cleav-age). In spite of the brittle characteristics, the Nf increases with increasing deformation temperature. The reversible mar-tensitic transformation between the γ- and ε-phases is a pos-sible reason for the improved Nf values. The reverse marten-sitic transformation of the tension- or compression-induced
ε-martensite is reported to occur when the deformation direc-tion when the deformadirec-tion direcdirec-tion is inversed, from tension to compression, or compression to tension. Such reversible microstructural changes accompanying the back-and-forth movement of partial dislocations may suppress the local ac-cumulation of dislocations and delay the progress of the fa-tigue.
4.1.2 Cyclic deformation of the γ-phase with low stack-ing fault energy
Above Md (range III), the γ → ε martensitic transformation does not occur, and the cyclic deformation is governed by plastic deformation of the γ-austenite. It should be noted that the Nf value is still large at 473 K that is about Md where the
ε-martensite fraction in the fatigue fractured specimen is neg-ligibly small. This suggests that the extended dislocations alone can improve the Nf even without forming the ε -marten-site, as long as the dissociation width of the moving partial dislocations is sufficiently wide.
The significant initial hardening shown in this temperature range III is ascribed to increase in dislocation densities. The
following softening stage implies the existence of some re-laxation mechanism associated with rearrangement of dislo-cation structures9). The specimen deformed at 473 K exhibits the secondary hardening stage and longer Nf than the speci-men deformed at 523 K that failed without secondary harden-ing stage. Note that the former shows much lower cyclic stresses than the latter in spite of lower deformation tempera-ture. This is attributable to the extension of dislocations that is likely to make the back-and-forth movement of dislocation under cyclic loading reversible and confined on an identical
{111} planes without cross slips.
4.1.3 Cyclic deformation at between Msσ and Md In the temperature range II (Msσ < T < Md), the ε -marten-site still forms during cyclic deformation, but the contribution of the γ dislocation glide increases than in the lower tempera-ture range I. The growth of the ε-martensite is significantly suppressed compared with the lower temperatures. There are two possible reasons realizing the superior Nf values in this temperature range. Firstly, the γ- and ε-phase stabilities are close to each other in this temperature range, and it is consid-ered that reversible two-way martensitic transformations be-tween the γ- and ε-phases can easily occur. Secondly, the SFE of the remaining γ-phase is also lower than that in the higher temperature range III, and thus the back-and-forth movement of the extended dislocations is more strongly confined on an identical slip plane. In both cases, partial dislocations move in the most reversible manner among all the testing tempera-tures. The moderate cyclic hardening is observed and no sig-nificant softening stage appears in this temperature range. It implies a slow change in the microstructure, namely, a slow increase in the volume fraction of the ε-martensite, and insig-nificant development of the rearranged dislocation struc-tures9).
Both ductile and brittle features are observed in fracture surface patterns, which are different from either of higher or lower temperature ranges. The quasi-cleavage surface and flutings characterizing the brittle crack propagation along the
γ/ε interfaces and through the ε-phase are also observed, but their area fractions are significantly reduced. The dimples and striations indicating ductile fracture in the remaining γ-phase also appear, occasionally. These microstructural and fracto-graphic characteristics suggest that the coexistence of the re-versible two-way martensitic transformation that was dis-cussed in Subsection 4.1.1 and the extended dislocation glide that was discussed in Subsection 4.1.2 should cause the high-est Nf values in this temperature ranges.
We can thus point out two possible causes for the improved
Nf: the thermodynamic balance between the two phases and wide extension of the dislocations. A question arises from this discussion; whether the two-way transformation has any pos-itive effect on Nf or merely occur as a result of wide extension of dislocations. Recently, Li et al.16) reported that the ε -mar-tensite is formed at around propagating fatigue cracks and discussed its possible effects on the crack growth suppres-sion. Further investigation in this aspect is crucially import-ant.
4.2 Equivalence between temperature and chemical composition
nant plastic deformation mechanism. The Fe-30Mn-4Si-2Al (x = 2) and Fe-30Mn-3Si-3Al (x = 3) are transformation-/
twinning-induced plasticity (TRIP/TWIP) steels, which ex-hibit the martensitic transformation and mechanical γ -twin-ning as the secondary deformation mechanisms following the preceding dislocations glide. With increasing Al content, the
γ-austenite is more stabilized with respect to the ε-martensite and the SFE of the austenite increases. The highest Nf of ap-proximately 8000 cycles was obtained at room temperature in the Fe-30Mn-4Si-2Al alloy subjected to LCF at the total strain range of 0.0210) that is identical to the present strain range. The Fe-30Mn-4Si-2Al alloy exhibited the cyclic defor-mation-induced ε-martensite and glide of extended disloca-tions, similar to the present alloy deformed at 423 K. The al-loys with lower Al concentrations (x < 2) showed more pronounced cyclic-deformation-induced martensitic transfor-mation, and Nf decreased, similar to the present alloy de-formed at lower temperature range I. The alloys with higher Al concentrations (x > 2) showed no ε-martensite, and Nf de-creased with increasing Al concentration, as in the present alloy deformed in higher temperature range III.
For both of ε-martensitic transformation and the disloca-tion extension, the SFE is the critical parameter to predict the deformation characters. In low-SFE FCC metals, dislocations are easily extended into a couple of partial dislocations and stacking fault forms in between them, and the width of the extension increases with decreasing SFE. Recently, the value of SFE is also used as a measure for predicting the deforma-tion mode operated under tensile load among γ → ε marten-sitic transformation, mechanical γ-twinning, and extended dislocation glide, all of which involve regularly or irregularly integrated motion of the units of partial dislocations-stacking fault as an elementary process. Allain et al.17) reported SFE dependence of deformation modes in Fe-22Mn-0.6C alloy.
ε-martensitic transformation only occurs for SFE of Γ < 18 mJm−2, while mechanical twinning takes place for 12 mJm−2 < Γ < 35 mJm−2. Because the stacking fault is re-garded as the thin ε-phase with two {111} atomic layers, SFE is obtained by calculating the Gibbs s free energy difference between the γ- and ε- phases and the interfacial energy as follows.
Γ=2ρ·∆Gγ→ε+2σ18)
Where ρ is the molar curface density along {1 1 1} planes, ∆Gγ→ε is the difference in molar Gibbs s energy between the
γ-austenite to ε-martensite phase,and σ is the interfacial en-ergy per unit area of the phase boundary. The SFE is com-monly used as a scale for predicting both the deformation mode selection and the extension width of dislocations in the
γ-austenite.
In this section, the SFE is calculated for the Fe-28Mn-6Si-5Cr alloy at various temperatures and Fe-30Mn-(6-x)Si-xAl
alloys with various compositions, and the equivalence be-tween the temperature and the composition, and the SFE de-pendence of the deformation mode selection rule are verified in a quantitative manner.
Various parameters for the Gibbs free energy difference be-tween the γ-and ε-phases and the SFE are proposed for vari-ous alloy systems17–20). In the present research, SFE calcula-tion method in high-Mn steels including Cr developed by Curtze et al.21) is applied to both of the Fe-28Mn-6Si-5Cr al-loy at various temperatures and the Fe-Mn-Si-Al alal-loys with different compositions at room temperature.
Figure 11(a) indicates the values of SFE as a function of temperature calculated for the Fe-28Mn-6Si-5Cr alloy (223 ≤
T(K) ≤ 523). Figure 11(b) indicates the values of SFE as a function of Al concentration calculated for
Fe-30Mn-(6-x)Si-xAl alloy (0 ≤ x (mass%) ≤ 4). The SFE of Fe-28Mn-6Si-5Cr alloy increases with temperature, from Γ = 2.7 mJm−2 at 298 K to Γ = 26.4 mJm−2 at 523 K. SFE of Fe-30Mn-(6-x) Si-xAl alloys increases with Al content, from Γ = 5.6 mJm−2 at 1 mass% to Γ = 28.8 mJm−2 at 4 mass%. These results in-dicate an equivalency of SFE dependence temperature and chemical composition. This fact permits to discuss the varia-tion of fatigue life with temperature and with chemical com-position using the value of SFE as a common scale.
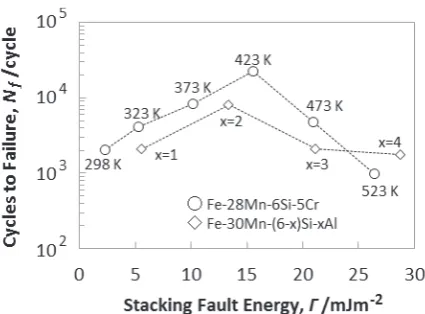
[image:7.595.331.520.67.404.2]Figure 12 shows the relationship between fatigue life and the SFE of the Fe-28Mn-6Si-5Cr alloy with different defor-mation temperatures and the Fe-30Mn-(6-x)Si-xAl alloys Fig. 11 (a) Calculated SFE as a function of temperature in
with different compositions, respectively. Maximum fatigue life of the Fe-28Mn-6Si-5Cr alloy is obtained at 15.5 mJm−2. On the other hand, the maximum Nf of Fe-30Mn-(6-x)Si-xAl alloys are obtained at 13.4 mJm−2. Accordingly, the equiva-lency between temperature and composition in terms of the optimum condition to improve the Nf is verified in a quantita-tive manner through calculating the SFE as the common scale. It should be noted that the best SFE values for improv-ing Nf obtained in this study calculation is Γ ≈ 15 mJm−2 that close to that proposed in the literature3), i.e., Γ ≈ 20 mJm−2.
5. Conclusions
(1) The temperature dependence of low-cycle fatigue life and the corresponding cyclic hardening/softening behavior can be classified into three temperature ranges with re-spect to the martensitic transformation temperatures. (2) Below Msσ, cyclic deformation-induced martensitic
transformation and the plastic deformation of the ε -mar-tensite cause the initial hardening followed by a plateau. In spite of the brittle crack propagation along the γ/ε in-terfaces and inside the ε-martensite, the alloy is resistant against the low-cycle fatigue due to the reversible two-way martensitic transformation, which improves Nf as the deformation temperature increase.
(3) Above Md, no ε-martensite is formed and the plastic de-formation of the γ-phase dominates the cyclic deforma-tion. With decrease in deformation temperature Nf in-creases owing to the wider dissociation width of dislocations that promote the reversible back-and-forth movement of dislocations.
(4) In the medium temperature range between Msσ and Md,
the highest fatigue life of approximately 22,400 cycles was obtained in the alloy deformed at 423 K at the total strain range of 0.02. The back-and-forth movement of partial dislocations associated both with the reversible martensitic transformation and the glide of extended dis-location is responsible for the superior Nf. The cyclic hardening is gradual and monotonic due to delayed growth of the cyclic-deformation-induced ε-martensite. (5) The stacking fault energy of the Fe-28Mn-6Si-5Cr
calcu-lated by thermodynamic parameters proposed by Curtze
et al. is 15.5 mJm−2 at 423 K where the highest Nf is ob-tained. The temperature dependence of the Nf and the corresponding LCF characteristics of the present alloy agree well with the composition dependence of those in the Fe-Mn-Si-Al alloys.
(6) The best condition for improving the Nf can be expressed as the deformation between Msσ and Md. Possible reasons
for this are thermodynamic balance between the γ- and
ε-phases that promotes the cyclic two-way transforma-tion and/or the wider extension of dislocations that en-hances the reversibility of the back-and-forth movement of partial dislocations.
Acknowledgments
A Part of this work was supported by Grant-in-Aid for Sci-entific Research Fund (A) (No. 25249099) from the Japan Society for the Promotion of Science (JSPS). We would like to acknowledge the Materials Manufacturing and Engineer-ing Station, NIMS, for the materials processEngineer-ing. We also would like to express our sincere gratitude to Prof. Kaneaki Tsuzaki, Kyushu University, for his continuous encourage-ment as well as the valuable comencourage-ments on the manuscript.
REFERENCES
1) A. Sato, E. Chishima, K. Soma and T. Mori: Acta Metall. 30 (1982) 1177–1183.
2) T. Maruyama, T. Kurita, S. Kozaki, K. Andou, S. Farjami and H. Kubo:
Mater. Sci. Technol. 24 (2008) 908–912.
3) T. Sawaguchi, I. Nikulin, K. Ogawa, K. Sekido, S. Takamori, T. Maruyama, Y. Shiba, A. Kushibe, Y. Inoue and K. Tsuzaki: Scr. Mater.
99 (2015) 49–52.
4) T. Sawaguchi: Ferrum 20 (2015) 96–102 (In Japanese). 5) L. Remy and A. Pineau: Mater. Sci. Eng. 28 (1977) 99–107.
6) O. Bouaziz, S. Allain, C.P. Scott, P. Cugy and D. Barbier: Curr. Opin. Solid State Mater. Sci. 15 (2011) 141–168.
7) M. Andersson, R. Stalmans and J. Agren: Acta Mater. 46 (1998) 3883– 3891.
8) G.B. Olson and M. Cohen: J. Less-Com Met. 28 (1972) 107–118.
9) M.S. Pham, C. Solenthaler, K.G.F. Janssens and S.R. Holdsworth: Ma-ter. Sci. Eng. A 528 (2011) 3261–3269.
10) S. Takaki, T. Furuya and Y. Tokunaga: ISIJ Int. 30 (1990) 632–638.
11) I. Nikulin, T. Sawaguchi and K. Tsuzaki: Mater. Sci. Eng. A 587 (2013) 192–200.
12) A.L. Pilchak and J.C. Williams: Metall. Mater. Trans., A Phys. Metall. Mater. Sci. 41 (2010) 22–25.
13) Mirko Klesnil and Petr Lukas: Fatigue of Metallic Materials (Institute of Physical Metallurgy of the Czechoslovak Academy of Sciences, Brno, Czechoslovakia, 1992) pp. 92–97.
14) T. Sawaguchi, P. Sahu, T. Kikuchi, K. Ogawa, S. Kajiwara, A. Kushibe, M. Higashino and T. Ogawa: Scr. Mater. 54 (2006) 1885–1890.
15) T. Sawaguchi, L.-G. Bujoreanu, T. Kikuchi, K. Ogawa, M. Koyama and M. Murakami: Scr. Mater. 59 (2008) 826–829.
16) H. Li, M. Koyama, T. Sawaguchi, K. Tsuzaki and H. Noguchi: Philos. Mag. Lett. 95 (2015) 303–311.
17) S. Allain, J.-P. Chateau, O. Bouaziz, S. Migot and N. Guelton: Mater. Sci. Eng. A 387–389 (2004) 158–162.
18) G.B. Olson and M. Cohen: Metall. Trans. A. 7 (1976) 1915–1923.
19) L. Rémy and A. Pineau: Mater. Sci. Eng. 36 (1978) 47–63.
20) O. Grassel, G. Frommeyer, C. Derder and H. Hofmann: J. Phys. IV C5 (1997) 383–388.
[image:8.595.62.275.67.224.2]21) S. Curtze, V.-T. Kuokkala, A. Oikari, J. Talonen and H. Hanninen: Acta Mater. 59 (2011) 1068–1076.