Proceedings of the Ninth Pacific Conference on Earthquake Engineering Building an Earthquake-Resilient Society 14-16 April, 2011, Auckland, New Zealand
Bridge Structure Impact Modelling
Gregoire Labrosse, Andrej Kujikis, J. Geoff Chase, Gregory Cole, Gregory A. MacRae and Geoff W. Rodgers
University of Canterbury, Christchurch, New Zealand
ABSTRACT: The response of single storey structures subject to earthquake loading in which impact may occur between the structures is investigated. These structures represent bents of a bridge which may have different masses strengths and stiffness and an expansion joint where deformation may occur. The likelihood of increase in response due to impact was quantified in a probabilistic sense for different normalized distances between the structures. The increase of displacement relative to the damage on the structure is computed for ranges of periods. The effect of including a high-force-to-volume (HF2V) lead dissipater between the parts of the bridge is then considered and it is shown that the device does not significantly affect the response in this case.
1 INTRODUCTION
Expansion joints between bridge sections help mitigate internal forces caused by thermal expansion and contraction. However, these gaps can lead to relative displacements and create impact or pounding hazards during earthquakes as a result of increased demands and damage resulting from collisions between different parts of the structure. Dramatic examples of catastrophic pounding damage have occurred between adjacent buildings in highly urbanized areas as shown in the 1985 Mexico and the 1995 Kobe earthquakes. A number of studies have been conducted to look at pounding effects. Many of these have been summarised by Cole (2010), Dimitrakopoulos et al. (2009) and Chouw and Hao (2009),but information is generally not available to answer the following questions:
1) For oscillators a certain distance apart, what is the probability of impact over suites of probabilistically scaled ground motions? What is the influence of the oscillators periods?
2) What is the probability that displacements will increase as a result of impact?
3) How far apart should structures be placed to minimize or avoid increased displacements from impact?
In addition, the use of novel seismic dissipaters, such as the HF2V dissipaters (Rodgers et al. 2008), may possibly influence the effect of the response, and this leads to a fourth question:
4) What is the effect of lead dissipaters placed between the decks?
This paper describes in initial study used to study these questions to develop answers in a useful form for designers.
2 MODELLING
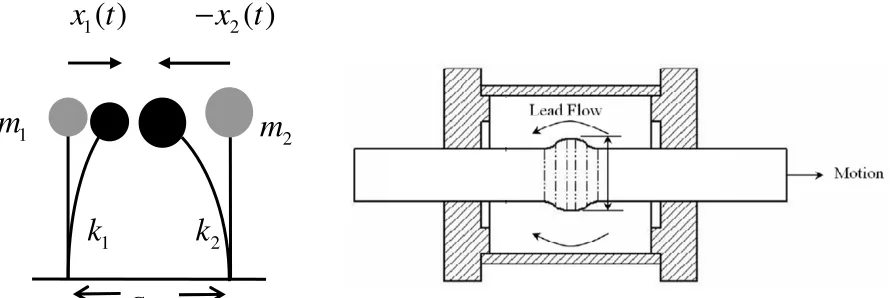
To model impact, two single-degree-of-freedom oscillations are used, as shown in Figure 1. The oscillators are decoupled with their own mass, stiffness, damping, and hence period. Both oscillations have the same height so collisions only occur between the structures at the floor level. They are subjected to the same seismic ground motions because they are located close to each other. The gap distance, λ, must be greater than x1 - x2 if impact does not occur, where x1 and x2 are the displacements
of the oscillators. For example, if λ = 100mm, and x1 = 80mm, and x2 = -20mm, then impact will just
Figure 1. Oscillator used for impact study Figure 2. Bulged HF2V device (Rodgers et al. 2008)
Pre and post impact behaviour occurs when x1 < x2 + λ. Equations 1a and 1b modelling this response
where k1 and k2 are the oscillator stiffnesses, m1 and m2 are their masses as defined in Figure 1. In this
case the system is decoupled. The Newmark-beta constant average acceleration numerical integration is utilized to model these responses.
1 1 1 1 1 1 1
2 2 2 2 2 2 2
eq
eq
m x
c x
k x
m x
m x
c x
k x
m x
+
+
= −
+
+
= −
&&
&
&&
&&
&
&&
(1)When impact occurs the two masses touch. Stereomechanics can be used to model the response (Cole 2010). A coefficient of restitution, e, can be used to describe the energy dissipated in the collision. If no energy is dissipated in heat or permanent deformation, then the collision is fully elastic and e = 1. A coefficient of restitution equal to zero is for a fully plastic collision. In reality, the coefficient of restitution is sensitive to the prior-impact velocity and tends to range between 0.65 and 0.8 (Jankowski, 2010). Conservation of momentum and kinetic energy enables the post-impact velocities of the oscillators to be calculated according to Equation 2 where x x& &1, 2 are the velocities before the
impact, and x&'1 and x&'2 are just after impact. In this pilot study, e = 1 is used. This is generally
conservative.
(
)
2(
)
1 1 1 2
1 2
' 1 m
x x e x x
m m
= − + −
+
& & & &
(
)
1(
)
2 1 1 2
1 2
' 1 m
x x e x x
m m
= + + −
+
& & & & (2)
Behaviour during impact the impact force, Finc, over a timestep, dt, can be found from conservation of
momentum according to Equation 3. dt
F x x
m(&′− &)= inc (3) So the equations of motion are coupled when impact occurs (x1≥x2+
λ
) and are defined:1 1 1 1 1 1 1
2 2 2 2 2 2 2
eq inc
eq inc
m x
c x
k x
m x
F
m x
c x
k x
m x
F
+
+
= −
−
+
+
= −
+
&&
&
&&
&&
&
&&
(4)The response can be normalized by defining a gap ratio, GR, as the gap, λ (or GAP), divided by the sum of the spectral displacements of both oscillators, Sd1 and Sd2. If GR > 1.0 then there is no
possibility of collision. The probability of impact increases as the gap ratio decreases. 2 1 d d S S GAP GR +
= (5) Gap 2
m
2k
1k
1
( )
x t
−
x t
2( )
1
The analyses described in this paper used a mass ratio (m1/m2) equal to 1, period ratios (T1/T2) of 0.1,
0.5, 1.5 and 10, and an initial stiffness proportional damping ratio of 5%. The structures were considered to respond elastically.
The earthquake records utilized are three Los Angeles suites from the SAC Steel Project. The low, medium and high suites represent ground motions having probabilities of exceedance of 50% in 50 years, 10% in 50 years and 2% in 50 years [19]. Hence, these suites represent equally likely events spanning a range of likelihood of occurrence, and thus a range of magnitudes. Each record was run in both directions to remove directional effects. Gap ratios ranged from 0.1 to 1.0 in increments of 0.1. The following were obtained for each mass ratio over each suite (i.e. low, medium and high) of ground motions:
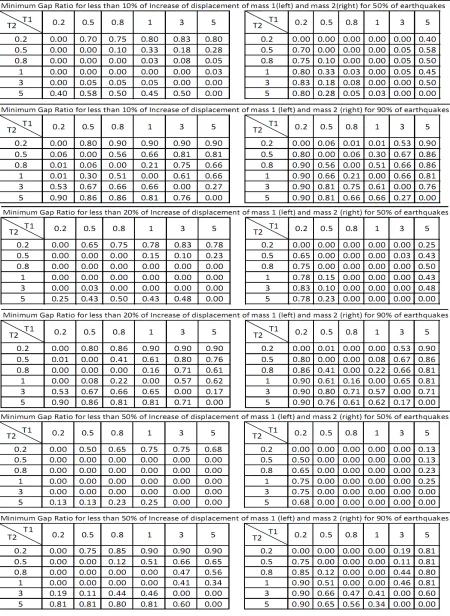
• Minimum gap ratio for less than a specified probability (i.e. 10%, 20%, or 50%) of increase for a specified percentage (i.e. 50% or 90%) of earthquakes.
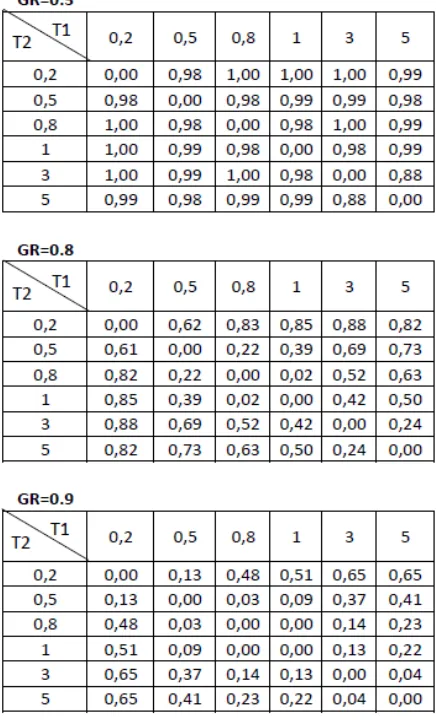
• Probability of impact for gap ratios of 0.5, 0.8 and 0.9 over a range of (T1, T2) values and a mass
ratio of 1 (Table 3).
The HF2V device is a passive actuator, utilizing lead-extrusion to dissipate energy as shown in Figure 2. Yielding of the lead dissipates kinetic energy from the bulged shaft into strain energy and heat within the actuator. The elastic-plastic deformation of the lead exhibited by this actuator produces an almost ideal square hysteretic loop as shown experimentally by Rodgers et al. (2008). The stiffness of the devices is sensitive to their connections to the frame. To numerically consider this effect in the analyses an expression for the device force output as a function of both the shaft stiffness and relative velocity between two frames. The device force FD is hence calculated using Equations (6) and (7)
where ∆x = (x2 – x1), the relative displacement between the masses; y is the displacement across the device; ∆t = numerical integration time step; Cα = the device coefficient; α = the damper velocity
exponent kept constant at 0.012 (Rodgers et al. 2008, 2009, 2010); fD = flexibility of the connecting
shaft or (1/K) where K is the effective stiffness of the connections taken as EA/L where E is the shaft elastic modulus, A is the area of the shaft and L is the shaft length. The HF2V device was designed using the procedure of Rodgers et al. (2008) with a nominal shaft diameter of 30mm.
(6)
(7)
Assuming a length of 0.5m, the flexibility, fD is 3.4x10⁻⁹ m/N. The device strength is related to the
device coefficient Cα. In this study, Cα is a calculated as per Equation 8 as a function of the seismic
weight of the structure to which it is attached.
(8)
HF2V dampers are sized according to relative mass fraction, typical values ranging in the order of 1-10% of the smaller of the masses (Trochalakis et al., 2000). For the purpose of this study, the masses of both frames are identical, and kept constant. Hence, using a set value of mass fraction of the device models a damper of set characteristics across all simulations. A model showing the bridge columns, the gapping, the energy dissipation and the system is given in Figure 3.
3 DYNAMIC BEHAVIOUR
Figure 4 shows the responses of two oscillators with impact for one record. Here there are 4 major impacts, and the 2nd and 4th impacts seem to occur at the high velocity causing the oscillators bounce off each other.
0 5 10 15 20 25 30 35 40 -0.8
-0.6 -0.4 -0.2 0 0.2 0.4 0.6 0.8
Time (s)
D
is
p
la
ce
m
e
n
t
(m
)
0 5 10 15 20 25 30 35 40
-1500 -1000 -500 0 500 1000 1500
Im
p
u
ls
e
(
N
.s
)
Oscillator 1 Oscillator 2 Impulse
[image:4.595.76.527.143.294.2]shows the probability of at least one impact. It may be seen that the probability of impact increases for smaller gap ratios. Also, there is no impact when T1 = T2 because the oscillators are in phase. In general, the probability increases as the T1 becomes more different from T2. It may also be seen that the tables are symmetrical about the diagonal. This is because earthquake records in both directions were considered.
Figure 3. Mechanical model of System (Kujikis, 2010) Figure 4. Displacements and impact
[image:4.595.146.364.349.709.2](T1=2s, T2=3s, M1/M2=1, e = 1, ζζζζ = 0.05, LA04)
Table 1. Probability of at least one impact (60 earthquakes in both directions, M1=M2=1000kg, 0.05
ζ
= )Table 2 shows the minimum gap ratios to provide a specified level of confidence that the increase in response of an oscillator is less than a specified amount. This has been computed for different T1 and T2. It may be seen again that when T1 = T2 there is not impact, and greater increases tend to occur when as the periods differ. It may be seen that the left and right tables are transposes of each other
d δ
M1 M2
K1 K2
x1 x2
because earthquake waves are considered from both directions. The analyses shown are for a mass ratio of 1.0, but have also been conducted for other mass ratios (e.g. Labrosse, 2010). The significance of the values in the table can be described by an example.
Consider two bridges with a mass ratio of 1.0, and periods T1 of 1.0s and T1 = 0.2s due to the different stiffnesses of the columns beneath them. The resulting spectral displacements for these periods are 200mm and 60mm from the design level response spectra considered. To ensure an increase of no more than 10% in 50% of the time, the required gap ratio must be 0.80. This means a gap of 208mm is required. To have an increase of no more than 10% with 90% confidence , the required gap ratio must be 0.90. This means a gap of 234mm is required. As expected, a greater gap is needed to have a higher degree of confidence that there will be less than a 10% increase in
displacement. The table can also be used with a higher degree of confidence required for a design level earthquake than for a maximum credible earthquake. This type of information is useful for designers. For a specific gap, the likely change in response can also be obtained. This is found for the medium suite of records based on Table 3. Using the example above, with a mass ratio of 1.0, and periods T1 of 1.0s and T1 = 0.2s, Oscillator 1 displacement will increase by a median value of 51% from 200mm to 302mm, but Oscillator 2 displacement decreases by a median value of 4% from 60mm to 57.6mm. 4 EFFECT OF LEAD DISSIPATORS
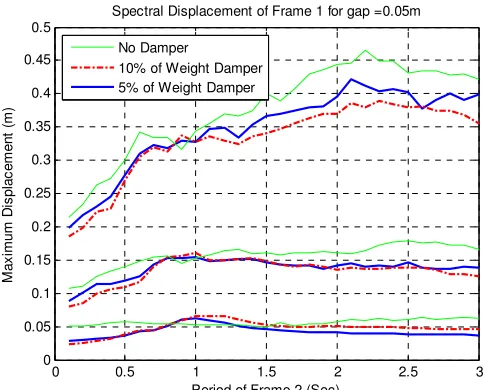
The effectiveness of a HF2V dissipater in reducing the structural response of the bridge was investigated. It was considered that by placing the dissipater/damper between the ground and the structure the response was sure to significantly decrease. Therefore, in this study the dissipater was placed between the masses of the two oscillators. This is perhaps an unusual location to place the oscillator, however, it was considered to be interesting. However, the response of Frame 2, which is given periods from 0.1 and 3.0 seconds in 0.1 second steps is not very significant as shown in Figure 5. The period of Frame 1 was kept constant at 0.8s. It may be seen that the dissipater became most effective when the periods of the frames were most dissimilar.
5 CONCLUSIONS
A study was conducted to evaluate the effect of impact on the response of bridges structures. An impact coefficient of restitution of unity was conservatively considered. It was found that:
1. A gap ratio is defined to normalize the gap between masses with spectral displacements of oscillators. The probability of impact was quantified for a range of oscillators with different gap ratios, periods, and masses. The probability tended to increase in the oscillator with longer period and decrease in the oscillator with shorter period. This tendency occurred with greater period differences. When the periods of both oscillators were identical, there was no impact. 2. The gap ratio to ensure that the response did not increase by more than a specified percentage was quantified with a specified level of confidence was quantified. An example was provided on how to use this information.
3. For a specific gap ratio, the median increase in response was quantified.
Table 3. Median of displacement change (gap ratios=(0.2, 0.5, 0.8), M1=M2=1000kg, e=1, 0.05
[image:7.595.73.528.102.568.2]0 0.5 1 1.5 2 2.5 3 0
0.05 0.1 0.15 0.2 0.25 0.3 0.35 0.4 0.45 0.5
Spectral Displacement of Frame 1 for gap =0.05m
Period of Frame 2 (Sec)
M
a
x
im
u
m
D
is
p
la
c
e
m
e
n
t
(m
)
No Damper
[image:8.595.177.421.71.266.2]10% of Weight Damper 5% of Weight Damper
Figure 5. Effect of HF2V Damper on the Peak Response – 16th, 50th and 84th percentiles
ACKNOWLEDGEMENTS:
The work presented in this paper is undertaken as part of the New Zealand Foundation for Research in Science and Technology Natural Hazards Platform on Low Damage Bridges. The authors gratefully acknowledge this funding. All opinions expressed are those of the authors alone.
REFERENCES:
Chouw, N., Hao, H. Seismic design of bridge structures with allowance for large relative girder movements to avoid pounding, Bulletin of the New Zealand Society for Earthquake Engineering 42(2): 2009, pp75-85. Cole, G.L., Dhakal R.P., Carr A.J. and Bull D.K., “Building pounding state of the art: Identifying structures
vulnerable to pounding damage”, NZSEE Conference, 2010 ; Session 4B, Paper 11.
Dimitrakopoulos, E., Makris, N. and Kappos, A. J. Dimensional analysis of the earthquake-induced pounding between adjacent structures. Earthquake Engineering & Structural Dynamics 38(7): 2009, 867-886.
Jankowski, R., “Experimental study on earthquake-induced pounding between structural elements made of different building materials”, EARTHQUAKE ENGINEERING AND STRUCTURAL DYNAMICS, Wiley InterScience 2009; pp344.
Labrosse G. Bridge Collisions During Earthquake Excitation, Report, University of Canterbury, 2009. Kijikis A. HF2V Devices in Bridges, Report, University of Canterbury, 2010.
Rodgers, G. W., Solberg, K. M., Chase, J. G., Mander, J. B., Bradley, B. A., Dhakal, R. P., Li, L. “Performance of a damage-protected beam-column subassembly utilizing external HF2V energy dissipation devices”, Wiley InterScience, 2008.
Rodgers, G. W., “Next Generation Structural Technologies: Implementing High Force-To-Volume Energy Absorbers. University of Canterbury, 2009;. pp.18
Rodgers, G. W., Mander, J. B., Chase, J. G, “Semi-Explicit Rate-Dependent Modeling of Damage Avoidance Steel Connections Using HF2V Damping Devices” Earthquake Engineering & Structural Dynamics, 2010. SAC. The SAC Steel Project: Seismic Design Criteria for Steel Moment Frame Construction, 1999
Sommerville, P., Smith, N., Punyamurthula, S., Sun, J., “Development of ground motion time histories for phase II of the FEMA/SAC steel project. SAC Background Document Report SAC/BD-97/04,1997