ORIGINAL RESEARCH
BRAIN
Individual Classification of Mild Cognitive Impairment
Subtypes by Support Vector Machine Analysis of
White Matter DTI
S. Haller, P. Missonnier, F.R. Herrmann, C. Rodriguez, M.-P. Deiber, D. Nguyen, G. Gold, K.-O. Lovblad, and P. Giannakopoulos
EBM 2
ABSTRACT
BACKGROUND AND PURPOSE: MCI was recently subdivided into sd-aMCI, sd-fMCI, and md-aMCI. The current investigation aimed to discriminate between MCI subtypes by using DTI.
MATERIALS AND METHODS: Sixty-six prospective participants were included: 18 with sd-aMCI, 13 with sd-fMCI, and 35 with md-aMCI. Statistics included group comparisons using TBSS and individual classification using SVMs.
RESULTS:The group-level analysis revealed a decrease in FA in md-aMCI versus sd-aMCI in an extensive bilateral, right-dominant network, and a more pronounced reduction of FA in md-aMCI compared with sd-fMCI in right inferior fronto-occipital fasciculus and inferior longitudinal fasciculus. The comparison between sd-fMCI and sd-aMCI, as well as the analysis of the other diffusion parameters, yielded no significant group differences. The individual-level SVM analysis provided discrimination between the MCI subtypes with accuracies around 97%. The major limitation is the relatively small number of cases of MCI.
CONCLUSIONS: Our data show that, at the group level, the md-aMCI subgroup has the most pronounced damage in white matter integrity. Individually, SVM analysis of white matter FA provided highly accurate classification of MCI subtypes.
ABBREVIATIONS:AD⫽Alzheimer disease; aMCI⫽amnestic MCI; FA⫽fractional anisotropy; MCI⫽mild cognitive impairment; md-aMCI⫽multiple domains MCI; sd-aMCI⫽single domain amnestic MCI; sd-fMCI⫽single domain frontal MCI; SVM⫽support vector machine; TBSS⫽tract-based spatial statistics
A
lthough there are currently no proven disease-modifying treatments for AD, several promising candidates have been evaluated to date.1,2However, recent studies pointed to theirlim-ited performance in patients with clinically overt dementia.3,4To
date, the identification of patients at high risk for rapid cognitive decline is considered a prerequisite for future curative strategies in AD.
MCI represents a transition zone between normal aging and very early dementia, characterized by selective memory deficits associated, or not, with other cognitive dysfunctions.5It was
orig-inally conceived as a functionally nondisabling amnestic disorder that was later expanded to include essentially any form of cogni-tive complaints.6Based on the patterns of neuropsychologic
def-icits, MCI was recently subdivided into sd-aMCI with isolated memory impairment; sd-fMCI, characterized by early deficits confined to executive functions; and md-aMCI, which displays widespread cognitive dysfunctions that affect memory and also language, attention, and/or visuospatial abilities. For instance, md-aMCI is thought to progress to clinically overt AD with an annual rate of 10%–15%,6,7whereas the other subgroups of MCI
may remain stable or evolve to other forms of dementia.8
Structural MR imaging was initially used to differentiate pa-tients with MCI from healthy controls in cross-sectional studies. Most earlier MR neuroimaging studies focused on the investiga-tion of gray matter using voxel-based morphometry9in MCI.10-15
A series of voxel-based morphometric studies revealed volume differences between patients with MCI and controls mainly dis-tributed within the precuneus and cingulate gyrus.16More
re-cently, several contributions on various neurodegenerative dis-eases reported that the changes in WM microstructure assessed with DTI may be a more sensitive parameter compared with gray matter data17-21for detecting mild structural changes occurring at
the early stages of the degenerative process. Applying DTI analyses Received March 5, 2012; accepted after revision April 22.
From the Service neuro-diagnostique et neuro-interventionnel DISIM (S.H., K-O.L.), Division of General Psychiatry (P.M., C.R., P.G.), Division of Neuropsychiatry (P.M., M.-P.D.) and Department of Internal Medicine, Rehabilitation, and Geriatrics (G.G., F.R.H.), University Hospitals of Geneva, Geneva, Switzerland; INSERM U1039, Fac-ulty of Medicine (M.-P.D.), La Tronche, France; Centre Diagnostic Radiologique Ca-rouge (D.N.), CaCa-rouge, Switzerland; and Division of Old Age Psychiatry (P.G.), Uni-versity of Lausanne School of Medicine, Lausanne, Switzerland.
Please address correspondence to Sven Haller, MD, MSc, Service neuro-diagnos-tique et neuro-interventionnel DISIM, Hoˆpitaux Universitaires de Gene`ve, Rue Ga-brielle Perret-Gentil 4, 1211 Gene`ve 14, Switzerland; e-mail: [email protected]
Indicates open access to non-subscribers at www.ajnr.org EBM
with voxelwise TBSS,22an increasing number of contributions
described the damage of long interhemispheric and intrahemi-spheric white matter tracts with homogeneously oriented fibers (ie, genu or splenium of the corpus callosum, superior longitudi-nal fasciculus, cingulus) and, more rarely, in frontal, parietal, and temporal white matter in patients with MCI compared with healthy controls.23-31
The biologic relevance of the description of MCI subtypes is still a challenging issue. In particular, it is unclear whether the neuropsychologic definition of these subtypes corresponds to dis-tinct patterns of brain compromise. Earlier studies focusing on brain atrophy patterns reported a predominant mesio-inferior temporal lobe involvement in sd-aMCI and progressive damage of other neocortical association areas in md-aMCI. Cases of nonamnestic MCI are thought to have increased vascular burden as well as focal atrophy of basal forebrain and hypothalamus.32-35
In contrast to gray matter, MR imaging investigations of WM integrity in MCI subtypes are still very rare.36-38They neither
included the whole spectrum of MCI subtypes nor explored the usefulness of DTI parameters on the individual classification of cases of MCI. We recently investigated FA patterns in prospec-tively documented patients with MCI compared with healthy controls and reported their use in the a priori identification of progressive MCI.30To explore the morphologic WM changes that
characterize each subtype of MCI, we assessed all DTI parameters and developed models of automatic individual classification in a community-based series of cases of aMCI, md-aMCI, and sd-fMCI. First, a group-level analysis using TBSS,22an improved
voxel-based technique with respect to spatial normalization, was performed to identify regions with altered white matter structure between groups. As discussed above, recent investigations imple-menting this technique in the domain of MCI23,24,28documented
the presence of reduced FA primarily in white matter tracts with homogeneously oriented fibers (ie, genu or splenium of the cor-pus callosum, superior longitudinal fasciculus, cingulus) and, more rarely, in frontal, parietal, and temporal white matter. How-ever, other studies led to negative data challenging this point of view.39While such group-level data are fascinating from a
re-search perspective, these cannot be applied in clinical neuroradi-ology for the diagnosis of individual patients. In addition to MCI subgroup comparisons, we report here an individual-level classi-fication analysis to explore the association between WM changes and MCI subtype by using SVM analysis.40The basic principle of
such pattern recognition analyses can be illustrated in the exam-ple of face recognition. A single feature, for examexam-ple, the nose, is generally not sufficient to detect an individual subject— even though the nose might show group differences, for example, be-tween females and males. In contrast, individual faces can be iden-tified by the combination of multiple features such as nose, ear, chin, eyebrow, and so on, even though each feature per se is not necessarily significantly different between groups (for a more de-tailed description of pattern recognition analyses, see Haller et al41). Originating from machine learning, this technique provided
individual risk scores for MCI conversion to AD on the basis of gray matter voxel-based morphometry16,42-45 and WM DTI
data.30In contrast to these studies that focused on the
discrimi-nation between MCI versus controls, or stable versus progressive
MCI, this work aims to explore the neuroradiologic background of the previously cited subgroups of MCI and to provide MR imaging tools for the individual classification of MCI subtypes.
MATERIALS AND METHODS
ParticipantsAfter formal approval by the local ethics committee, informed written consent was obtained from all participants before inclu-sion in this study. Sixty-six right-handed elderly subjects (66.2⫾ 5.0 years; 37 women) were recruited by using announcements in local newspapers. All participants with MCI had normal or cor-rected-to-normal visual acuity, and none reported a history of major medical disorders (cancer, cardiac illness), sustained head injury, psychiatric or neurologic disorders, or alcohol or drug abuse. All participants characterized by regular use of psychotro-pics, stimulants, and beta blockers, as well as those with severe physical illness that precluded the participation in either phase of the project, were excluded. The education level was defined ac-cording to the Swiss scholar system, where level 1⫽less than 9 years (primary school), level 2⫽between 9 and 12 years (high school), and level 3⫽more than 12 years (university).
All subjects were screened with the Mini-Mental State Exam-ination,46the Lawton Instrumental Activities of Daily Living,47
and the Hospital Anxiety and Depression Scale.48In addition,
extensive neuropsychologic testing was performed on the basis of fully validated tools, with normative age- and education-cor-rected norms in Europe. It included attention (Wechsler Adult Intelligence Scale-Revised Code, Trail-Making Test A), working memory (verbal: Forward Digit Span Test;49visuo-spatial: Corsi
Block-Tapping Test50), episodic memory (verbal: Buschke
Dou-ble Memory Test 48 items;51 visual: Shapes Test52), executive
functions (Trail-Making Test A,53Verbal Fluency Test,54,55
Wis-consin Card Sorting Test56), language (Boston Naming Test57),
visual gnosis (Ghent Overlapping Figures Test58), and praxies
(ideomotor,59reflexive,60and constructional61tests). Global
cog-nitive function was assessed by the Clinical Dementia Rating scale.62Participants having a test score more than 1.5 standard
deviations below the age-appropriate mean in any of the above tests, and a Clinical Dementia Rating score of 0.5 but no dementia, were diagnosed with possible MCI.63Patients with MCI were
fur-ther divided into subtypes based on the extensive neuropsycho-logic testing, according to the criteria by Petersen and collabora-tors64as follows:
sd-aMCI: impaired memory function for age and education; decreased performance in the Buschke Double Memory Test 48 items.
sd-fMCI: impairment in a single cognitive domain other than memory, most commonly frontal alteration; decreased perfor-mance in the visual Shapes Test and/or the Trail Making Test B.
md-aMCI: multiple areas of cognitive impairment that fall outside of predicted norms, but none sufficiently severe to con-stitute dementia; decreased performance in the Wisconsin Card Sorting Test and/or the Trail-Making Test A and/or the Corsi Block-Tapping test.65
con-curred on the diagnosis. The final sample included 18 patients with sd-aMCI (65.8⫾5.4 years; 7 women), 13 patients with sd-fMCI (67.0⫾4.7 years; 8 women), and 35 patients with md-aMCI (66.2⫾5.23 years; 22 women). In agreement with community-based data in this field, there was a predominance of patients with md-aMCI in our sample. Moreover, sd-fMCI had a prevalence close to that of sd-aMCI.66
MR Imaging
MR imaging was performed on a 3T clinical routine whole-body scanner (Magnetom Trio; Siemens, Erlangen, Germany). We used a standard DTI sequence: 12 diffusion directions isotropi-cally distributed on a sphere, 1 B0 image with no diffusion weight-ing, 128⫻128⫻64 matrix, 1.8⫻1.8⫻2.0 mm voxel size, TE 76 ms, TR 7800 ms, 1 average, 2:48 minutes. Additional sequences (3D T1WI, 8:42 minutes; T2WI, 4:02 minutes; 3D FLAIR, 7:02 minutes) were acquired and analyzed to exclude brain pathology such as ischemic stroke, subdural hematomas, or space-occupy-ing lesions. In particular, white matter lesions were analyzed ac-cording to the Fazekas score.67
Statistical Analysis
Demographic and Clinical Data. Demographic and clinical char-acteristics, as well as neuropsychologic values were compared among groups by using the nonparametric Kruskal-Wallis group test. A pair-wise Dunn Multiple Comparison posttest was per-formed if overallPwas⬍.05.
DTI TBSS Analysis. Preprocessing of the FA data was carried out by using the standard procedure of TBSS, as described in detail before22,68in the FSL software package (http://www.fmrib.ox.
ac.uk/fsl),69notably obtaining a spatial normalization of the DTI
data, which is the basis for the following analyses. In principle, TBSS projects all subjects’ FA data onto a mean FA tract skeleton by using nonlinear registration. The tract skeleton is the basis for voxelwise cross-subject statistics and reduces potential misregis-trations as the source for false-positive or false-negative analysis results. The other DTI-derived parameters—longitudinal, radial, and mean diffusivity were analyzed in the same way by using spatial transformation parameters that were estimated in the ini-tial FA analysis. Voxelwise statistical analyses were corrected for multiple comparisons implementing threshold-free cluster en-hancement, considering fully correctedPvalues⬍.05 as signifi-cant.70Age and sex were used as nonexplanatory coregressors. We
used the Johns Hopkins University DTI-based white matter at-lases (http://www.fmrib.ox.ac.uk/fsldownloads/), which is dis-tributed in the FSL package, for anatomic labeling of the suprath-reshold voxels.
SVM Individual Classification Analysis. The individual SVM clas-sification analysis is, in principle, identical to a previous study.30
The individual classification was analyzed in the freely available WEKA software package (Version 3.6.1; http://www.cs.waikato. ac.nz/ml/weka/). It is based on the TBSS preprocessed data, which notably include a spatial normalization into Montreal Neurolog-ical Institute; standard space and a selection of the voxels of the white matter skeleton. This dataset contained 149,775 voxels.
Af-ter conversion of the preprocessed DTI FA data in a WEKA-com-patible data format, 3 separate analyses were performed for the differences between each pair of MCI subgroups. The analysis included 2 steps. In the first step, we performed a feature selection. The rationale behind this step is that not all voxels discriminate between groups. On the one hand, inclusion of nondiscriminative voxels results in overlapping features (or voxels), which reduces the accuracy of the classification. On the other hand, exclusion of discriminative features also reduces the accuracy of the classifica-tion. To identify the optimum number of voxels, we used the feature selection algorithm “RELIEFF.”71 In principle, this
method ranks features (or voxels) that distinguish most between classes. These are known as the relevant features. To avoid selec-tion-related bias, we selected the top 1000 features implementing 10 repetitions of a 10-fold cross-validation. This means that the data were divided into 10 parts; 9 parts were used for training and the remaining part was used for testing. This was repeated 10 times such that each part was once used for testing. To further reduce selection-related bias, we repeated this entire process 10 times. The second step consisted of the “actual” classification analyses for each comparison by using the SVM algorithm “se-quential minimal optimization”72 (distributed in the WEKA
package) with a radial basis function kernel.73We chose the
com-monly used radial basis function kernel, which nonlinearly maps samples into a higher dimensional space, because this kernel pro-vided slightly better classification accuracy in the present study and in a related previous study30than a linear kernel. Unlike
lin-ear kernels, radial basis function can handle the case when the relation between class labels and attributes is nonlinear. There are 2 parameters while using radial basis function kernels: C and GAMMA. GAMMA represents the width of the radial basis func-tion, and C represents the error/trade-off parameter that adjusts the importance of the separation error in the creation of the sep-aration surface. Based on our previous experience, GAMMA was iteratively explored from 0.01 to 0.09, with an increment of 0.01, while C was fixed to 1.00. Equivalent to the feature selection dis-cussed above, we implemented 10 repetitions of a 10-fold cross-validation to reduce selection-related bias. We present the average results of 10 repetitions of 10-fold cross-validations for the best parameter settings. The 3 MCI subgroups were pair-wise com-pared in 3 distinct SVM analyses.
RESULTS
Clinical DataThe distribution of MCI subtypes in our series was similar to that previously reported in community-based series.65,66Age, sex,
TBSS Group Differences
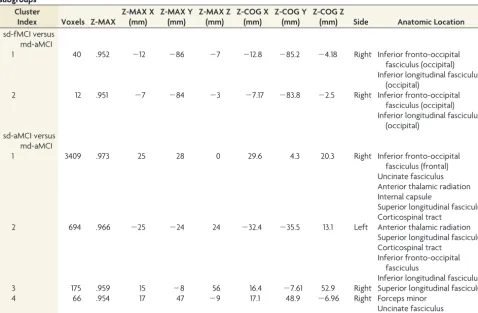
Compared with patients with sd-aMCI, those with md-aMCI had significantly reduced FA in a bilateral, right-dominant network, including right uncinate fasciculus, forceps minor, and internal capsule as well as bilateral inferior fronto-occipital fasciculus, an-terior thalamic radiation, superior longitudinal fasciculus, infe-rior longitudinal fasciculus, and corticospinal tract (Fig 1, Table 3). The inverse comparison and the analysis of longitudinal dif-fusivity, radial difdif-fusivity, or mean diffusivity yielded no signifi-cant differences. Importantly, md-aMCI displayed a signifisignifi-cant FA decrease in right inferior fronto-occipital fasciculus and infe-rior longitudinal fasciculus compared with sd-fMCI (Fig 1, Table 3). Again, the inverse comparison and the analysis of longitudinal diffusivity, radial diffusivity, or mean diffusivity yielded no signif-icant differences. The comparison between sd-aMCI and sd-fMCI yielded no significant differences.
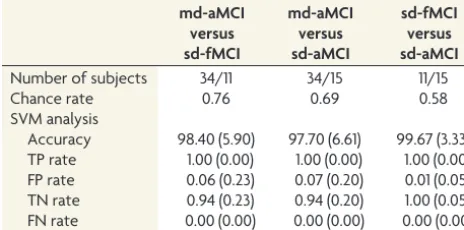
SVM Individual Classification Analysis
Confirming the strength of the association between these patterns of WM changes and MCI subtypes, SVM analysis of FA provided
a correct classification between the MCI subgroups with accura-cies of 98.40 (⫾5.90)% for md-aMCI versus sd-fMCI; 97.70 (⫾6.61)% for md-aMCI versus sd-aMCI; and 99.67 (⫾3.33)% for sd-fMCI versus sd-aMCI (Table 4).
DISCUSSION
Our investigation led to 2 main findings. Paralleling the multiple cognitive deficits that characterize their clinical expression, pa-tients with md-aMCI displayed a more widespread damage of long interhemispheric pathways, mainly in the right hemisphere compared with the single-MCI subgroups. The most relevant data concern the possibility of using the SVM technique to correctly classify each patient in the MCI subgroups with an accuracy higher than 95%.
DTI Parameters in MCI Subtypes
Among the different DTI parameters studied, only the FA corre-lated with the clinical diagnosis of MCI subtypes. Interestingly, the other DTI-derived diffusion parameters—longitudinal diffu-Table 1: Demographic and clinical characteristics
Variables sd-aMCI md-aMCI sd-fMCI
sd-aMCI Compared with md-aMCI
sd-aMCI Compared with sd-fMCI
md-aMCI Compared with sd-fMCI
Age (years) 65.8⫾5.4 66.2⫾5.2 67.0⫾4.7 .897 (NS) .445 (NS) .358 (NS)
Gender (F/M) 7/11 22/13 8/5 .100 (NS) .220 (NS) .933 (NS)
Education 2.6⫾0.6 1.9⫾0.7 1.9⫾0.8 .019 (NS) .120 (NS) .284 (NS)
MMSE 28.4⫾1.5 27.7⫾1.8 28.5⫾1.5 .115 (NS) .884 (NS) .141 (NS)
IADL 8.8⫾0.8 8.3⫾0.8 7.8⫾1.2 .018 (NS) .016 (NS) .310 (NS)
HAD (anxiety) 4.8⫾3.3 6.1⫾3.0 5.9⫾3.0 .147 (NS) .176 (NS) .726 (NS)
HAD (depression) 1.9⫾1.9 2.1⫾1.7 2.9⫾3.3 .645 (NS) .514 (NS) .382 (NS)
Fazekas score 0.7⫾0.5 1.1⫾0.9 1.2⫾1.0 .090 (NS) .851 (NS) .148 (NS)
[image:4.594.66.530.57.160.2]Note:—Data are presented as mean⫾SD. Demographic and clinical characteristics did not differ between the 3 groups. NS refers to the Dunn Multiple comparison test adjustedP-value threshold for each demographic and clinical characteristic. sd-fMCI,n⫽13; sd-aMCI,n⫽18; md-aMCI,n⫽35. HAD indicates Hospital Anxiety & Depression; IADL, Instrumental Activities of Daily Living; MMSE, Mini-Mental State Examination.
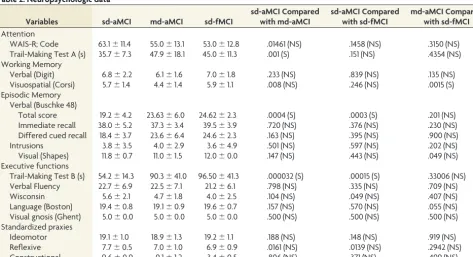
Table 2: Neuropsychologic data
Variables sd-aMCI md-aMCI sd-fMCI
sd-aMCI Compared with md-aMCI
sd-aMCI Compared with sd-fMCI
md-aMCI Compared with sd-fMCI Attention
WAIS-R; Code 63.1⫾11.4 55.0⫾13.1 53.0⫾12.8 .01461 (NS) .1458 (NS) .3150 (NS)
Trail-Making Test A (s) 35.7⫾7.3 47.9⫾18.1 45.0⫾11.3 .001 (S) .151 (NS) .4354 (NS) Working Memory
Verbal (Digit) 6.8⫾2.2 6.1⫾1.6 7.0⫾1.8 .233 (NS) .839 (NS) .135 (NS)
Visuospatial (Corsi) 5.7⫾1.4 4.4⫾1.4 5.9⫾1.1 .008 (NS) .246 (NS) .0015 (S)
Episodic Memory Verbal (Buschke 48)
Total score 19.2⫾4.2 23.63⫾6.0 24.62⫾2.3 .0004 (S) .0003 (S) .201 (NS)
Immediate recall 38.0⫾5.2 37.3⫾3.4 39.5⫾3.9 .720 (NS) .376 (NS) .230 (NS)
Differed cued recall 18.4⫾3.7 23.6⫾6.4 24.6⫾2.3 .163 (NS) .395 (NS) .900 (NS)
Intrusions 3.8⫾3.5 4.0⫾2.9 3.6⫾4.9 .501 (NS) .597 (NS) .202 (NS)
Visual (Shapes) 11.8⫾0.7 11.0⫾1.5 12.0⫾0.0 .147 (NS) .443 (NS) .049 (NS)
Executive functions
Trail-Making Test B (s) 54.2⫾14.3 90.3⫾41.0 96.50⫾41.3 .000032 (S) .00015 (S) .33006 (NS)
Verbal Fluency 22.7⫾6.9 22.5⫾7.1 21.2⫾6.1 .798 (NS) .335 (NS) .709 (NS)
Wisconsin 5.6⫾2.1 4.7⫾1.8 4.0⫾2.5 .104 (NS) .049 (NS) .407 (NS)
Language (Boston) 19.4⫾0.8 19.1⫾0.9 19.6⫾0.7 .157 (NS) .570 (NS) .055 (NS)
Visual gnosis (Ghent) 5.0⫾0.0 5.0⫾0.0 5.0⫾0.0 .500 (NS) .500 (NS) .500 (NS)
Standardized praxies
Ideomotor 19.1⫾1.0 18.9⫾1.3 19.2⫾1.1 .188 (NS) .148 (NS) .919 (NS)
Reflexive 7.7⫾0.5 7.0⫾1.0 6.9⫾0.9 .0161 (NS) .0139 (NS) .2942 (NS)
Constructional 9.6⫾0.9 9.1⫾1.2 3.4⫾0.5 .806 (NS) .371 (NS) .499 (NS)
[image:4.594.57.531.207.464.2]sivity, mean diffusivity, and radial diffusivity—yielded no signif-icant group differences. This is consistent with a recent (2012) study by Bosch and colleagues,28indicating that FA more closely
correlates to the cognitive profile than longitudinal diffusivity or
radial diffusivity in patients with MCI and healthy controls. How-ever, another recent TBSS study assessing the same diffusion pa-rameters in clinically overt AD cases compared with healthy con-trols led to the opposite results.74 The few available recent
FIG 1. TBSS analysis between MCI subtypes. md-aMCI compared with sd-aMCI had significantly reduced FA (redtoyellow) in a bilateral right-dominant network including right uncinate fasciculus, forceps minor, and internal capsule, as well as bilateral inferior fronto-occipital fasciculus, anterior thalamic radiation, superior longitudinal fasciculus, inferior longitudinal fasciculus, and corticospinal tract. md-aMCI com-pared with sd-fMCI had less pronounced reduction in FA in right inferior fronto-occipital fasciculus and inferior longitudinal fasciculus (blueto
[image:5.594.56.532.48.216.2]light blue). Axial, sagittal, and coronal sections at the indicated position in Montreal Neurological Institute; standard space coordinates (radiologic convention with right hemisphere on left-hand side).Gray, mean FA value;green, average skeleton. Threshold-free cluster enhance-ment– corrected for multiple comparisons atP⬍.05. Suprathreshold voxels were enlarged by using TBSS fill (part of FSL) for illustrative purposes.
Table 3: List of suprathreshold clusters (threshold-free cluster enhancement– corrected atP<.05) for the comparison of MCI subgroups
Cluster
Index Voxels Z-MAX
Z-MAX X (mm)
Z-MAX Y (mm)
Z-MAX Z (mm)
Z-COG X (mm)
Z-COG Y (mm)
Z-COG Z
(mm) Side Anatomic Location sd-fMCI versus
md-aMCI
1 40 .952 ⫺12 ⫺86 ⫺7 ⫺12.8 ⫺85.2 ⫺4.18 Right Inferior fronto-occipital
fasciculus (occipital) Inferior longitudinal fasciculus
(occipital)
2 12 .951 ⫺7 ⫺84 ⫺3 ⫺7.17 ⫺83.8 ⫺2.5 Right Inferior fronto-occipital
fasciculus (occipital) Inferior longitudinal fasciculus
(occipital) sd-aMCI versus
md-aMCI
1 3409 .973 25 28 0 29.6 4.3 20.3 Right Inferior fronto-occipital
fasciculus (frontal) Uncinate fasciculus Anterior thalamic radiation Internal capsule
Superior longitudinal fasciculus Corticospinal tract
2 694 .966 ⫺25 ⫺24 24 ⫺32.4 ⫺35.5 13.1 Left Anterior thalamic radiation
Superior longitudinal fasciculus Corticospinal tract
Inferior fronto-occipital fasciculus
Inferior longitudinal fasciculus
3 175 .959 15 ⫺8 56 16.4 ⫺7.61 52.9 Right Superior longitudinal fasciculus
4 66 .954 17 47 ⫺9 17.1 48.9 ⫺6.96 Right Forceps minor
[image:5.594.55.534.324.637.2]investigations on the different diffusion parameters in normal aging, MCI, and AD28,74-77provided inconsistent data with
re-spect to the regional differences in the distribution of significant changes in FA, longitudinal diffusivity, radial diffusivity, and mean diffusivity. For example, in the above mentioned study of subjects with MCI and AD, FA was more closely related to the cognitive profile than longitudinal diffusivity or radial diffusiv-ity.28In contrast, another study in AD showed stronger
differ-ences in longitudinal diffusivity, radial diffusivity, and mean dif-fusivity than FA.74It is likely that the sensitivity of the different
diffusion parameters may vary substantially as a function of the disease severity. Research using these different diffusion indices is still at an early stage, as is our understanding of the relevance of longitudinal diffusivity and radial diffusivity changes in terms of myelin or axonal damage. FA changes without parallel modifica-tions in other diffusion parameters as those observed in our cases of MCI support the idea of group differences at the level of fiber tract coherence rather than myelin or axonal integrity loss.78In
clinically overt AD, the predominance of myelin loss is accompa-nied by concomitant changes in DTI parameters. Finally, walle-rian degeneration suggested by increased mean diffusivity, with-out significant changes in FA, may take place only in advanced stages of the degenerative process.79Future work is clearly
war-ranted to elucidate the biologic significance of DTI parameter changes over time in aging, MCI, and AD.
TBSS Analysis
The number of previous DTI studies of MCI subtypes implement-ing a similar voxelwise TBSS analysis is still limited. Most investi-gations included only 1 (not further specified) MCI group,23-25or
only the sd-aMCI subtype,26-29or a mix of several subtypes, with
the aim of discriminating stable versus progressive MCI.30Only 3
recent contributions compared DTI patterns in aMCI versus non-MCI.36,37In their study of 55 patients with aMCI and 41 patients
with non-MCI, Chua et al36reported significantly lower FA in the
splenium of corpus callosum and significantly higher mean diffu-sivity in the left parahippocampal subgyrus in the aMCI com-pared with the non-MCI group. Zhuang et al37included 96
pa-tients with aMCI and 69 papa-tients with non-MCI. Despite the higher number of cases, the comparison between aMCI versus non-MCI yielded no significant differences in this investigation. A possible explanation for this observation might be the hetero-geneous constitution of the non-MCI group, which included
cases with various neuropsychologic profiles (and presumably FA-related patterns). Another recent study by O’Dwyer et al31
implemented a very similar analysis approach as did our previous work in stable versus progressive MCI.30The use of SVM analysis
of TBSS-preprocessed DTI data provided highly accurate dis-criminations of patients with MCI versus controls, patients with aMCI versus patients with non-MCI and controls, as well as pa-tients with non-MCI versus papa-tients with aMCI and controls. In contrast to the present study, O’Dwyer et al31did not specifically
assess the classification between MCI subtypes. Moreover, this contribution explored only aMCI and non-MCI, while the cur-rent study uses a more detailed discrimination of MCI into 3 subtypes. Using a careful neuropsychologic characterization, the present study is the first, to our knowledge, that describes distinct patterns of WM changes among the 3 MCI subtypes. The wide-spread involvement of long intrahemispheric connections within the right hemisphere in md-aMCI compared with sd-aMCI is expected, as it corresponds to the progressive deterioration of several cognitive functions other than memory preceding the conversion to AD. These anatomic observations fit with func-tional data collected in the same cohort, revealing altered right hemispheric electrophysiologic patterns during face recognition in md-aMCI compared with sd-aMCI.80The more pronounced
damage of inferior fronto-occipital and inferior longitudinal fas-ciculi in md-aMCI compared with sd-fMCI is in agreement with the retrogenesis hypothesis in AD that postulates an early involve-ment of late-myelinating pathways in the initial phases of the degenerative process.29,31The comparison between sd-fMCI and
sd-aMCI yielded no significant group differences. There are 2 possible explanations for this result. First, md-aMCI is known to be a very heterogeneous group that covers not only the linear evolution of sd-aMCI over time but also several AD pathology-independent causes of dementia.81Alternatively, the small
num-ber of cases included in the sd-aMCI group may be not sufficient to identify subtle MR imaging differences compared with sd-fMCI. Supporting the idea that sd-fMCI cases form an etiopatho-genetically distinct group, possibly not evolving to AD, a recent study by Grambaite et al82reported increased radial and mean
diffusivities in rostral middle frontal, medial orbitofrontal, caudal anterior cingulate, posterior cingulate, and retrosplenial cortices that correlated with attention/executive deficits in these cases. Further investigations in larger cohorts, including longitudinal follow-up of the different MCI subtypes, are needed to explore the biologic substrates of cognitive deficits in sd-fMCI.
SVM Individual Classification Analysis
Neuroimaging research has been dominated for decades by group-level comparisons, typically of a patient group versus a control group, with the aim of identifying group-related changes in brain morphometry. While such group-level studies provide fascinating insights into disease-related morphometric altera-tions from a research perspective, these group-level results cannot be transferred into clinical neuroradiology to identify the early stages of the dementing process at an individual level. To obtain individual discrimination between MCI subgroups, we adopted a complex methodology including a processing chain of TBSS pre-processing of DTI FA data, feature selection of the most discrim-Table 4: Individual SVM classification based on DTI FA TBSS
md-aMCI versus sd-fMCI
md-aMCI versus sd-aMCI
sd-fMCI versus sd-aMCI
Number of subjects 34/11 34/15 11/15
Chance rate 0.76 0.69 0.58
SVM analysis
[image:6.594.52.284.57.172.2]inative voxels, and subsequent SVM classification.30,83The
clas-sification accuracy of approximately 97% for all MCI subtypes in our series implies that only 1 subject was incorrectly classified, regardless of MCI subgroup. Note that the inclusion of a control group is not necessary for such individual-level classification analyses, as a classifier that perfectly discriminates, for example, 1 MCI subtype versus healthy controls may not necessarily also dis-criminate between the different MCI subtypes. In fact, the brain regions (or features) that best discriminate between MCI subtypes are probably different from those regions that best discriminate between patients with MCI and healthy controls. The imple-mented individual-level classification analysis is fundamentally different from the “classic” group-level comparisons and explains why we did not include a healthy control group in this study.
At first glance, it might appear counterintuitive that the SVM individual classification was very successful in discriminating sd-fMCI versus sd-aMCI, despite the absence of threshold-free clus-ter enhancement– corrected suprathreshold differences for the corresponding TBSS group comparison. This can, however, be readily explained by the major conceptual differences between these techniques. For the TBSS group-level analysis, around 150,000 voxels are analyzed. This large amount of multiple com-parisons requires strict multiple-comcom-parisons correction. In con-trast, the SVM analysis creates only 1 parameter per case and hence there is no need for multiple comparisons. In addition, TBSS analyzes each voxel separately, while SVM combines multi-ple features (or voxels), thus enhancing the signal-to-noise ratio. Both effects are complementary and readily explain the higher sensitivity of SVM compared with TBSS.
Two previous studies successfully applied a SVM classifier to discriminate patients with AD versus healthy controls based on gray matter (after voxel-based morphometry preprocessing), with accuracies of 89%42and 94.5%.45Three more recent gray
matter contributions classified stable versus progressive MCI with accuracies of 75%,1681.5%,44and 85%.43In 1 of our previous
SVM studies based on WM (after DTI TBSS preprocessing), the classification of stable versus progressive MCI reached an accu-racy of 98%.30Only 1 previous study explored individual
classifi-cation of aMCI versus non-MCI using a binary logistic regression model of single anatomic regions.36DTI changes in the left
pos-terior cingulate distinguished aMCI from non-MCI with a sensi-tivity of 80% and specificity of 60.3%. The multi-voxel pattern recognition approach of the current investigation combines mul-tiple regions for the individual classification analysis and yielded substantially higher classification accuracies.
Strengths and Limitations
Strengths of the present work include the selection of communi-ty-based cases of MCI, in-depth neuropsychologic characteriza-tion, as well as combined use of TBSS and SVM analyses. Several limitations should, however, be considered when interpreting these data. From a clinical viewpoint, this cross-sectional group comparison investigates the structural substrates of MCI sub-groups but did not provide information about their evolution over time. Whether the observed DTI changes alone, or in com-bination with molecular AD markers such as amyloid imaging or CSF amyloid/levels, could predict rapid cognitive decline (or
conversion to AD) in each MCI subgroup remains to be eluci-dated. Correlations between neuropsychologic and neuroimaging data were not performed in order to avoid multiple comparison biases created by the limited sample. This latter point may also affect the results of the SVM analysis. In fact, the very high accu-racy rates of individual classification exceeded our expectations. These values were obtained by a well-established 10-fold cross-validation, where 9 parts are used for training and the remaining part is used for testing the classifier. Even though this cross-vali-dation approach is a standard method in the field of machine learning/multi-voxel pattern analysis, and is appropriate for the number of subjects involved in our study, the present results seem too optimistic, probably related to some degree of overfitting of the data. Moreover, we first performed a feature selection (ratio-nale discussed above), which might further contribute to some degree of overfitting. Finally, the nonlinear (radial basis function kernel) SVM does not provide an easy-to-interpret weight vector to examine the biologic compromise associated with MCI sub-types. Additional validation in larger independent datasets, which should be ideally acquired on different MR scanners, is warranted to confirm the present findings.
CONCLUSIONS
The reliable definition of MCI subtypes is a sine qua non condi-tion for developing appropriate curative or symptomatic treat-ments before the irreversible brain damage that characterizes se-vere forms of dementia. Our data show that a highly accurate classification of MCI subtypes at the individual level can be ob-tained by SVM analysis of DTI-derived modifications in FA. The high proportion of subjects with MCI who already undergo brain MR imaging during work-up of dementia suspicion in routine clinical settings, in combination with the short measurement time of DTI and potentially almost automatic postprocessing of the data, imply a potential benefit and clinical practicability of this objective and individual classifier.
ACKNOWLEDGMENTS
We thank all subjects for participating in the study.
Disclosures: Sven Haller—RELATED: Grant:This work is supported by Swiss National Foundation grant SNF 3200B0-116193 (PG) and SPUM 33CM30-124111 (Giannakopoulos, Herrmann, and Gold) as well as an unrestricted grant of the Velux Stiftung (Founda-tion).* Panteleimon Giannakopoulos—RELATED: Grant:Swiss National Foundation for Research, Comments: Unrestricted grant from the federal organism in charge of the research promotion in Switzerland;UNRELATED: Grants/Grants Pending:Swiss National Foundation for Research. (*Money paid to institution)
REFERENCES
1. Nitsch RM, Hock C.Targeting beta-amyloid pathology in Alzhei-mer’s disease with Abeta immunotherapy. Neurotherapeutics
2008;5:415–20
2. Duara R, Barker W, Loewenstein D, et al.The basis for disease-mod-ifying treatments for Alzheimer’s disease: the Sixth Annual Mild Cognitive Impairment Symposium. Alzheimers Dement 2009;5: 66 –74
3. Holmes C, Boche D, Wilkinson D, et al.Long-term effects of Abeta42 immunisation in Alzheimer’s disease: follow-up of a randomised, placebo-controlled phase I trial.Lancet2008;372:216 –23
for Alzheimer’s disease: a phase IIa, double-blind, randomised, pla-cebo-controlled trial.Lancet Neurol2008;7:779 – 86
5. Petersen RC, Negash S.Mild cognitive impairment: an overview.
CNS Spectr2008;13:45–53
6. Petersen RC.Mild cognitive impairment as a diagnostic entity.J In-tern Med2004;256:183–94
7. Mariani E, Monastero R, Mecocci P.Mild cognitive impairment: a systematic review.J Alzheimers Dis2007;12:23–35
8. Forlenza OV, Diniz BS, Nunes PV, et al.Diagnostic transitions in mild cognitive impairment subtypes. Int Psychogeriatr2009;21: 1088 –95
9. Ashburner J, Friston KJ.Voxel-based morphometry–the methods.
Neuroimage2000;11:805–21
10. Scahill RI, Schott JM, Stevens JM, et al.Mapping the evolution of regional atrophy in Alzheimer’s disease: unbiased analysis of fluid-registered serial MRI.Proc Natl Acad Sci U S A2002;99:4703– 07 11. Karas GB, Burton EJ, Rombouts SA, et al.A comprehensive study of
gray matter loss in patients with Alzheimer’s disease using opti-mized voxel-based morphometry.Neuroimage2003;18:895–907 12. Karas GB, Scheltens P, Rombouts SA, et al.Global and local gray
matter loss in mild cognitive impairment and Alzheimer’s disease.
Neuroimage2004;23:708 –16
13. Karas G, Sluimer J, Goekoop R, et al. Amnestic mild cognitive impairment: structural MR imaging findings predictive of conver-sion to Alzheimer disease.AJNR Am J Neuroradiol2008;29:944 – 49 14. Chupin M, Gerardin E, Cuingnet R, et al.Fully automatic
hippocam-pus segmentation and classification in Alzheimer’s disease and mild cognitive impairment applied on data from ADNI. Hippocam-pus2009;19:579 – 87
15. Holland D, Brewer JB, Hagler DJ, et al.Subregional neuroanatomi-cal change as a biomarker for Alzheimer’s disease.Proc Natl Acad Sci U S A2009;106:20954 –59
16. Plant C, Teipel SJ, Oswald A, et al.Automated detection of brain atrophy patterns based on MRI for the prediction of Alzheimer’s disease.Neuroimage2010;50:162–74
17. Della Nave R, Ginestroni A, Tessa C, et al.Brain white matter dam-age in SCA1 and SCA2. An in vivo study using voxel-based mor-phometry, histogram analysis of mean diffusivity and tract-based spatial statistics.Neuroimage2008;43:10 –19
18. Della Nave R, Ginestroni A, Tessa C, et al.Brain white matter tracts degeneration in Friedreich ataxia. An in vivo MRI study using tract-based spatial statistics and voxel-tract-based morphometry.Neuroimage
2008;40:19 –25
19. Ibrahim I, Horacek J, Bartos A, et al.Combination of voxel based morphometry and diffusion tensor imaging in patients with Alz-heimer’s disease.Neuro Endocrinol Lett2009;30:39 – 45
20. Haller S, Xekardaki A, Delaloye C, et al.Combined analysis of grey matter voxel-based morphometry and white matter tract-based spatial statistics in late-life bipolar disorder.J Psychiatry Neurosci
2011;36:391– 401
21. Agosta F, Pievani M, Sala S, et al.White matter damage in Alzheimer disease and its relationship to gray matter atrophy.Radiology
2011;258:853– 63
22. Smith SM, Jenkinson M, Johansen-Berg H, et al.Tract-based spatial statistics: voxelwise analysis of multi-subject diffusion data. Neuro-image2006;31:1487–505
23. Damoiseaux JS, Smith SM, Witter MP, et al.White matter tract in-tegrity in aging and Alzheimer’s disease. Hum Brain Mapp
2009;30:1051–59
24. Liu Y, Spulber G, Lehtimaki KK, et al.Diffusion tensor imaging and tract-based spatial statistics in Alzheimer’s disease and mild cogni-tive impairment.Neurobiol Aging2011;32:1558 –71
25. Teipel SJ, Meindl T, Grinberg L, et al.The cholinergic system in mild cognitive impairment and Alzheimer’s disease: an in vivo MRI and DTI study.Hum Brain Mapp2011;32:1349 – 62
26. Teipel SJ, Pogarell O, Meindl T, et al.Regional networks underlying interhemispheric connectivity: an EEG and DTI study in healthy
ageing and amnestic mild cognitive impairment.Hum Brain Mapp
2009;30:2098 –119
27. Arenaza-Urquijo EM, Bosch B, Sala-Llonch R, et al.Specific ana-tomic associations between white matter integrity and cognitive reserve in normal and cognitively impaired elders.Am J Geriatr Psy-chiatry2011;19:33– 42
28. Bosch B, Arenaza-Urquijo EM, Rami L, et al.Multiple DTI index analysis in normal aging, amnestic MCI and AD. Relationship with neuropsychological performance.Neurobiol Aging2012;33:61–74 29. Teipel SJ, Meindl T, Wagner M, et al.Longitudinal changes in fiber
tract integrity in healthy aging and mild cognitive impairment: a DTI follow-up study.J Alzheimers Dis2010;22:507–22
30. Haller S, Nguyen D, Rodriguez C, et al.Individual prediction of cognitive decline in mild cognitive impairment using support vec-tor machine-based analysis of diffusion tensor imaging data.J Alz-heimers Dis2010;22:315–27
31. O’Dwyer L, Lamberton F, Bokde AL, et al.Using support vector machines with multiple indices of diffusion for automated classifi-cation of mild cognitive impairment.PLoS One2012;7:e32441 32. Jak AJ, Bangen KJ, Wierenga CE, et al.Contributions of
neuropsy-chology and neuroimaging to understanding clinical subtypes of mild cognitive impairment.Int Rev Neurobiol2009;84:81–103 33. He J, Farias S, Martinez O, et al.Differences in brain volume,
hip-pocampal volume, cerebrovascular risk factors, and apolipoprotein E4 among mild cognitive impairment subtypes. Arch Neurol
2009;66:1393–99
34. Whitwell JL, Petersen RC, Negash S, et al.Patterns of atrophy differ among specific subtypes of mild cognitive impairment.Arch Neurol
2007;64:1130 –38
35. Bell-McGinty S, Lopez OL, Meltzer CC, et al.Differential cortical atrophy in subgroups of mild cognitive impairment.Arch Neurol
2005;62:1393–97
36. Chua TC, Wen W, Chen X, et al.Diffusion tensor imaging of the posterior cingulate is a useful biomarker of mild cognitive impair-ment.Am J Geriatr Psychiatry2009;17:602–13
37. Zhuang L, Wen W, Zhu W, et al.White matter integrity in mild cognitive impairment: a tract-based spatial statistics study. Neuro-image2010;53:16 –25
38. Grambaite R, Stenset V, Reinvang I, et al.White matter diffusivity predicts memory in patients with subjective and mild cognitive im-pairment and normal CSF total tau levels.J Int Neuropsychol Soc
2010;16:58 – 69
39. Stebbins GT, Murphy CM.Diffusion tensor imaging in Alzheimer’s disease and mild cognitive impairment. Behav Neurol 2009;21: 39 – 49
40. Noble WS.What is a support vector machine? Nat Biotechnol
2006;24:1565– 67
41. Haller S, Lovblad KO, Giannakopoulos P.Principles of classification analyses in mild cognitive impairment (MCI) and Alzheimer dis-ease.J Alzheimers Dis2011;26:389 –94
42. Klo¨ppel S, Stonnington CM, Chu C, et al.Automatic classification of MR scans in Alzheimer’s disease.Brain2008;131:681– 89
43. Fan Y, Batmanghelich N, Clark CM, et al.Spatial patterns of brain atrophy in MCI patients, identified via high-dimensional pattern classification, predict subsequent cognitive decline. Neuroimage
2008;39:1731– 43
44. Misra C, Fan Y, Davatzikos C.Baseline and longitudinal patterns of brain atrophy in MCI patients, and their use in prediction of short-term conversion to AD: results from ADNI.Neuroimage2009;44: 1415–22
45. Magnin B, Mesrob L, Kinkingnehun S, et al.Support vector ma-chine-based classification of Alzheimer’s disease from whole-brain anatomical MRI.Neuroradiology2009;51:73– 83
46. Folstein MF, Folstein SE, McHugh PR.“Mini-Mental State.” A prac-tical method for grading the cognitive state of patients for the clini-cian.J Psychiatr Res1975;12:189 –98
and dementia in elderly community dwellers.J Am Geriatr Soc
1992;40:1129 –34
48. Zigmond AS, Snaith RP.The hospital anxiety and depression scale.
Acta Psychiatr Scand1983;67:361–70
49. Wechsler D.Adult Intelligence Scale, Revised (WAIS-R), The Psycho-logical Corp., New York, 1981.
50. Milner B.Interhemispheric differences in the localization of psy-chological processes in man.Br Med Bull1971;27:272–77 51. Buschke H, Sliwinski MJ, Kuslansky G.Diagnosis of early dementia
by the Double Memory Test: encoding specificity improves diag-nostic sensitivity and specificity.Neurology1997;48:989 –97 52. Baddeley A, Emslie H, Nimmo-Smith I.Doors and people. A test of
visual and verbal recall and recognition. Thames Valley Test Company: Bury St. Edmunds, UK, 1994
53. Reitan RM.Validity of the Trail Making Test as an indicator of or-ganic brain damage.Percept Mot Skills1958;8:271–76
54. Butters N, Granholm E, Salmon DP, et al.Episodic and semantic memory: a comparison of amnesic and demented patients.J Clin Exp Neuropsychol1987;9:479 –97
55. Borkowski JG, Benton AL, Spreen O.Word fluency and brain dam-age.Neuropsychologia1967;5:135– 40
56. Heaton RK.Wisconsing Card Sorting Test Manual1981
57. Kaplan EF, Goodglass H, Weintraub S.The Boston naming test(2nd edition), 1983
58. Ghent L.Perception of overlapping and embedded figures by chil-dren of different ages.Am J Psychol1956;69:575– 87
59. Schnider A, Hanlon RE, Alexander DN, et al.Ideomotor apraxia: behavioral dimensions and neuroanatomical basis. Brain Lang
1997;58:125–36
60. Poeck K.Clues to the nature of disruption to limb praxis. Neuro-psychological Studies of Apraxia and Related Disorders; 1985:99 –109 61. Welsh KA, Butters N, Mohs RC, et al.The Consortium to Establish a Registry for Alzheimer’s Disease (CERAD). Part V. A normative study of the neuropsychological battery.Neurology1994;44:609 –14 62. Hughes CP, Berg L, Danziger WL, et al.A new clinical scale for the
staging of dementia.Br J Psychiatry1982;140:566 –72
63. Petersen RC, Doody R, Kurz A, et al.Current concepts in mild cog-nitive impairment.Arch Neurol2001;58:1985–92
64. Libon DJ, Xie SX, Eppig J, et al.The heterogeneity of mild cognitive impairment: a neuropsychological analysis.J Int Neuropsychol Soc
2010;16:84 –93
65. Petersen RC, Morris JC.Mild cognitive impairment as a clinical en-tity and treatment target.Arch Neurol2005;62:1160 – 63; discussion 1167
66. Petersen RC, Roberts RO, Knopman DS, et al. Mild cognitive impairment: ten years later.Arch Neurol2009;66:1447–55 67. Fazekas F, Chawluk JB, Alavi A, et al.MR signal abnormalities at 1.5
T in Alzheimer’s dementia and normal aging.AJR Am J Roentgenol
1987;149:351–56
68. Smith SM, Johansen-Berg H, Jenkinson M, et al.Acquisition and voxelwise analysis of multi-subject diffusion data with tract-based spatial statistics.Nat Protoc2007;2:499 –503
69. Smith SM, Jenkinson M, Woolrich MW, et al.Advances in functional and structural MR image analysis and implementation as FSL. Neu-roimage2004;23:S208 –19
70. Smith SM, Nichols TE.Threshold-free cluster enhancement: ad-dressing problems of smoothing, threshold dependence and locali-sation in cluster inference.Neuroimage2009;44:83–98
71. Kononenko I, Sˇimec E, Robnik-Sˇikonja M.Overcoming the myopia of inductive learning algorithms with RELIEFF. Appl Intell
1997;7:39 –55
72. Platt J.Sequential minimal optimization: a fast algorithm for
train-ing support vector machines.Advances in Kernel Methods-Support Vector Learning1999;208. Available at: http://citeseerx.ist.psu.edu/ viewdoc/download?doi-10.1.1.55.560&rep⫽rep1&type⫽pdf 73. Scholkopf B, Sung KK, Burges CJC, et al.Comparing support vector
machines with Gaussian kernels to radial basis function classifiers.
IEEE Trans Signal Process1997;45:2758 – 65
74. Acosta-Cabronero J, Williams GB, Pengas G, et al.Absolute diffusivi-ties define the landscape of white matter degeneration in Alzhei-mer’s disease.Brain2010;133:529 –39
75. Zhang Y, Du AT, Hayasaka S, et al.Patterns of age-related water diffusion changes in human brain by concordance and discordance analysis.Neurobiol Aging2010;31:1991–2001
76. Pievani M, Agosta F, Pagani E, et al.Assessment of white matter tract damage in mild cognitive impairment and Alzheimer’s disease.
Hum Brain Mapp2010;31:1862–75
77. Salat DH, Tuch DS, van der Kouwe AJ, et al.White matter pathology isolates the hippocampal formation in Alzheimer’s disease. Neuro-biol Aging2010;31:244 –56
78. Adler CM, Holland SK, Schmithorst V, et al.Abnormal frontal white matter tracts in bipolar disorder: a diffusion tensor imaging study.
Bipolar Disord2004;6:197–203
79. Nguyen D, Vargas MI, Khaw N, et al.Diffusion tensor imaging anal-ysis with tract-based spatial statistics of the white matter abnormal-ities after epilepsy surgery.Epilepsy Res2011 [Epub ahead of print] 80. Deiber MP, Ibanez V, Herrmann F, et al.Face short-term
memory-related electroencephalographic patterns can differentiate multi-versus single-domain amnestic mild cognitive impairment.J Alz-heimers Dis2011;26:157– 69
81. Stephan BC, Matthews FE, Hunter S, et al.Neuropathological profile of mild cognitive impairment from a population perspective. Alz-heimer Dis Assoc Disord2012;26:205–12
82. Grambaite R, Selnes P, Reinvang I, et al.Executive dysfunction in mild cognitive impairment is associated with changes in frontal and cingulate white matter tracts.J Alzheimers Dis2011;27:453– 62 83. Haller S, Bartsch A, Nguyen D, et al.Cerebral microhemorrhage and
iron deposition in mild cognitive impairment: susceptibility-weighted MR imaging assessment.Radiology2010;257:764 –73
APPENDIX
Essential Data Processing Steps 1) DTI data acquisition
2) TBSS data preprocessing (including reconstruction of FA, longitudinal diffusivity, radial diffusivity, and mean diffusivity, as well as spatial normalization into Montreal Neurological Insti-tute; standard space)
3) Group-level analysis:
Group-level comparison of FA, longitudinal diffusivity, radial diffusivity, and mean diffusivity using Randomise Permutation Testing
4) Individual-level classification feature selection using Relieff:
10 repetitions of 10-fold cross-validation SVM classification
10 repetitions of 10-fold cross-validation Radial basis function kernel