Reference : Wade C, Spearpoint M J, Bittern A, Tsai K. Assessing the sprinkler activation predictive capability of the BRANZFIRE fire model. Fire Technology, Vol. 43, No. 3, September, pp.175-193, 2007. doi: 10.1007/s10694-007-0009-5
Assessing the Sprinkler Activation Predictive Capability of the
BRANZFIRE Fire Model
COLLEEN A.WADE 1,MICHAEL SPEARPOINT 2,ADAM BITTERN 3 AND KEVIN (WEI-HENG)TSAI 2
ABSTRACT
This paper describes an investigation into the sprinkler response time predictive capability of the BRANZFIRE fire model. A set of 22 fire/sprinkler experiments are simulated where the sprinkler activation time and the heat release rate (HRR) for each individual experiment had been determined. The experiments provided data for use in validating the sprinkler activation prediction algorithms in the BRANZFIRE zone model.
A set of base case values were chosen and input files constructed for the simulations. The experiments were then simulated by the fire model using both the NIST/JET ceiling jet and Alpert’s ceiling jet options (which are the two ceiling jet correlations available in the BRANZFIRE zone model). The fire model included a heat transfer calculation for the temperature of the heat sensitive sprinkler element. Different sprinkler operational parameters such as the conduction factor, response time index (RTI) and the sprinkler depth below ceiling were also varied to assess the sensitivity of their effect on the activation time.
Results showed that using the NIST/JET ceiling jet algorithm gave a closer prediction of the sprinkler response time in a small room than Alpert’s correlation. This was expected, since the former includes the effect of a hot upper layer while the latter applies to unconfined ceilings. The experiments available for comparison had been conducted inside an enclosure with a developing hot upper layer. The findings also signified that changing the sprinkler operational parameters can change the predicted sprinkler activation time significantly.
Key words: fire modelling, verification and validation, sprinkler response, BRANZFIRE.
1 BRANZ Ltd, Private Bag 50908, Porirua, New Zealand. Author to whom correspondence should be
addressed: email [email protected].
2 University of Canterbury, Christchurch, New Zealand.
INTRODUCTION
General
In recent years, as a result of a greater interest in performance-based design, increased building design complexity and advances in computer processing power, the development and use of computer tools for simulating fire have grown dramatically. Computer fire models play an important role in many fire engineered solutions by assisting engineers to better understand likely fire behaviour and its effects in a given building.
Computer models vary considerably in complexity from simple zone models to sophisticated computational fluid dynamic models. They also include many special-purpose codes for predicting specific phenomena such as glass breakage or heat detector activation. However, all models require validation before they can be used with confidence.
A heat detector response model is intended to predict the time at which a heat detector is expected to operate given the properties of the detector and the fire environment to which it is exposed. This paper describes research on the validation of a heat sensor model that has been incorporated within an existing fire zone model [1]. In this case, the heat sensor is a glass bulb sprinkler head.
There have been a number of models previously developed to predict the response time of sprinklers. The better known models include DETACT-QS [2], LAVENT [3] and JET [4]. Parts of these models have been drawn upon in implementing the sprinkler response model described in this paper.
Background
Figure 1. Room fire development
The activation time of the sprinkler is the time at which the temperature of the sprinkler bulb reaches the nominal activation temperature. Convective heat transfer from the flowing gases in the ceiling jet to the sprinkler bulb is the primary heat transfer mechanism. However, for an enclosure where the ceiling jet is immersed in a hot layer, additional heat transfer from the hot layer to the sprinkler occurs. There are also heat conduction losses from the sprinkler head to the attached pipework.
The best known ceiling jet model is that developed by Alpert [5] who described the gas temperature and velocity in a ceiling jet dependent on the fire size, ceiling height and radial distance from the centre of the fire plume. This was based on fire gases flowing beneath an unconfined ceiling. More recently, Davis [6] developed a detailed mathematical description of the ceiling jet taking into account the presence of a hot upper layer.
Both these ceiling jet models were incorporated into an existing fire zone model [1] allowing fire development in an enclosure to be simulated along with predictions of sprinkler response time.
MODEL DESCRIPTION
Zone model
law and related equations for density and enthalpy, and are in a form given by Peacock et al [7]. These equations predict time varying quantities such as pressure, layer heights and temperatures given the accumulation of mass and enthalpy in each layer. The model solves the set of ODE’s to determine the environment in each compartment layer. The equation for the rate of the change of the pressure in the room, P, is (variables are defined in the nomenclature):
(
l u)
R
h
h
V
dt
dP
&
&
+
−
=
γ
1
This is the gauge pressure at floor level in the compartment, relative to atmospheric pressure at a
nominated reference elevation. The equations for the rate of change of the upper layer volume,
V
, and upper and lower layer temperatures, and respectively, are:u
u
T
T
l(
)
⎥⎦
⎤
⎢⎣
⎡
−
−
=
dt
dP
V
h
P
dt
dV
u u u1
γ
1
&
γ
(
)
⎥⎦
⎤
⎢⎣
⎡
−
+
=
dt
dP
V
T
m
c
h
V
c
dt
dT
u u u p u u u p u&
&
ρ
1
(
)
⎥⎦
⎤
⎢⎣
⎡
−
+
=
dt
dP
V
T
m
c
h
V
c
dt
dT
l l l p l l l p l&
&
ρ
1
Heat transfer to the sprinkler element
The differential equation describing the rate of change of temperature of the sensing element of the
sprinkler, , with time is from Heskestad and Bill [
T
e 8]. Both convective heating of the sensingelement and conductive losses to the sprinkler piping are incorporated. The equation used is:
RTI
T
T
C
RTI
T
T
U
dt
dT
e=
cj(
cj−
e)
−
(
e−
int)
The predicted sprinkler response time is based on a single burning object located within the room of fire origin. There are two algorithms available for predicting sprinkler response in BRANZFIRE. One uses Alpert’s [5] unconfined ceiling jet correlation, while the other uses the JET algorithm developed at National Institute of Standards and Technology [6].
Alpert’s correlations
The empirical correlations developed by Alpert [5] for the temperature, , and velocity, , of the
ceiling jet are:
cj
⎪ ⎪ ⎩ ⎪ ⎪ ⎨ ⎧ > ≤ = ⎪ ⎪ ⎩ ⎪ ⎪ ⎨ ⎧ > ≤ = − 15 . 0 for 195 . 0 15 . 0 for ) ( 96 . 0 18 . 0 for ) / ( 38 . 5 18 . 0 for 9 . 16 5 6 2 1 3 1 3 / 1 3 2 3 5 3 2 int H r r H Q H r H Q U H r H r Q H r H Q T T cj cj & & & &
These correlations are for the maximum temperature and velocity in an unconfined ceiling jet. Variation of temperature and velocity with distance beneath the ceiling is ignored, so it is implicitly assumed that the sprinkler link is located at the distance below the ceiling at which these maximum values occur.
JET algorithm
The JET algorithm developed at NIST by Davis et al [6], along with the subsequent zone model [4] of the same name, predicts the plume centreline temperature, the ceiling jet temperature and the ceiling jet velocity produced by a single fire plume. The unique feature of this algorithm is that the characteristics of the ceiling jet depend on the temperature and depth of the hot layer. The characteristics of the hot layer are calculated from the mass and energy balance equations solved by the fire model (BRANZFIRE). The detailed equations that describe the JET algorithm are published elsewhere [4, 6].
An enhancement to the JET model [6] was made by including the variation of ceiling jet temperature and velocity with depth, from the ceiling surface to the depth at which the maximum temperature occurs [9]. Below that distance it is then assumed that the maximum ceiling jet temperature reduces asymptotically to equal the hot layer temperature at the level of the smoke layer interface. The variation of the ceiling jet temperature and velocity with distance below the ceiling is incorporated using the LAVENT method described in NFPA 204 Appendix B [9]. At the ceiling, the ceiling jet temperature equals the ceiling surface temperature and then increases to a maximum value at a depth,
, below the ceiling given by:
max
d
(
)
0.9max 0.023H r/H
This equation only applies outside the fire plume region where r/H > 0.2. At greater depths beneath the ceiling, the temperature reduces asymptotically to equal the hot layer temperature at the level of the smoke layer interface. An example is illustrated later.
Assumptions that apply with both the Alpert and JET models include:
• compartment pressure near ambient
• flames do not touch the ceiling
• fire is located in centre of compartment
• fire is fully ventilated
• ignores transport time
• ignores radiant heating of link/bulb.
For fires located adjacent to a corner or wall, the HRR used in the ceiling jet correlation is modified
assuming the method of reflection (i.e. uses 2 or 4 for wall and corner fires respectively).
Q
&
Q
&
EXPERIMENTS
Experiment description
A set of 22 fire experiments where a single chair was burned in an enclosure were conducted. Two sprinkler heads were installed for each experiment and the sprinkler activation time, chair mass loss rate and gas temperature profile in the room were measured and reported by Bittern [10]. The HRR was estimated by Bittern from the measured mass loss rate and the effective heat of combustion of the fuel [10]. A bare-wire Type K thermocouple was located adjacent to each sprinkler head, and stainless steel sheathed, mineral insulated Type K thermocouples were used to measure the gas temperature, away from the sprinkler, at depths of 0.1 m, 0.3 m and 1.4 m below the ceiling.
Two different fire location positions (centre and corner of the enclosure) and two different door configurations (open and shut) were investigated. Table 1summarises the position of the fire and the door configuration for each experiment. Experiment 11 was excluded for this comparison as no mass loss data for the chair was collected.
shown in Figure 2. The door set was made of a wooden frame with a plywood door leaf with dimensions of 0.8 m wide x 2.1 m high. The floor of the compartment was concrete.
Table 1. Fire position and door configuration
Experiment no. Fire position Door configuration
1–10 Centre Open
12–15 Centre Shut
[image:7.595.91.506.203.604.2]16–22 Corner Shut
Figure 2. Compartment layout (plan view)
Figure 3. Plasterboard (10 mm) was used to form a backing board for the seat assembly to prevent the foam from dropping to the floor when burning. The chair was placed on a load cell to record the mass loss during the experiment with the base of the seat approximately 0.65 m above the floor. The seat was ignited with a solid petroleum fire-lighter (20 mm x 20 mm x 10 mm) positioned at the interface between the back and the seat.
Figure 3. Upholstered chair in centre fire position (extracted from Bittern [10])
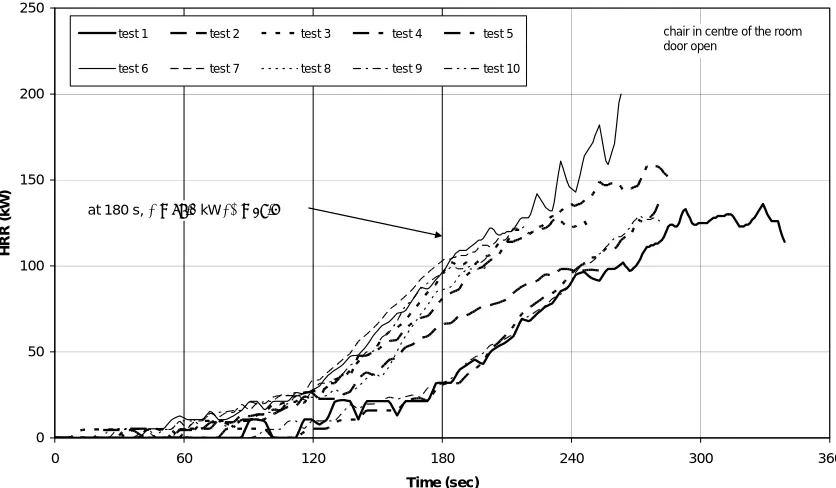
The average heat of combustion of the foam was measured in a cone calorimeter to be 21.0 MJ/kg (tests 1–10) and 20.4 MJ/kg (tests 11–22). This was used with the measured mass loss rate for each experiment to determine the rate of heat release of the chair.
Two sprinkler heads spaced 4 m apart and generally complying with the New Zealand Standard NZS 4541:2003 [12] were installed beneath the ceiling for each experiment. There were four different models of sprinkler head used for the experiments. They were:
1. Residential Type A: pendent, nominal activation temperature 68°C (TYCO F680)
2. Residential Type B: pendent, nominal activation temperature 68°C (TYCO 2234)
3. Standard Response SS68: pendent, standard coverage, nominal activation temperature 68°C (TYCO 3251)
The four sprinkler heads were supplied by the manufacturer TYCO and were selected based on sprinkler head availability. The selected sprinkler heads provided a variation in activation temperature and RTI.
The sprinkler heads were not charged with flowing water during the experiment, but the pipe sections connected to the head did contain water under pressure. This was achieved by holding the water back with a closing valve in the pipe network. Pressure gauges were also installed immediately upstream of each sprinkler head, but before the closing valve, to indicate sprinkler activation.
Technical data for each sprinkler head is shown in Table 2. The RTI was based on a manufacturer’s estimate. Tsui [13] measured the conduction factor for a residential head similar to those used in this study. He estimated a value for the conduction factor in the range 0.33–0.45 (m/s)1/2 with an
estimated uncertainty of up to 20%. On this basis, a conduction factor of 0.4 (m/s)1/2 was selected for
the base case for all the sprinklers in this study.
[image:9.595.70.491.450.667.2]The glass bulbs were typically about 20 mm long, with the mid-point located approximately 15 mm below the ceiling. The heat-sensitive element therefore spanned a depth from 5–25 mm below the ceiling.
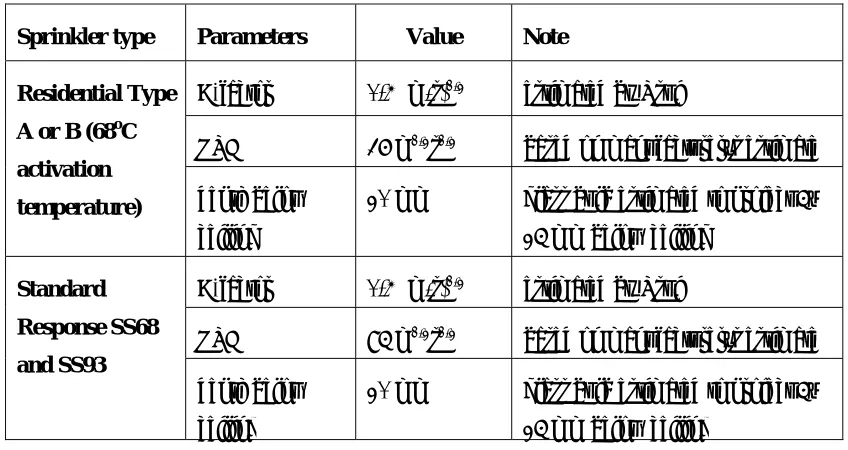
Table 2. Sprinkler head data (base case)
Activation
temperature
RTI C-factor
Residential Type A
(3 mm glass bulb) 68°C 36 m
1/2s1/2 0.4 (m/s)1/2
Residential Type B
(3 mm glass bulb) 68°C 36 m
1/2s1/2 0.4 (m/s)1/2
Standard Response SS68
(5 mm glass bulb) 68°C 95 m
1/2s1/2 0.4 (m/s)1/2
Standard Response SS93
(5 mm glass bulb) 93°C 95 m
Experiment results
Table 3 shows a summary of the 44 sprinkler head activation times recorded during the experiments [10]. The radial distance from the centre of the fire plume to each sprinkler head was 2 m for experiments 1–15. Regarding experiments 16–22 with the corner fire location, the radial distances between the fire and the sprinkler heads were 2.8 m and 6.3 m for heads 1 and 2 respectively.
Expt ID Head 1 Time
(sec) ID Head 2
Time
(sec)
Tambient
(°C)
1 1ResA Res A 210 1ResA Res A 250 23.7
2 2ResA Res A 225 2ResA Res A 211 25.5
3 3ResB Res B 192 3ResB Res B 192 25.5
4 4SS68 SS68 226 4SS68 SS68 226 25.7
5 5SS68 SS68 266 5SS68 SS68 272 27.5
6 6SS68 SS68 216 6SS68 SS68 211 27.7
7 7ResB Res A 182 7ResA Res A 186 28.2
8 8ResB Res B 182 8ResB Res B 187 27.9
9 9ResB Res B 233 9ResB Res B 230 28.9
Fire in centre of room / d
oo
r open
10 10ResA Res A 183 10ResB Res B 184 29.4
11 11SS68 SS68 199 11ResB Res B 175 –
12 12SS68 SS68 246 12ResB Res B 228 24.0
13 13SS68 SS68 204 13ResB Res B 194 24.5
14 14SS68 SS68 203 14ResB Res B 187 24.2
Fire in centre of room / door
shut
15 15SS68 SS68 270 15ResB Res B 253 23.7
16 16ResB Res B 178 16ResA Res A 244 20.6
17 17ResB Res B 181 17ResA Res A 228 23.8
18 18SS68 SS68 187 18ResA Res A 221 25.0
19 19SS68 SS68 189 19ResA Res A 223 26.4
20 20SS68 SS68 205 20ResA Res A None 25.3
21 21SS93 SS93 216 21SS93 SS93 330 25.2
Fire in corner of room / door
shut
[image:10.595.78.519.211.725.2]22 22SS93 SS93 205 22SS93 SS93 263 25.2
The recorded activation times indicate that the type of sprinkler head has a significant influence on the sprinkler activation time. The results of experiments 11–15 show that under the same fire and door (closed) condition, but with two different sprinkler heads mounted in the room, Residential Type B responded quicker than Standard Response SS68. This is as expected as Residential Type B is more sensitive than Standard Response SS68 due to a smaller RTI value, even though they both have the same activation temperature. The effect of the activation temperature is also apparent from comparing the results of experiments 18–22 for head 1. Both have the same nominal RTI value; however Standard Response SS68 responded quicker than Standard Response SS93.
The position of the fire relative to the sprinkler head is also an important parameter influencing the sprinkler activation time. With the fire placed mid-way between sprinklers (experiments 1–9) and the door open, the difference in activation times for two identical sprinkler heads in the same experiment ranged from 0–40 seconds, with an average variation of 9 seconds. For the corner fire, however, the activation time for the respective sprinkler heads varied considerably. Comparing sprinkler activation times for experiments 16–22, sprinkler head 1, which was closer to the fire source, responded at least 30 seconds earlier than sprinkler head 2.
It is difficult to conclude whether the door open/closed configuration had any effect on sprinkler activation times from the limited experimental data. The difference in sprinkler activation times for both door open and shut appeared insignificant.
SIMULATIONS
Scenarios
The scenarios investigated were:
1. Simulations using base case values for the sprinkler parameters in conjunction with the NIST/JET and Alpert’s ceiling jet correlations respectively. The base case values are given in Table 4.
2. A sensitivity analysis investigating the effect of changing the RTI on the standard response sprinkler activation time for the NIST/JET ceiling jet option. RTI’s of 85, 95 and 105 m1/2s1/2 were considered.
3. A sensitivity analysis investigating the effect of changing the C-factor on the sprinkler activation time for the NIST/JET ceiling jet option. C-factors of 0.2, 0.4 and 0.6 (m/s) 1/2
were considered.
below the ceiling of 5 mm and 25 mm (the extreme ends of the bulb) to assess the effect of this parameter on the sprinkler activation time.
Measurement showed the depth from the ceiling level to the mid-point of the sprinkler glass bulb was approximately 15 mm for both Residential Type A or B and Standard Response SS68 or SS93. Both sprinkler types have an approximate 20 mm glass bulb length with a 5 mm plate depth on top.
The simulations were run using the base case values describing the sprinkler characteristics as shown in Table 4 with both NIST/JET and Alpert’s ceiling jet options available within the BRANZFIRE fire model.
Sprinkler type Parameters Value Note
C-factor 0.4 (m/s)1/2 estimated by Tsui
RTI 36 m1/2s1/2 based on manufacturer’s estimate
Residential Type
A or B (68oC
activation
temperature) depth below
ceiling
20 mm glass bulb estimated to project 5– 25 mm below ceiling
C-factor 0.4 (m/s)1/2 estimated by Tsui
RTI 95 m1/2s1/2 based on manufacturer’s estimate Standard
Response SS68
and SS93
depth below ceiling
[image:12.595.73.497.277.502.2]20 mm glass bulb estimated to project 5– 25 mm below ceiling
Table 4. Sprinkler base case values
Other model inputs
0 50 100 150 200 250
0 60 120 180 240 300 360
Time (sec)
HR
R (k
W
)
test 1 test 2 test 3 test 4 test 5 test 6 test 7 test 8 test 9 test 10
chair in centre of the room door open
[image:13.595.83.501.81.325.2]at 180 s, μ = 78.1 kW, σ = 29.6
Figure 4. Rate of heat release for experiments 1–10
The fire was located in the room centre or corner as appropriate. The compartment dimensions and door opening size were as described earlier. For experiments 12–22, where the door to the room was closed, compartment/door leakage was not modelled. This was found to make a negligible difference to the results.
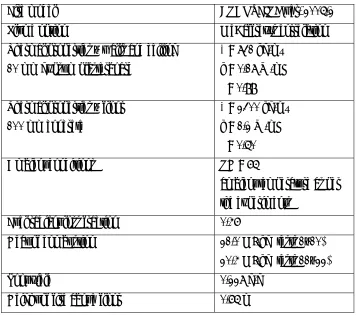
Fire model BRANZFIRE ver. 2005.2
Plume option McCaffrey’s correlation
Thermal properties – walls and ceiling 10 mm gypsum plasterboard
ρ = 731 kg/m³ k = 0.17 W/mK
ε = 0.88 Thermal properties – floor
100 mm concrete
ρ = 2300 kg/m³ k = 1.2 W/mK
ε = 0.50
Ambient conditions RH = 65%
ambient temperature as per the experiments
Fuel radiant loss fraction 0.46
Heat of combustion 21.0 MJ/kg (tests 1–10) 20.4 MJ/kg (tests 11–22)
Soot yield 0.227 g/g
[image:14.595.103.459.68.383.2]Height of fire above floor 0.65 m
Table 5. Summary of fire model input data
Simulation results
0 100 200 300 400 500 600 1 Re s A
2 Re s A
3 Re s B
4 S S68 5 S S68 6 SS6 8 7 Re
s A 8 Re
s B 9 Re
s B 10 Re
s A 12
SS 68 12 Re
s B 13 SS6813 Re
s B 14 S
S68 14 Re
s B 15 SS6
8 15 Re
s B 16 Re
s B 16 R
es A 17 Re
s B 17 Re
s A 18
SS 68 18 Re
s A 19 SS6
8 19 Re
s A 20 SS6820 Re
s A 21 SS
93 21 SS9322 SS9
3 22 S
S93 Spr inkle r A c tiv a tion Tim e (s ec )
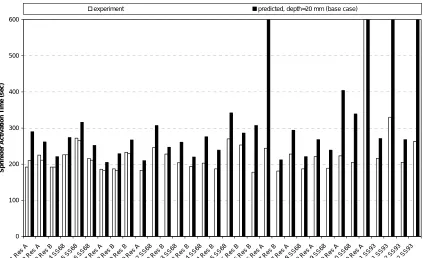
[image:15.595.85.508.74.332.2]experiment predicted, depth=20 mm (base case)
Figure 5. Comparison of measured and predicted activation time for base case – with
BRANZFIRE/JET model
0 100 200 300 400 500 600 1 Re s A 2 Re s A
3 Re s B
4 SS 68
5 SS 68
6 SS 68
7 Re s A
8 Re s B
9 Re s B
10 R es A
12 SS 68 12 R
es B 13 SS
68 13 R
es B 14 SS
68 14 R
es B 15 SS
68 15 R
es B 16 R
es B 16 R
es A 17 R
es B 17 R
es A 18 S
S68 18 R
es A 19 SS
68 19 R
es A 20 SS
68 20 R
es A 21 SS
93 21 SS
93 22 SS
93 22 SS
93
Sprinkler
Activa
tion Time (s
ec)
[image:16.595.87.508.73.337.2]experiment predicted (base case)
Figure 6. Comparison of measured and predicted activation time for base case – with
BRANZFIRE/ALPERT model
Gas temperatures at the sprinkler location
0 20 40 60 80 100 120 140 160 180
0 20 40 60 80 100 120 140 160 180
measured gas temperature at sprinkler (C)
predi
cted g
as
temper
atur
e at spri
nkl
er
(C)
centre fires, r = 2.0 m
corner fires, r = 2.8 m
[image:17.595.83.516.84.325.2]corner fires, r = 6.3 m
Figure 7. Comparison of the measured and predicted gas temperatures at the location of the
sprinkler at the measured sprinkler activation time
290 310 330 350 370 390 410 430 450
0.0 0.2 0.4 0.6 0.8 1.0 1.2
Distance Below Ceiling (m)
Ce
ili
n
g
J
e
t Temper
a
tu
re
(K)
ceiling surface temp, 310 K
lower layer temp, 314 K
upper layer temp, 353 K at 290 seconds, 2 m radially from plume, Q = 127.6 kW max ceiling jet temp, 430 K
gas temp at sprinkler, 20 mm below ceiling, 392.5 K
smoke layer interface
initial ambient temp, 297 K
Figure 8. Simulated gas temperature profile for experiment 1 at time of predicted sprinkler
[image:17.595.85.503.433.680.2]As observed in Figure 7, there is a steep temperature gradient modelled close to the ceiling representing a transition from the ceiling surface temperature to the maximum ceiling jet temperature. For a ceiling height of 2.4 m and radial distance from the plume of 2 m, the depth at
which the ceiling jet temperature is at a maximum is 47 mm (using ). This
increases to 132 mm for a radial distance of 6.3 m. Therefore, for these experiments, the sprinkler bulbs were positioned well above the expected depth at which the maximum ceiling jet temperature occurs.
[
]
0.9 max 0.023H r/Hd =
To illustrate the simulated variation of the gas temperature with depth beneath the ceiling, Figure 8 shows the assumed gas temperature profile over the height of the room for experiment 1 at 290 seconds.
Sensitivity analysis – response time index (RTI)
Wind tunnel tests on the Standard Response SS68 sprinkler head by Tsui [13] obtained a mean RTI value of 97 m1/2s1/2, a minimum RTI value of 92 m1/2s1/2 and a maximum RTI value of 104 m1/2s1/2.
Thus, additional simulations were conducted for the standard sprinkler heads SS68 and SS93 using an RTI of 85 and 105 m1/2s1/2 giving variations of 10 m1/2s1/2 from the base case. Figure 9 shows a
0 100 200 300 400 500 600
4 S S68
5 SS6 8
6 SS68 12 S S68
13 S S68
14 SS 68
15 S S68
18 S S68
19 SS 68
20 S S68
21 S S93
21 S S93
22 S S93
22 S S93
Sp
rink
ler Ac
tivat
ion
Time
(sec
)
[image:19.595.84.509.74.341.2]experiment predicted, RTI=85 predicted, RTI = 95 (base case) predicted, RTI=105
Figure 9. Effect of changing the RTI on the standard response sprinkler activation time
Sensitivity analysis – conduction factor
Additional simulations were done with a sprinkler conduction factor (C-factor) of 0.2 and 0.6 (m/s)1/2
0 100 200 300 400 500 600
1 Re s A
2 Re s A
3 Re s B
4 S S68
5 S S68
6 SS 68
7 Re s A
8 Re s B
9 Re s B
10 Re s A
12 SS6 8
12 Re s B
13 SS68 13 Re s B
14 S S68
14 R es B
15 SS6 8
15 Re s B
Sp
rink
ler Ac
tivat
ion
Time
(sec
)
[image:20.595.85.508.74.341.2]experiment predicted, C-factor = 0.2 predicted, C-factor = 0.4 (base case) predicted, C-factor = 0.6
Figure 10. Effect of changing the conduction factor on the sprinkler activation time
Sensitivity analysis – sprinkler position beneath the ceiling
0 100 200 300 400 500 600
1 R es A
2 R es A
3 Re s B
4 SS 68
5 SS 68
6 SS 68
7 Re s A
8 R es B
9 R es B
10 Re s A
12 SS 68
12 Re s B
13 SS68
13 R es B
14 SS 68
14 Re s B
15 SS68
15 Res
B
S
p
rinkler Act
ivat
ion Time (
sec)
[image:21.595.84.508.76.340.2]experiment predicted, depth=25 mm predicted, depth=20 mm (base case) predicted, depth=15 mm predicted, depth=5 mm
Figure 11. Effect of changing the sprinkler depth below ceiling on the sprinkler activation time
CONCLUSIONS
The response of sprinklers in small rooms is strongly influenced by the presence of a developing hot layer. If using the BRANZFIRE model for predicting sprinkler response times, the use of the JET ceiling jet option is recommended, particularly for small rooms, as better agreement with experimental results is expected.
The JET ceiling jet option (for the base case) gave sprinkler activation times that were, on average, 21% longer than the measured response times for fires located in the centre of the room. Furthermore, the mismatch of the predictions based on the JET ceiling jet model and the experimental results increases with distance from the plume. The use of the Alpert ceiling jet option indicated much longer response times in small rooms compared to actual response times. However, usually this would be considered conservative for design purposes.
provided by the supplier and a typical C-factor of 0.4 (m/s)1/2 gave reasonable results and would be appropriate for design purposes.
The ability to accurately model sprinkler activation not only relies on the depiction of their operational characteristics, but also depends on the accuracy of the ceiling jet conditions which in turn are a function of the source fire term. In the case of the modelling presented in this paper, sources of uncertainty are introduced in the fire growth input through the measurement of the mass loss rate and the determination of the heat of combustion. The assumptions necessary for the zone modelling approach introduce the potential for additional errors which affect any comparison between simulations and experimental results. Given these limitations, the results presented in this paper from using the JET ceiling jet option in BRANZFIRE can be considered to give a reasonable match with the experimental data.
ACKNOWLEDGEMENTS
The authors acknowledge the funding support of Building Research for the preparation of this paper and the New Zealand Fire Service Commission for their financial support of the Fire Engineering program at the University of Canterbury.
NOMENCLATURE
p
c
= specific heat (kJ/kgK)C = sprinkler conduction factor (m/s)1/2
d = location of sprinkler head beneath ceiling (m)
H = height of the ceiling above the base of the fire (m)
l
h& = rate of enthalpy change in the lower layer (kW)
u
h& = rate of enthalpy change in the lower layer (kW)
k = thermal conductivity (W/mk)
l
m
&
= rate of mass in the upper layer (kg/s)u
m
&
= rate of mass in the upper layer (kg/s)r = radial distance from the centre of the plume (m)
RTI = response time index (m1/2s1/2)
t
= time (s)Te = temperature of sprinkler link (K)
Tcj = the temperature of the ceiling jet (K)
Tint = the initial temperature of the compartment (K)
Tl = lower layer temperature (K)
Tu = upper layer temperature (K)
Ucj = velocity of the ceiling jet (m/s)
R
V = compartment volume (m³)
u
V
= upper layer volume (m³)γ
= ratio of specific heatsε
= emissivityρ
= material density (kg/m³)u
ρ
= upper layer gas density (kg/m³)l
ρ
= lower layer gas density (kg/m³)REFERENCES
1. Wade, C.A. 2004. BRANZFIRE Technical Reference Guide. Study Report No 92, BRANZ Ltd, Judgeford, New Zealand.
2. Evans, D.D. and Stroup, D.W., Methods to Calculate the Response Time of Heat and Smoke
Detectors Installed Below Large Unobstructed Ceilings, Fire Technology, vol. 22, 54-65, 1986.
3. Cooper, L.Y., Estimating the Environment and the Response of Sprinkler Links in Compartment
4. Davis, W. 1999. Zone Fire Model Jet: A Model for the Prediction of Detector Activation and Gas
Temperature in the Presence of a Smoke Layer. NISTIR 6324. National Institute of Standards and Technology, USA.
5. Alpert, R. 2002. ‘Ceiling Jet Flows’. SFPE Handbook of Fire Protection Engineering Chapter 2, Section 2, 3rd Edition. NFPA, Quincy.
6. Davis, William D., Notarianni, Kathy A. and Tapper, Phillip Z. 1998. An Algorithm for
Estimating the Plume Centreline Temperature and Ceiling Jet Temperature in the Presence of a
Hot Upper Layer. NISTIR 6178. National Institute of Standards and Technology, USA.
7. Peacock, R.D., Forney, G., Reneke, P., Portier, R. and Jones, W. 1993. CFAST: The
Consolidated Model of Fire and Smoke Transport. NIST Technical Note 1299. National Institute of Standards and Technology, USA.
8. Heskestad, G. and Bill, R. 1988. Quantification of Thermal Responsiveness of Automatic Sprinklers Including Conduction Effects. Fire Safety Journal 14:113–125.
9. National Fire Protection Association (NFPA). 1998. NFPA 204: Guide for Smoke and Heat
Venting. National Fire Protection Association, Quincy.
10. Bittern, A. 2004. Analysis of FDS Predicted Sprinkler Activation Times with Experiments. Masters of Engineering in Fire Engineering Report. University of Canterbury, Christchurch, New Zealand.
11. Underwriters Laboratories Inc. 2001. UL 1626: Standard for Residential Sprinklers for
Fire-Protection. Northbrook, Illinois.
12. Standards New Zealand. 2003. NZS 4541: Automatic Fire Sprinkler Systems. Wellington.
13. Tsui, A. 2004. Statistical analysis of sprinkler response time index and conduction factor using
the plunge test. Masters of Engineering in Fire Engineering Thesis, University of Canterbury, Christchurch, New Zealand.
![Figure 3. Upholstered chair in centre fire position (extracted from Bittern [10])](https://thumb-us.123doks.com/thumbv2/123dok_us/9975932.498259/8.595.111.420.176.361/figure-upholstered-chair-centre-position-extracted-bittern.webp)
![Table 3. Activation result summary (from [10])](https://thumb-us.123doks.com/thumbv2/123dok_us/9975932.498259/10.595.78.519.211.725/table-activation-result-summary.webp)