A thesis
submitted in fulfilment
of the requirements for the degree
of
Doctor of Philosophy
in the
Department of Zoology
by
Andrew John ~olyoake
University of Canterbury
ESIS . f~
Jr '
TABLE OF CONTENTS
!
I IABSTRACT IV
CHAPTER 1 General introduction 1
Mitochondrial DNA 1
Mitochondrial biogenesis 3
Mitochondrial DNA as a marker for human population variation 4
Mitochondrial DNA diseases 5
Neutral mtDNA mutations 8
Mitochondrial DNA mutations, selection, and fertility 9
Human male fertilising potential 10
CHAPTER 2 ATPase 6 and 8 gene mutations 15
Introduction 15
The ATPase amp Ii con 15
Materials and Methods 18
Sample collection 18
Cell DNA isolation 19
Polymerase chain reaction 19
Mutation detection 20
Single cell analysis and sequencing 22
Results 25
Discussion 35
Sensitivity ofPCR-SSCP for mutation detection 35
Mutation analysis 39
CHAPTER 3 COIl gene mutations 45
Introduction 45
COIl structure and function 45
Population studies based on COIl gene variability 47
Materials and Methods 49
Sample statistics 49
Cloning and colony selection for mutation characterisation
con
heteroplasmy analysisSequencing for mutation characterisation
Results
Discussion
Sensitivity ofPCR-SSCP for mutation detection
Mutation analysis
CHAPTER 4 Analysis of sample 94-107 apparent heteroplasmy
Introduction
Heteroplasmy prevalence and maintenance
Multiple site heteroplasmy
Materials and Methods
Results
Differential extraction
ND4/ND5 heteroplasmy
HV1 heteroplasmy
Discussion
Differential extraction
Analysis of further sample 94-107 amplicons
94-107
con
amplicon amplification94-107 ND4/ND5 amplicon amplification
94-107 HV1 amplicon amplification
Time of insertion for sample 94-107 pseudogenes
Method analysis
CHAPTER 5 General discussion
50 50 55 55 56 73 73 73
82
82
83
85
88
88
89
93 94 9496
97 9799
99 109 111Sensitivity of SSCP analysis to detect mutations in the ATPase and COIl
amplicons 111
PCR-SSCP as a means of detecting heteroplasmy 112
MtDNA mutations and fertilising potential
Relationship of ATPase mutations to fertilising potential
Relationship of
con
mutations to fertilising potential113
114
Was the sampled population representative of the Christchurch
population?
Future directions
Improvements in experimental approach
Fertility analysis
Pseudo gene analysis
ACKNO\VLEDGEMENTS
REFERENCES
APPENDICIES
Appendix 1. Seminal data for samples used in this study
Appendix 2. Gels and reagents
Appendix 3. Single·cell data
Appendix 4.94-107 COlI clone sequences
Appendix 5. Chaper 4 amplicon PCR conditions
Appendix 6. 94-107 ND41ND5 clone sequences
Appendix 7.94-107 HVI clone sequences
Appendix 8.94-107 and primate gene sequence alignments
Appendix 9. An evaluation of the Knuc derivation
iii
116
117
117
118
119
120
121
136
136
141
143
144
145
146
149
151
ABSTRACT
Fertilisation is a chance event dependent on, amongst other things, the number,
motility, and physical characteristics of sperm. There is a strong link: between ATP
production and sperm motility. The mitochondrially encoded OXPHOS ATP production
pathway provides ATP for sperm motility. Thirteen polypeptides involved in OXPHOS
are encoded in mtDNA. Therefore, the aim of this study was to assess the influence of
point mutations and small deletions in mtDNA on human male fertilising potential. Two
hundred and fifty two semen samples were screened for mutations in the ATPase 6 and
8, and COlI genes using polymerase chain reaction (PCR), followed by single-strand
conformation polymorphism (SSCP) analysis of restriction digests of two overlapping
amplicons. ATPase 6 and 8 gene analysis of 210 semen samples identified three singly
occuning known homoplasmic polymorphisms (G -t A 8860, G -t A 8856, and G -t A
8839); one polymorphism found in 13 samples that created a known Haell RFLP; and a
novel heteroplasmic point mutation (T -t C 8821) found in the immature sperm from
two semen samples from an oligo-astheno-teratozoospermic individual. Based on amino
acid homologies and protein structure this new heteroplasmic mutation is predicted to be
potentially pathogenic. COlI gene analysis of 223 semen samples identified two
previously described, singly occurring homoplasmic polymorphisms (C -t T 7476, and G
-t A 7853); three novel singly occuning homoplasmic polymorphisms (T -t C 8077, G
-t A 7789, and G -t A 7754); two known homoplasmic polymorphisms found in
multiple samples (9 bp deletion, 7 samples; G -t A 8251, 11 samples) and one novel
heteroplasmic homopolymeric tract insertion in the COIIltRNALys intergenic spacer. Of
the multiply occurring variants found in these genes only a 9 bp deletion from the
COIIltRNALys intergenic spacer of 7 semen samples could be associated with
asthenozoospermia. This association was negated when disease and cultural factors were
considered.
In addition to the characterisation of true heteroplasmy, one case of
pseudogene-created heteroplasmy was characterised in the COlI amplicon from one semen sample.
During the analysis of this known pseudogene-created heteroplasmy, two other novel
v
the D-loop were isolated. All three pseudogenes were characterised and the times of
pseudogene insertion were calculated. The COIl and ND4/ND5 pseudogenes are
predicted to have inserted into nuclear DNA since the time of the last common ancestor
of humans and chimpanzees, whilst the HVI pseudogene is predicted to have an ancient
Chapter 1
GENERAL INTRODUCTION
Mitochondrial DNA
The human mitochondrial DNA (mtDNA) genome is a covalently closed circular molecule normally consisting of 16,569 nucleotide pairs. It encodes 2 rRNAs, 22 tRNAs, and 13 of the 67 subunits of the mitochondrial respiratory chain and oxidative phosphorylation (OXPHOS) system: 7 subunits of NADH CoQ reductase (complex I), Cytochrome b (complex III), subunits I, II, and III of Cytochrome c Oxidase (complex IV), and subunits 6 and 8 of the FoPl ATP synthase (Fig. 1.1) (Anderson et al., 1981). First sequenced in its entirety in 1981 from a mixture of human placenta (European origin) and HeLa cells, the initial human mtDNA sequence has since been deemed a worldwide reference, called the Cambridge sequence (after the locality where the sequencing was performed). This sequence has since been revised (Marzuki et al., 1991). Within this thesis, reference to the Cambridge sequence, inplies the revised sequence.
2
(CUN)
~~(AO~
[image:8.569.78.484.75.466.2]S(UCN) K
Figure 1.1. Diagrammatical representation of the human mtDNA molecule. The protein encoding genes are 7 subunits ofNADH CoQ reductase (N01, 2,3,4, 4L, 5, 6), Cytocluome b (Cyt b), subunits I, IT, and TIl of Cytocluome c Oxidase (COl, IT, TIl), and subwllts 6 and 8 of the FoPl ATP synthase (ATPase 6,8). Transfer RNAs are refered to by their single letter codes. The iso-acceptors of serine and leucine are specified. Ribosomal RNAs are refered to by their size in Svedberg wlits. Origins of replication for the heavy (Ow and light (OL) strands are shown. No attempt has been made to specify the coding strand of each gene. Where relevant tills is mentioned in the text (adapted fTOm Wallace, 1993).
Mitochondrial DNA is particularly prone to mutations! since the mtDNA is not
packed with histone-like proteins (Torroni and Wallace, 1994). Mitochondria have a low
efficiency DNA repair system and mtDNA are attached to the mitochondrial inner membrane
in close proximity to OXPHOS, where many mutagenic oxygen free radicals are generated
(Bandy and Davison, 1990). As a result of the proximity of the mtDNA to OXPHOS, the
DNA (including pseudogenes) (Shoifuer
et ai.,
1990). Paradoxically, mtDNA is not designedto accommodate a higher mutation rate. Whilst an altered genetic code including frequent use
of a 'four-way pairing system' for codon assignment (A vise, 1991) may be an advantage in a
high mutation system, the lack of intergenic spacers and introns to act as mutation 'sinks' is
not. The mtDNA molecule has been streamlined and compacted through evolution by the loss
of intergenic spacers and introns and the transfer of functional genes to the nuclear genome
(Wallace, 1986). This may have provided selective advantage, as small sized mtDNA
molecules will replicate faster and hence enhance fitness both at the intracellular and
organismallevel (Avise, 1991).
One intergenic non-coding region not lost over time is the displacement loop
(D-loop) (Fig. 1.1). The D-loop contains three relatively invariant conserved sequence blocks
(CSB) and two hypervariable regions (HV1 and 2) and is thought to help regulate
transcription and replication (Saccone
et ai.,
1991). The lack of coding and general functionalconstraints in HVI and 2 have allowed them to evolve at a very high rate to the extent that
they have been investigated as an alternative to DNA fingerprinting for between-individual
identification (piercy
et ai.,
1993). This high rate of mutation and the lack of recombinationhas allowed mtDNA to be used as a marker for population variation and species evolution
(for recent review see Cavalli-Sforza, 1998).
Mitochondrial biogenesis
Mitochondrial DNA is a double stranded molecule. The two strands differ
markedly in their base composition. The heavy, (H)-strand contains most of the guanine
(G) residues whilst the light (L)-strand contains most of the cytosine (C) residues. The
H-strand functions as the template for the two rRNAs, 12 of the polypeptides, and 14 of
the tRNAs whilst the L-strand is the template for the ND6 polypeptide and 8 tRNAs
(Ojala
et ai.,
1981). MtDNA uses two replication origins; OL and OH. Replication fromOH is initiated first by prior RNA transcription from the light strand propmotor (LSP)
using an mtRNA polymerase in association with a mitochondrial transcription factor
(mtTF A). This RNA molecule binds strongly to two conserved sequence blocks (CSBI,
4
II) prior to OH. The non-bound RJ"fA is clipped by an MRP Rnase. The bound RJ"fA then
acts as a primer for H-strand replication. With the progression of H-strand synthesis
(clockwise on Figure 1.1), the parental H-strand is displaced. L-strand synthesis is
initiated in an anti-clockwise direction, when OL is exposed (Wong and Clayton, 1986).
L-strand synthesis proceeds back along the free H-strand, thus replication is bidirectional
but asynchronous (for review see Shadel and Clayton, 1997)
Transcription is also bidirectional with promoters for both the H and L-strands in
the D-loop facing in opposite directions. The H-strand promoter (PH) reads
anticlockwise whilst the L-strand promoter (PL) reads clockwise (Montoya et al., 1981).
Both transcripts encompass the entire genome. As tRJ"fAs are formed they fold and are
cleaved out (Ojala et al., 1981) releasing mRJ'\fAs and rRJ"fAs in the process. Messenger
RJ"fA poly-A tails are added posttranscriptionally (Anderson et al., 1981). As mtDNA
uses a different genetic code to nuclear DNA (Anderson et al., 1981) mitochondrial
mRJ'\fA cannot be translated in the cytoplasm.
Mitochondrial DNA as a marker for human population variation
As a consequence of random mutations along defined lineages, human
populations now harbour a wide variety of ethnic-specific changes. This has given rise to
defined haplotypes which associate with specific populations or ethnic groups. However,
mutations are random, continuous and reversible meaning that not all individuals with
one change will belong to the same haplotype. Population variants fall into two
categories. (1) Mutations can be neutral, silent changes that have no bearing on amino
acid sequence or the functional properties of mtDNA These changes in populations are
termed polymorphisms. (2) Deleterious mutations, however, can also become fixed in
populations if they are expressed later in life and have no affect on the reproductive
fitness of an individual. As more and more sequences are compared between and within
popUlations, more discriminatory markers are found and sub-haplotypes are created
within existing haplotypes. Haplotype creation, essentially the classification of
discriminatory markers, has been made possible with the help of computer aided
phylogenetic analysis based on the pairwise comparison of sequences or restriction
insights into human evolution. Cann et al. (1987) demonstrated, by phylogenetic analysis
of the mitochondrial genome, that all modern humans could be placed on one
.'1
phylogenetic tree rooted in Africa 200,000 years ago. An assumption in this analysis is,
however, that the rates of mutation (and hence presumably mutation fixation) have
remained constant in evolutionary history (Kocher et al., 1989). Analysis of more recent
human radiations from the timing of human population expansions (e.g. Sherry et al.,
1994) to the determination of ethnicity progression (for review see Torroni and Wallace,
1994) have all been possible with phylogenetic analysis using mtDNA.
Mitochondrial DNA diseases
As mtDNA has few intergenic spacers and mutations occur at random positions, the
coding region accumulates many mutations. Whilst relaxed codon usage limits the damage
these mutations may do, many are known to be deleterious. All 13 polypeptides encoded by
mtDNA are integral to OXPHOS, therefore deleterious mutations invariably cause a decrease
in ATP production. fu addition to the 13 polypeptides, the 22 tRNAs and 2 rRNAs can also
contain deleterious mutations. As no nuclear encoded tRNAs are imported into mitochondria
from the cytoplasm, mutations in the tRNA genes can have severe effects on mitochondrial
protein synthesis. An increasing number of diseases have been attributed primarily to mtDNA
mutations (for review see Brown and Wallace, 1994). Many of these diseases share similar
characteristics of inheritance and penetrance. fu genu and somatic cells, there are many
mitochondria, frequently interconnected, but all containing many copies of mtDNA All
mtDNA mutations initially exist as a single copy of mtDNA in a cell of an individual. These
mutations, providing they do not affect replication, are reproduced when the mtDNA
replicates. During mitosis, the mutation containing mtDNA segregates either randomly or
selectively to daughter cells. Cells, tissues, or individuals that have more than one type of
mtDNA are said to be heteroplasmic. Cells can withstand a certain amount of deleteriously
mutant mtDNA before they are phenotypically affected. The point at which the abnormal
phenotype becomes detectable is called the threshold, and is dependent on the balance of
ATP requirement and optimal ATP production. The threshold can vary between cells and
tissues, and depends on the type of mutation and whether there are other changes that can act
as secondary mutations. Deleterious mutations (with exceptions) are seldom passed on as
6
inherited heteroplasmically for a number of generations. All mutations go through a state of heteroplasmy. Selectively advantageous or neutral mutations tend to become fixed to homoplasmy or get lost rapidly, with the rate often exceeding that expected by chance alone (Hauswirth and Laipis, 1982). In some instances heteroplasmic changes are fixed to homoplasmy in as little as one generation, but in others they are maintained in a heteroplasmic state, for many generations (Howell et al., 1996) (see Chapter 4). The mechanisms for maintenance of heteroplasmy are poorly understood, but may involve selective amplification of rare 'alleles' within developing oocytes, a so called 'bottleneck' effect (poulton, 1995). Given that all mtDNA mutations must go through a state of heteroplasmy, and that the mtDNA mutation rate is high, one would expect that heteroplasmy is common. However, until recently, little heteroplasmy has been found.
Heteroplasmy (discussed in Chapter 4), and indeed mtDNA diseases, can be divided into two groups according to the nature of the mutations. Those caused by nucleotide substitutions and those caused by irisertions and deletions. Nucleotide substitutions can occur anywhere in the mtDNA, but when causing disease, the changes usually occur in the conserved nucleotides in the protein coding region or tRNA or rRNA coding regions. For example Leber's hereditary optic neuropathy (LHON), a maternally inherited form of adult acute-onset vision loss, can be caused by a number of nucleotide substitutions. Sixteen LHON mutations have been characterised to date, 11 of which occur in the mitochondrial ND genes (from OXPHOS complex 1). The most common of these changes is a G ~ A transition at nucleotide (nt) 11778 (Wallace et al., 1988) which is present in over 50% of LHON patients. It changes a conserved arginine to a histidine residue in ND4. In addition to primary mutations there are a number of characterised secondary mutations that are mildly deleterious, accumulate over time, and predispose an individual to LHON. Such mutations require additional factors to cause LHON, and therefore are generally associated with late onset of the disease (Howell et al., 1993). Primary LHON mutations are frequently homoplasmic. Between LHON lineages, incomplete penetrance and the presence or absence of secondary mutations creates a complex population picture of mitochondrial diseases.
proteins. Likewise an A
-+
G at nt 3243 within tRNALeu(UUR) causes mitochondrial encephalopathy, lactic acidosis, and stroke like episodes (MELAS) (penn et al., 1992). Both MERFF and MELAS are generally heteroplasmic, with the severity of the phenotype being directly dependent on the percentage of mutant DNA in cells, tissues, and individuals; and the age of the patient. The age of the patient is thought to be important because older people do not have as efficient OXPHOS as younger people, possibly because of a lifetimes' accumulation of secondary mutations in post-mitotic tissues. Therefore, a small proportion of mutant DNA may create a disease phenotype in an older person, while a larger proportion of the same mutant is needed to produce the disease phenotype in a younger person (Shoffuer et al., 1990). Mitochondrial DNA diseases caused by nucleotide substitutions typically require a tissue to have greater than 80% mutant DNA for a disease phenotype to manifest itself. As mentioned, this threshold is both age and tissue specific. The earliest affected tissues (those with the lowest threshold and highest ATP demand) have been characterised as brain, kidney, heart, and liver (in this order) (Brown and Wallace, 1994). In addition, type I muscle fibres are readily affected, and if present in the pancreatic islet cells, mutations that cause a reduction in OXPHOS inhibit insulin secretion leading to late onset diabetes (type IT).8
Because of the decreased length of the molecule, replication is faster than for normal length molecules, and therefore the deleted molecule increases in proportion temporally in affected individuals. Conversely, mtDNA insertions causing Pearson's syndrome incorporate both replication origins. The doubling of replication origins in inserted molecules presumably leads to an increase in replication and could explain the selective enrichment of these larger molecules characteristic of this syndrome (Brown and Wallace, 1994).
Neutral mtDNA mutations
In addition to the above insertion and deletion events, all of which are heteroplasmic and deleterious, there are a number of presumably silent insertion and deletion events characterised. A 9 bp deletion within an intergenic spacer between COlI and tRNALys is commonly found in Afiican, Polynesian and some American Indian populations (eg. Sykes et al., 1995). In the same intergenic spacer, a simple 4 bp homopolymeric insertion has been seen presumably caused by replication slippage (discussed in Chapter 3). In the D-Ioop such homopolymeric insertions are frequently seen in heteroplasmy, with variable lengths of tracts being added. All of these insertions and deletions are, however, assumed to be neutral, given that they cause no phenotypic effects, even in homoplasmy.
The assignment of nucleotide sequence changes as either polymorphisms or deleterious mutations is difficult. Riordan-Eva and Harding (1995) used a number of criteria to distinguish between the two. Firstly, deleterious mutations should be found specifically in individuals with the disease and not in normal individuals. Secondly, the mutations should change a highly conserved nucleotide or amino acid. Thirdly, the mutations should not be found with other disease causing mutations. Fourthly, the mutations should be heteroplasmic, with a large amount of mutant DNA being required before the mutant phenotype is displayed.
The predominantly uniparental maternal inheritance of mtDNA creates interesting
selection issues. Any mutation affecting males is effectively neutral on a population level
because:
"Maternally transmitted mutations that enhance male fitness tend not to
increase deterministically within populations, since their beneficial
effects on males are not rewarded by increased representation among
later generation progeny; and fetransmitted alleles with
male-limited deleterious effects may be retained simply because of relaxed
direct selection against their loss" Avise (1991).
In fact a germ-line mitochondrial mutation with severe effects on males, but only mild
effects on females, could increa:se to relatively high population frequencies because
natural selection of mitochondria occurs only in females.
At least one maternally inherited mitochondrial disease affects males more
severely than females. Between 75 and 85% of individuals affected by LHON are male
(Brown and Wallace, 1994). As mentioned, 16 distinct base-pair substitutions in
germline mtDNA have been directly associated with this disease. Linkage analysis
initially suggested that a deleterious X-linked mutation in combination with defective
mitochondria may be the cause of this sex bias (Vilkki et al., 1991). Juvonen et al.
(1996) and others found no further evidence for this, and indeed an analysis of
X-inactivation by Oostra et al. (1996) further argues against an X-linked effect to this sex
bias. Males may just be more susceptible to the mitochondrial defects. Wallace (1992)
suggests that men may have a higher optic nerve metabolic rate than women, and
therefore a lower threshold. Theoretically male-female dimorphism is possible in a
number of tissues, including the heart (Frank and Hurst, 1996).
Males germ cells (sperm) may be preferentially affected by deleterious mtDNA
mutations. Sperm have around 50 copies of mtDNA held in 13 mitochondria,
spirally-arranged in the sperm midpiece (Folgef0 et al., 1993). There is tight coupling between
10
the mitochondria being used to drive the flagellum and propel the sperm (e.g. Kao et al.,
1995). It must be noted, however, that much of the ATP used in flagellar action is derived from glycolysis, not OXPHOS (Ford and Harrison, 1981). Additionally, within
fertile men, the level of seminal A TP is not predictive of fertilising potentiae (Cummins
et al., 1994). Reduced power output translates directly into reduced motility and
probably reduced fertilising potential. The effect that deleterious mtDNA mutations, have
on sperm and ultimately fertilising potential through ATP reduction, however, has to be
weighed against the fitness effects in females. If the same effects are seen in females in
other tissues, then these changes will be rapidly selected against and lost, and the
ultimate effect on population male fertility will be low.
Human male fertilising potential
Fifteen percent of couples have problems conceiving. Of these, 30% are due to a
male cause, with another 20% being related to incompatibility of both partners. Infertility
(or subfertility) is difficult to define as it is related to a couple's mutual potential to
reproduce. The World Health Organisation (WHO, 1992) defines infertility as an inability
to conceive after 12 months of regular intercourse. Lack of male fertilising potential can
be attributed to a variety of factors. Based on WHO guidelines (WHO, 1992) a male is
considered to have normal fertilising potential if his ejaculate sperm count is greater than
20 x 106 spermfrnl of semen, at least 50% of which are motile, and at least 50% having
normal morphology. Values below these yield the clinical conditions oligozoospermia,
asthenozoospermia, and teratozoospermia respectively.
Low male fertilising potential can be caused by a large number of factors that can
be divided into five categories. Obstruction of excurrent testicular or ejaculatory ducts
accounts for 7 to 15% of low male fertilising potential. Testicular lesions causing
spermatogenic failure account for a further 30%. These lesions may include testicular
trauma, varicocele, genital tract infection or Y -chromosome deletions. Erectile or
ejaculatory problems, whilst rare, can also cause fertilising potential decrease; as can
endocrine disorders, such as hypogonadotropic hypogonadism. The most frequent cause,
however, is termed idiopathic sperm dysfunction (Le. dysfunction with no known
drug or alcohol use, smoking, environmental factors, and undetermined genetic factors.
F ertiHsing an egg is a chance event. The ability to fertilise an egg in vivo is
enhanced with larger numbers of highly motile sperm with normal morphology.
Conversely, the chances are reduced with fewer active sperm. In this sense, an ejaculate
of seminal fluid can be considered as a tissue. A 20% decrease in motility could decrease
an individual's fertilising potential by an equal amount, possibly rendering the affected
couple effectively infertile. The very tight coupling between mitochondrial energy
production and motility, and between motility and fertilising potential suggests that if
deleterious mtDNA mutations were present within sperm they could potentially cause a
reduction in fertilising potential (Frank and Hurst, 1996). This has been demonstrated in
a number of studies (e.g. Folgero et al., 1993; Kao et al., 1995).
There are two types of deleterious mtDNA mutations that have been shown to
possibly affect male fertilising potential. Firstly, mtDNA deletions within the testes have been
correlated with spermatogenic failure, resulting in severe oligozoospermia. Cummins et al.
(1993) first showed that spermatogenic failure in a 36 year-old man might be caused by .
premature testicular aging as a result of a 4977 bp deletion in the mitochondrial genome, a
deletion which was first described in normal heart muscle and brain of older people
(Cortopassi et al., 1992). Kao et al. (1995) then showed that such mutations were relatively
common in oligozoospermic men, but were also found in normal men. Significantly, they
showed that the proportion of the mutation present in the semen correlated very well with the
sperm motility (r -0.98, Kao et al., (1995); Fig. 3 therein), supporting the tight coupling
between mitochondrial energy production and motility. Others, however, have not found such
a good correlation (St John et aI., 1997). Lee et al. (1994) could not detect the mutation in
the testes until the age of 60 years. The mechanisms causing these deletions are unknown.
Cummins et al. (1994) speculates that the deletions are created in the testes by premature
testicular aging due to an ischaemic injury. Recent evidence that mutations can be induced in
rat testes by ischaemic iQjury supports this hypothesis (AM. Jequier, pers. comm.). The
presence of the mtDNA mutation within testes could explain the lack of mature sperm being
produced (oligozoospermia) whilst the mutation presence in sperm may explain a reduction in
12
Mitochondrial DNA point mutations have also been found in cells within semen.
Folgef0 et al. (1993) demonstrated that a 50 year old male patient with MERRF with an A ~
G transition at nt 3243 in the mitochondrial tRNA Leu{UUR) gene also had reduced sperm
motility. Although the proportion of mutant DNA within the testes was not stated, blood
platelet DNA from other members of the proband's family had between 13 and 59% mutant
DNA (Folgere et al., 1995). The effect on fertility was noted by seminal substrate therapy.
Different energy substrates can enter the electron transport chain (ETC) at different positions.
For example, glucose and lactate are both metabolised to pyruvate which enters the ETC in
complex L Succinate, however, bypasses complex 1, and increases ATP production at
complex III and possibly complex IV. In this way, if complex 1 is affected by mtDNA
mutations, ATP production can be increased with the addition of succinate. Incubation of
semen in succinate selectively increased the motility of sperm from the proband whilst having
limited effect on semen of control samples (Folgef0 et al., 1993). Therefore, it was concluded
that the motility of sperm was directly affected by this mtDNA mutation. Contrary to Folgef0
et ai's report, Huang et al.(1994) failed to detect changes in the sperm motility of a patient
with MELAS who had the same tRNA mutation. They estimated that 30% of amplified
mtDNA from cells within semen contained the mutation, and found that sperm motility was
not different from control samples. They did not, however, demonstrate that the mutation
was present in sperm
per se,
only in seminal cells, and did not attempt to increase motility bysubstrate therapy. Semen is a mixture of different cell types, frequently containing leucocytes,
immature spermatids, and epithelial cells from spermatogenic ducts. All of these will
contribute mtDNA to a seminal preparation. These two conflicting reports, however, show
that it is still unclear whether point mutations in sperm mtDNA can affect sperm function.
All of the above sperm mtDNA mutations have known deleterious effects in
other tissues. As suggested earlier, a decrease by 20% of sperm motility may cause a
pathological reduction in fertilising potential. Given the coupling between energy
production and motility, this could be caused by a 20% proportion of deleteriously
mutant mtDNA with the sperm. No other tissue is likely to be affected by a proportion
this low in males, and indeed no tissue in females will be affected at all. This then begs
the question: 'Could the threshold of seminal fluid, to withstand the effects of mtDNA
mutations, be very low?' Given that there is no selection against mtDNA mutations in
males, these mutations may be relatively common, as long as the fitness effect when the
fertilising potential is presently unknown.
This study was instigated to analyse some of the above phenomena. When
examining the effect mtDNA mutations have on male fertilising potential, there are two
possible approaches to the problem. The first method involves recruiting subjects with
known mitochondrial disease and investigating their seminal parameters (akin to the
work of Folgef0 et al., 1993). However, there are a number of problems with this
approach. Firstly, the number of patients in New Zealand with defined mitochondrial
disease is small. Secondly, patients with defined mitochondrial disease are often severely
affected, frequently not living to reproductive age. And thirdly, an analysis of the
fertilising potential in patients with mitochondrial disease is not predictive of the
incidence of reduced fertilising potential being caused by mtDNA mutations in the
general population. Because of these reasons a different approach was taken in this
study. This involved recruiting patients in an infertility clinic and screening seminal
samples for mtDNA variation. Like the earlier approach, this has shortcomings. The
mitochondrial genome is large and point mutations are small. Because of this only three
coding genes are screened for mutations in the present study. As the work ofFolgef0 et
al. (1993) showed substrate therapy can ameliorate the effects of some mitochondrial
defects. Given that these substrates (such as succinate) may be naturally present in
semen, we hypothesised that mutations in complexes that cannot be by-passed by natural
substrates may show greater phenotypic effects than mutations in complexes that can.
Therefore in this study, the ATPase 6 and 8 genes from the FoP 1 A TP synthase
(unofficially called complex V) and the COIl gene from complex IV were screened for
mutations. Recent studies carried out in our laboratory on complex I genes found no
heteroplasmy associated with fertilising potential (S.l O'Carrol, unpublished MSc thesis,
University of Canterbury, 1996). The work reported here, therefore, is part of an on
14
The aims of the present study are:
1. To instigate a (biased) population study of mtDNA variability in the semen samples
from men presenting samples to an andrology clinic in Christchurch, New Zealand.
2. To screen mtDNA protein coding genes ATPase 6, ATPase 8 and COlI for sequence
variability.
3. To investigate correlations between the presence or absence ofmtDNA mutations and
seminal quality.
4. To characterise new mtDNA heteroplasmy within human sperm for the analysis of:
a. Fertilising potential
Chapter 2
ATPASE 6 AND 8 GENE MUTATIONS
Introduction
The ATPase amplicon
The mitochondrial FoFl ATP synthase utilises an electrochemical gradient, generated by the electron transport chain, to synthesise ATP from ADP
+
Pi. Called complex V, this ATP synthase (incorrectly but commonly called an ATPase) along with the electron transport chain complexes (I, II, ill, IV) and adenine nucleotide translocator constitute the mitochondrial energy generating pathway, OXPHOS. Intact ATP synthase was first isolated from bovine heart mitochondria in 1974 (Hatefi, 1993). Mammalian mitochondrial FoP! ATP synthase is composed of at least 13 polypeptides, two of which (ATPase 6 and ATPase 8) are encoded by the mitochondrial genome and syntllesised in the mitochondria. ATPase 8 is also commonly called A6L. The coding regions of ATPase 6 and 8 overlap by 46 nucleotides (8537 - 8572, numbering from the Cambridge sequence) at the 5' end of ATPase 6. ATPase 6 and 8 have different reading frames (Anderson et al., 1981). Both ATPase 6 and ATPase 8 are found within the Fo subunit of FoPl ATP synthase. This subunit acts as a membrane anchor and proton pore, facilitating proton movement through the inner mitochondrial membrane across an electrochemical gradient. Within the Fo pore, it is thought that ATPase 8 is in a 1 : 1 molar ratio with the pore itself (Hekman etat.,
1991), It is anticipated that ATPase 6 is in the same molar ratio, consistent with ATPase 6 and ATPase 8 both being transcribed on the same mRNA. In addition to the two mitochondrial subunits, five additional nuclear encoded subunits malce up the Fo pore (Hatefi, 1993).The structure of ATPase 8 is presently unknown. Hekman et
at.
(1991) demonstrated that parts of ATPase 8, including its C-terminus, were exposed on the matrix side of the inner mitochondrial membrane in bovines. Consistent with the lack of known stlUcture is the lack of known function, and the lack of pathogenic mutations affecting stlUcture and function.16
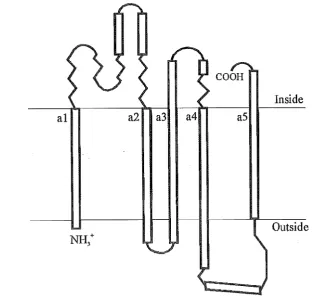
important for its function in the FoP 1 ATP synthase. Cox et al. (1986) proposed a five
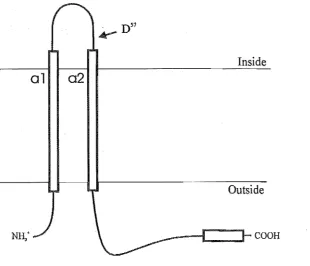
transmembrane helix (a1 - as) secondary structure model for both the E. coli and human proteins (Fig. 2.1). Homology studies, site-directed mutagenesis studies and naturally occurring mutations have provided evidence that conserved residues in helix a4 are essential in allowing the Fo subunit of the FoPl ATP synthase to function as a proton pore (for review see Senior, 1990).
COOH
Inside
a1 a2 a3 a4 as
[image:22.569.113.430.199.504.2]Outside
Figure 2.1. Proposed structure oftbe human ATPase 6 protein (modified from Cox et al., 1986). Membrane
spanning helicies are labelled al - a5. Inside and outside refer to the orientation within the inner mitochondrial membrane.
Five deleterious mutations have been identified in the ATPase 6 gene. The most common of these is a T
-+
G transversion at nt 8993. It changes a highly conserved leucine to an arginine at residue 156 in helix a4 of the ATPase 6 protein (Holt et al., 1990). A T-+
C transition at the same position has been seen, changing the Leu156 to a proline (de Vries et al.,symptoms. Leu156 is considered to be an integral residue for proton translocation across the inner mitochondrial membrane as demonstrated in E coli and yeast studies (de Vries et al., 1993). A T --+ C transition at nt 8851 has been described in a patient with bilateral striatal necrosis (similar to Leigh's disease) (de Meirleir et al., 1994). This mutation changes tryptophan residue 109 to an arginine in helix a3. Similarly, aT --+ C transition at nt 9176 was found in two brothers, also with bilateral striatal necrosis (Thyagarajan et al., 1995). This alters the highly conserved leucine residue 217 to a proline. The mutation only manifested phenotypically when the proportion of mutant DNA was greater than 98%. Leu217 is in the C-terminus of ATPase 6, a region which has been proposed to be involved in proton translocation (Hartzog and Cain, 1993). A T --+ C transition at nt 9101 has been associated with LHON (see Chapter 1) (Lamminen et al., 1995). However, the affected proband and three unaffected maternal relatives all had this change in homoplasmy. Additionally, the amino acid residue affected (Del92) within helix a5 is very weakly conserved even in vertebrates.
Based on these last two points the T --+ C at nt 9101 may at best be a secondary mutation.
The incidence of mtDNA defects causing a decrease in male fertilising potential is presently unknown. Since mutations in the ATPase 6 and 8 genes are known to affect the phenotypes of individuals carrying the mutations and the protein products of these genes are integral products of complex 5, the penultimate OXPHOS complex, and as such can not be bypassed by natural energy substrates (see Chapter 1), a mutation in these genes may affect sperm function.
The aims of the present study were to assess the variability in the ATPase 6 and 8
,
genes and identify mutations in these genes in a Christchurch male population and to determine if these mutations can be related to the fertility status of the individuals carrying the mutations.
18
was used (Orita et al., 1989). SSCP relies on the fact that when single stranded DNA is
cooled quickly it folds up on itself forming a secondary structure. When separated through
non-denaturing polyacrylamide gels, these secondary structures have a mobility dependent on
both size and shape. A difference of one base pair between two otherwise identical DNA
fragments frequently changes the shape of one and hence creates a mobility shift with respect
to the other.
Matetials and Methods
Sample collection
Subjects were recruited from couples who presented for semen analysis at
Christchurch Women's Hospital between January 1994 and the January 1997. Included in this
group are couples who have male factor infertility, female factor infertility, or infertility of
unknown aetiology. Additionally, semen from some donors involved in the donor
insemination program and samples produced prior to long term storage were included.
Ethical approval was obtained from the Southern Regional Health Authority Ethics
Committee (Canterbury). The donors gave consent for the residue of their semen samples
(after routine semen analysis) to be used for research. Semen samples were produced by
masturbation after 3 - 5 days of abstinence. The semen samples were analysed at the
Atfdrology Laboratory, Christchurch Women's Hospital, according to standard criteria
(WHO, 1992). Whole semen samples were transferred frozen to the Zoology Department,
University of Canterbury, thawed on ice and re-aliquoted to 100 I-li aliquots. These aliquots were snap frozen to -80°C for long term storage. For confidentiality reasons, sample
information used in this study was restricted to non-identifYing sample codes with sperm
counts, sperm motility, seminal volume and year of birth of the donor. All screening in this
study was non-biased. Samples were sequentially chosen from the pool irrespective of count
or motility. Within the sample pool there are cases of repeated samples from donors.
For ATPase amplicon screening, 210 semen samples were analysed with a mean
count of 69 x 106 sperm/ml (± 78), a mean sperm motility of 48% (± 20) and a mean
donor age (at time of donation) of 36. Full details of the samples used in this screening
Cell DNA isolation
The preferential purification of mitochondrial DNA generally requires large volumes of starting tissue. Frequently, after routine semen analysis, the volume of semen obtained for this study was under 100 Ill. Therefore in seeking a DNA extraction protocol the following points were considered. (1) Sperm have relatively less mtDNA than other tissue types, (2) the volume of sample was a limiting factor, and (3) if possible all seminal mtDNA had to be available for PCR (see Chapter 4). For the above reasons a modified buccal cell alkaline lysis protocol (Lench et al., 1988) was used for the extraction of mtDNA from semen. This method requires little manipulation, can be performed in a single tube (ensuring no loss of DNA by repeated extractions), and is ideal for small volumes of starting material.
Semen samples were thawed on ice. Cells were pelleted from 5 ~tl aliquots by centrifuging at 4,500 x g, 4°C for 10 min (Jouan MR 14.11 centrifuge). The cell pellet was washed with 400 ~ of 100 mM NaCI, 10 mM EDTA (pH 8.0), then re-centrifuged as before. The cell pellet was resuspended in 40 ~tl of 50 mM NaOH by vortexing, then boiled for 15 min and neutralised with 10 ~tl of 1 M Tris-HCI (pH 8.0). Ten-microlitre aliquots were frozen at -20°C until further use. The impurity of this DNA preparation meant that no quantification of DNA could be made, suffice as to say that between 2.5 and 5 III of prepared DNA was sufficient for PCR amplification irrespective of the cell count of the original semen sample.
In one instance mtDNA was isolated from whole blood by first lysing red cells in a 50 ~ll aliquot of whole blood with 1 ml of 0.14 M NH4Cl. This was shaken gently for 10 min before pelleting white cells in a bench top microfuge at 550 x g for 2 min. The cells were washed with 1 ml of 0.14 M NRtCI and pelleted again as before. The pellet was resuspended in 400 ~LI of 50 mM NaOH and boiled for 15 min as above then neutralised with 100 III of 1 M. Tris (pH 8.0). Five-microlitre aliquots provided sufficient template for PCR amplification.
Polymerase chain reaction
20
sites, did not anneal to themselves or each other with high affinity and had melting points above 50°C for high specificity binding. The primers chosen were HMTL817 (5' CAATGCTCTGAAATCTGTGG) and HMTH934 (5' tagtatgaggagcgttatgg). These primers amplifY a 1174 bp ATPase amplicon between nt 8186 and nt 9341 (numbering from the Cambridge sequence). The ATPase amplicon encompasses genes for ATPase 6, ATPase 8, tRNALys, 101 bp of COIl and 134 bp of COllI. PCR conditions for the ATPase amplicon were optimised for MgCh concentration and annealing temperature.
For the analysis of the ATPase amplicon, a 5 ~Ll aliquot of total cell DNA was subjected to 30 cycles of touchdown PCR in a 25 ~LI reaction. The 25 ~Ll reaction mixtures contained 20 pmol of each primer, 5 nmol of each dNTP, 2.5 J..ll of 10 x reaction buffer (500 mM KCI, 100 mM Tris-HCI (PH 9.0», 2 mM MgCb and 0.75 units of
Taq
polymerase (Promega or Boehringer Mannheim). The cycling parameters were an initial five cycles of 94°C/30 sec, 60°C/30 sec; andnocll
min 20 sec followed by a further five cycles of 94°C/30 sec, 56°C/30 sec, and 72°CIl min 20 sec. This was followed by 20 cycles of 94°C/30 sec, 54°C/30 sec, and 72°CIl min 20 sec. Prior to initiation of the PCR, reaction mixes were equilibrated at 80°C for between 2 and 5 min. This equilibration step was found to be essential for highly specific, and efficient product formation. Thennal cycling was performed in two different PCR cyclers (Perkin Elmer 480 and MJ Research PTC 100) with no product variability being seen between these machines.Mutation Detection
electrophoresed on 5% non-denaturing polyacrylamide gels (49010 acrylamide : 1%
bis-acrylamide) (Appendix 2) for 8 hours (4°C, 200 V). Gels were pre-run to equilibrate in 45
ruM Tris-HCI, 45 ruM Orthoboric acid and 1 ruM EDTA (0.5 x TBE). Gels were fixed and silver stained using a modification of the protocol of Bassam et al. (1991) (Appendix 2).
Band densities, where appropriate, were determined from dried gels using a hand held
scanning densitometer and Biomed Image Analysis software (Advanced American
Biotechnology, Fullerton, CA).
Undenatured DNA, when electrophoresed on SSCP gels gave single bands that
did not interfere with scoring of denatured bands. To assign fragment sizes to denatured
bands, both of the ATPase amplicon Taql fragments were isolated from agarose gels
individually by either a 'freeze and squeeze' protocol (Towner, 1993) or using a
commercial gel extraction kit (BioRad or Boehringer Mannheim) and were
electrophoresed as denatured and undenatured forms on SSCP gels.
!
Where changes in SSCP pattern were observed during screening, the samples
were analysed again to confirm the change in pattern. The ATPase amplicons from
samples with consistently different patterns were then cleaved with different restriction
endonucleases and re-analysed bySSCP analysis. The DNA fragments carrying the
nucleotide changes were identified by comparing the mobilities of the fragment bands
with those of the controls.
Each of the two single strands (ssDNA) of a fragment of double stranded DNA
(dsDNA), when denatured and allowed to form a secondary structure, will fold
differently. Because of this, each fragment, a single band when undenatured, will move as
two bands in an SSCP geL On occasion, one of the single strands may form more than
one stable secondary conformation; creating three or more bands representing the
original dsDNA fragment. A homo plasmic or polymorphic change can be recognised by
one or both of the ssDNA bands having altered gel mobility when compared with a
control sample. While a heteroplasmic change can be identified when one or more new
22
1
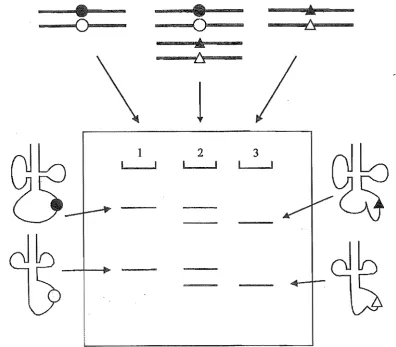
1 2 3
Figure 2.2. Diagrammatical representation of SSCP analysis. Circles represent normal bases with triangles being the mutated counterparts at the same position. Filled and empty shapes represent bases on different strands of the sanle fragment. When resolved, homoplasmic normal samples give two bands per fragment as shown in lane 1. Heteroplasmic samples (lane 2) have both normal bands (as lane 1) and one or two additional bands representing the mutant strands. Lane 3 represents a homoplasmic mutant where one or both of the bands runs in a different position to the normal (lane 1).
Single cell analysis and sequencing
[image:28.569.92.489.56.403.2]infonnatively, single cells can be isolated, and the DNA amplified and analysed. As different
cells have different proportions of mutant mtDNA in heteroplasmy, mutant enriched cells can
be analysed and the mutant mtDNA sequenced. This procedure was chosen for the analysis of
an ATPase amplicon heteroplasmy in two samples from one individual ( see results).
Single cells were aspirated from a 1,000 times diluted semen sample under oil using
micromanipulation techniques. Briefly, 1 rom D.D. glass needles (Clark Electromedical
Instruments) were pulled to a 2 [lm O.D tip using a Narishige microelectrode puller. Tips
were ground to a 45° bevel with an inner hole diameter of 5 !lID using a Narishige EG-7
microgrinder. Needles were sterilised by baking at 150°C for 4 hours and then exposing to
UV. light for 20 min. Cells were resuspended in PBS (120 mM NaCI, 16 mM Na$IP04, 4
mMNaHiP04 (PH 7.3» at 10,000 cells per ml and 20 [ll was transferred to the base ofaLux 5221 tissue culture dish. This drop was covered in sterile mineral oil (Sigma) to prevent
optical edge effects and cells were visualised under a Leitz Diavert inverted microscope.
Single cells were aspirated into the bevelled tip of a needle held in an M3301
Micromanipulator (World Precision Instruments). The fine control for cell pick-up was
provided by holding pressure from a PV830 Pneumatic Picopump (World Precision
Instruments) attached to a N2 gas supply. When cells other than single spenn were analysed,
needle hole diameter was increased to between 10 and 20 [lm. Cells were transferred to a
drop of mineral oil in the cap of 0.5 ml Eppendorf tubes for DNA extraction and subsequent PCR amplification. Two and a half microlitres of 200 mM KOH and 50 mM DTT was
added to the cells and they were incubated for between 10 and 30 min at 65°C. This
solution was neutralised with 2.5 ~LI neutralising buffer (300 mM KCI, 900 mM Tris
(pH8.3), 200 mM HCI) (Cui et al., 1989).
The 5 [ll solution containing the lysed cell was directly subjected to a PCR
amplification of one cycle of 94°C/3 min, 40 cycles of 94°C115 sec, 50°C1l5 sec, and
nocll
min, and one cycle of nOC/5 mm usmg primers HMTL822
(5' ATTCCCCTAAAAATCTTTGAAA) and HMTH897 (5'tgagtaggctgatg). This 25 [ll
reaction contained 2.5 pmol of each primer, 2.5 nmol of each dNTP, 2.5 [ll of 10 x reaction r<
buffer (500 mM KCl, 100 mM Tris-HCI (PH 9.0», 2 mM MgCh and 0.5 units of
Taq
24
was then re-amplified using a hemi-nested PCR protocol. Primer HMTH897 was joined by
the internal primer HMTL854 (5'TCATTCATTGCCCC) to amplify a 430 bp fragment using
the same cycling conditions as above. Primer quantities were increased to 5 pmol and the
MgCh concentration for this internal PCR was 1 mM. Conditions for the above PCR reactions are based on Lien et al. (1993). A 1.5
J.lI
aliquot ofthe second PCR product wasdirectly analysed by SSCP analysis as before. In addition to single cells and cellular aggregates
being analysed in this way, seminal fluid controls were taken. Five microlitres of seminal fluid
suspended in PBS was centrifuged for 10 min at 12,000 x g to pellet all cells. That there were
no cells in suspension was checked in a Makler counter (Makler, Israel). Aliquots of seminal
fluid were then treated as before to prepare DNA and subjected to the same PCR reactions
and SSCP analysis.
Cycle sequencing of the 430 bp PCR product and other PCR products containing
homoplasmic changes was carried Qut using a Gibco BRL dsDNA cycle sequencing system
with primers HMTL817, HMTL854, HMTH897 and HMTH934. To obtain purified PCR
product for sequencing, products from a number ofPCR reactions were pooled. An equal
volume of 3 M ammonium acetate was added, followed by two volumes of isopropanol.
DNA was precipitated for 10 min at room temperature before being pelleted by
centrifugation at 12,000 x g for 10 min at room temperature. The DNA pellet was
washed with 500
J.lI
70% ethanol, spun as before, air dried and resuspended in TE8. Onepicomole of the appropriate primer was isotopically end labelled with y32p or
i
3p ATP(-3,000 Cilmmol) and included in the appropriate reaction with 50 fmol of template
DNA. The PCR conditions used for sequencing were 20 cycles of 95°C/30 sec, 50°C/30
sec and 70°CIl min followed by 10 cycles 95°C/30 sec and 70°C/l min. Sequencing gels were pre-run at 1500 V, 35 - 45 mA for 1 hour. Individual sequencing mixes were
heated to 80°C for 2 min and rapidly cooled on ice. Two microlitres of denatured sample
was used for sequencing. Gels were run at 1500 - 1700 V with a constant current of 35
rnA per gel in a BRL S2 sequencer. After electrophoresis the gels were dried onto backing paper in a Biorad 583 gel drier and exposed to X-ray film (Kodak X-OMAT
AR) for different lengths of time ~epending on their radioactive counts. Films were
Results
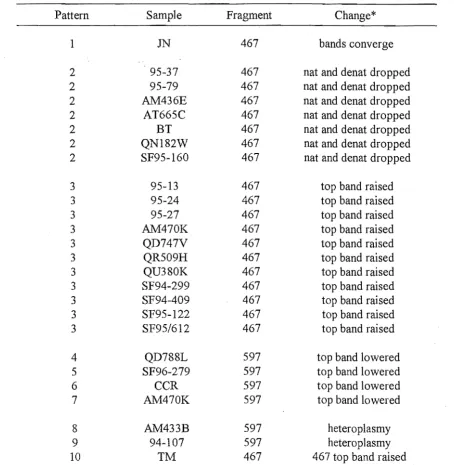
Six different SSCP patterns were seen from the screening of the Taql cleaved
ATPase amplicon from 210 semen samples (Table 2.1). The most common pattern (not
shown in Table 2.1) is assumed to represent the Cambridge sequence as this is a
consensus sequence of European origin. For a full list of screened samples see Appendix
1.
Of the 210 samples screened, 31 % were oligozoospermic 48% of these being
severely oligozoospermic
«
5 x 10⁶ sperm/ml) (excluding missing data), 49% of sampleswere asthenozoospermic. A strong correlation exists between reduced sperm count and
motility in this sample group (S. Richards, unpublished Masters Thesis, University of
Canterbury, 1996). A number of individuals have known seminal defects including Y
chromosome micro-deletions (N, Kerr, unpublished Masters Thesis, University of
Canterbury, 1997). Additionally, not all seminal samples contain the same cell types. A
number of samples were from individuals who have undergone vasectomies reducing the
cells in the semen to peripheral leucocytes and possible epididymal cells. There were a
number of samples that were obtained from seminal swimup or gradient procedures.
These procedures enrich the semen sample in motile sperm.
Pattern 1 (Fig. 2.3a) within sample EV, a drop in the bottom 789 nt band, is
indicative of a homoplasmic change. This pattern was reproducible from different PCRs
from the same semen sample but was not found in any other semen sample. When the
EV ATPase amplicon was cleaved with Apal the bands representing the 1016 bp
fragment showed a mobility shift when compared with control semen samples (Fig.
2.3b). Bands representing fragments 753 bp and 558 bp, generated by cleavage with
Seal and Hinfl respectively, also showed mobility shifts when compared with control
samples (Fig. 2.3b). The overlapping region between all of the fragments showing
mobility shifts was between the Hinfl cleavage site at nt 8784 and the Taql cleavage site
at nt 8958. Therefore, it was hypothesised that pattern 1 was caused by a homoplasmic
26
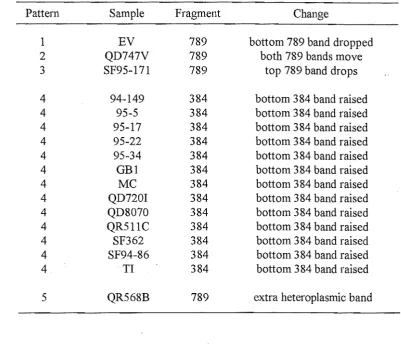
Table 2.l. SSCP patterns that differed from the control pattern after Taql digestion of the ATPase amplicon of 210 semen samples.
Pattern Sample Fragment Change
1 EV 789 bottom 789 band dropped
2 QD747V 789 both 789 bands move
3 SF95-171 789 top 789 band drops
4 94-149 384 bottom 384 band raised
4 95-5 384 bottom 384 band raised
4 95-17 384 bottom 384 band raised
4 95-22 384 bottom 384 band raised
4 95-34 384 bottom 384 band raised
4 GB1 384 bottom 384 band raised
4 MC 384 bottom 384 band raised
4 QD720I 384 bottom 384 band raised
4 QD8070 384 bottom 384 band raised
4 QR511C 384 bottom 384 band raised
4 SF362 384 bottom 384 band raised
4 SF94-86 384 bottom 384 band raised
4 TI 384 bottom 384 band raised
5 QR568B 789 extra heteroplasmic band
Full length EV ATPase amplicon was prepared in duplicate and the region of
interest was sequenced using primers HMTL854 and HMTII897. A G
-+
A transition atnt 8860 was the only change seen in both amplification and sequencing reactions and was
. .
seen in all sequenced strands (Fig. 2.3c). This transition changes a threonine codon
(ACA) to an alanine codon (GCA) therefore changing the amino acid assignment at
residue 112 of the ATPase 6 polypeptide. Given that the G
-+
A transition at nt 8860was the only change seen it was concluded that this transition created pattern 1.
Patterns 2 (Fig. 2Aa) and 3 (Fig. 2.5a) within semen samples QD747V and
SF95-171 respectively, had mobility changes in the 789 nt Taq1 bands when compared
with the control pattern. Patterns 2 and 3 were reproducible from PCRs from the DNA
extractions from the same semen samples but were not found in any other samples.
Cleavage of the QD74.7V and SF95-171 ATPase amplicons with Hinfl and Rsa1 and
[image:32.569.80.482.86.437.2]30
corresponding to fragments of 558 bp and 411 bp respectively (Fig. 2.4b). Therefore, the
overlapping region between all of the fragments showing mobility shifts is between the
Hinfl cleavage site at nt 8784 and the Taql cleavage site at nt 8958 for both patterns 2
and 3.
Full length QD747V and SF95-171 ATPase amplicons were prepared in
duplicate PCRs and the region of interest was sequenced using primers HMTL854 and
HMTH897. A G ---+ A transition at nt 8856 was the only change seen in duplicated
amplification and sequencing reactions from QD788L and was seen in all sequenced
strands (result not shown). This mutation changes an alanine codon (GCG) to another
alanine codon (GCA) therefore not changing the amino acid assignment at residue 110 of
the ATPase 6 polypeptide. Given that the G ---+ A transition at nt 8856 was the only
change seen it was concluded that this created pattern 2. A G ---+ A transition at nt 8839
was the only change seen in both amplification and sequencing reactions of SF95-171
and was seen in all sequenced strands (Fig. 2.5b). This mutation changes an alanine I
codon (GCC) to a threonine codon (ACC) thereby changing the amino acid assignment
at residue 105 of the ATPase 6 polypeptide. Given that the G ---+ A transition at 8839
was the only change seen it was concluded that this created pattern 3. This change also
created a HaeIII RFLP with the loss of the HaeIII restriction site centred at nt 8840.
Pattern 4 (Fig. 2.6), a change in the mobility of bands representing the 384 bp
Taql fragment, was seen in 13 semen samples. This pattern was indicative of a
homoplasmic change. When the screening of semen samples showing pattern 4 was
repeated, this pattern was frequently not seen again indicating that the mobility shift with
respect to controls was very condition specific. Because of the variability in band shifting
it is likely that 13 semen samples with this pattern is an underestimate. When semen
samples with pattern 4 and controls were cleaved with HaeII, those with pattern 4 had a
Haell RFLP due to the loss of a restriction site at position nt 9056 (not shown). The loss
of this site has been seen previously and defines European haplotype K. European
haplotype K is found in 7.4% of Caucasians (Torroni et al., 1994) and has been seen in
" t
all cited Caucasian populations studied to date. No study has defined the common
nucleotide change that leads to this haplotype, however. This study is no exception.
male with primary infertility due to oligo-astheno-teratozoospermia. He had a normal blood follicle stimulating hormone level and the two semen samples analysed were: 4.3 mI with a count of 0.3 x 10⁶ sperm/m1, 20% motility; and 4.6 mI with 0.9 x 10⁶ sperm/m1, and 17% motility. Both samples had large numbers of immature forms (spermatids), and a reduced forward progression (I.L. Sin, pers. comm). Only the second sample (QD205F) had enough spelm for a morphology assessment, and it showed 100% abnormal heads, as assessed by WHO criteria (1992). Both samples tested negative for a peroxidase test indicating that there are fewer than 1 x 10⁶ peripheral blood lymphocytes per mI of semen. Scanning densitometry of SSCP gel bands from 12 different PCR reactions from either of the two DNA samples indicates that 16% ofthe PCR amplified DNA contains the mutation (x
=
16.3%, s=
2.5%).An analysis of the peripheral lymphocytes from this donor also revealed the presence of the same heteroplasmic mutation, with 18% mutant DNA (x = 17.8%, s = 6.36%). Silver staining
is, however, only semi-quantitative so these estimates have errors of unknown magnitude associated with them.
: l ~
The mutation causing pattern 5 was narrowed down by cleavage of the PCR product nt- ,
with Seal and subsequent SSCP. Theheteroplasmic mutation was in a 753 bp Seal fragment (Fig. 2.7b). Double digestion of thtt QR568B ATPase amplicon with Taq1 and Seal
delineated the heteroplasmic mutation to a 369 bp fragment between nt 8589 and nt 8958 with no heteroplasmy being seen in any of the other fragments (Fig. 2.7c).
Oligonucleotide primers HMTL854 and HMTH897 were designed, flanking this region, with the resultant 430 bp PCR product containing the heteroplasmy when tested by SSCP analysis. In an effort to obtain an enriched sample of mutant DNA for sequencing, single cell analysis was initiated. Semen samples QR568B and QD205F contained a range of cells other than mature sperm. These included epithelial cells, red blood cells, white blood cells, and various forms of immature sperm (spermatogonia, spermatocytes and spermatids). Identification of these cells is very difficult but is often clinically important. Neutrophils (white blood cells) can be determined, when live, by the peroxidase staining test but this method is crude and inaccurate. Other than this, electron microscopy is the only reliable method of positively identifying these cell types (Glover et
34
agglutination of sperm to other cell types as is seen in QR568B and QD205F. Because of
the confusion over cell identity, cells were categorised into classes based on size. The
classes and the most probable cell types that they represent are listed in Table 2.2. Cell
counts of QD205F indicate that there are high numbers of large round cells (9.4 x 10⁶
Iml (n 4» and even higher numbers of small round cells (40.2 x 10⁶/ml (n = 4».
Two hundred and fifty four single cells and aggregates were analysed by PCR.
Ninety five of these gave positive PCR signals and were further analysed by SSCP. The
results of these are summarised in Table 2.3 with the raw data appearing in Appendix 3.
Two from 30 seminal fluid controls gave positive PCR results, both having a normal
[image:40.569.67.494.344.499.2]SSCP pattern. Tllis indicated that there was some extra cellular DNA in solution.
Table 2.2. Classed cell types found in semen samples QR568B and QD205F. Classes were used in single cell analysis, when individual cells are unidentifiable.
Class
I II
III
IV
V
VI
VII
Description
tiny, spherical transparent bodies single small round cells
single large round cells
single sperm
single large irregular cells clmllped cells other than sperm clumped sperm
Probable cell types
possibly cytoplasmic droplets? spermatids
Epithelial cells, spermatogonia, spermatocytes and leucocytes single sperm
rnacrophages (?)
clumped class II and/or III
[image:40.569.73.492.543.726.2]clumped sperm often with sperrnatids
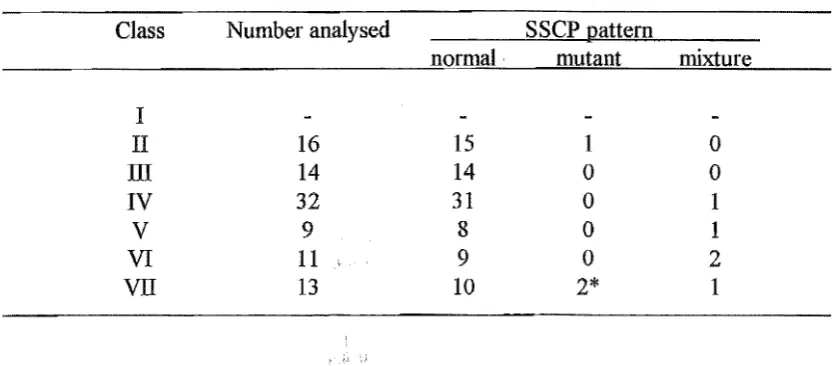
Table 2.3. Summarised single cell and aggregate data for cells that gave positive PCR signals. *; mutant patterns with negligible amounts of normal DNA that were used for sequencing.
Class Number analysed SSCP nattern
normal· mutant mixture
I
II 16 15 1 0
III 14 14 0 0
IV
32 31 0 1V
9 8 0 1VI 11 9 0 2