ORIGINAL RESEARCH
Functional MR Imaging on an Open 1T MR
Imaging System: Exploiting the Advantages of an
Open MR Imaging System for Functional MR
Imaging
E. van de Giessen P.F.C. Groot J. Booij W. van den Brink D.J. Veltman A.J. Nederveen
BACKGROUND AND PURPOSE: Open MR imaging scanners are designed for imaging of specific patient groups that cannot be routinely scanned with conventional MR imaging scanners (eg, patients with obesity and claustrophobia). This study aims to determine whether BOLD sensitivity on an open 1T scanner is adequate for fMRI for diagnostic and research purposes by directly comparing fMRI results with a standard 3T MR imaging scanner. The optimal TE was also determined.
MATERIALS AND METHODS: Twelve healthy adults were scanned by using both an open 1T scanner and a standard 3T scanner. Gradient-echo echo-planar images were acquired for all subjects while performing motor and affective paradigms, each at 5 different TEs per scanner (range, 40 – 80 ms at open 1T; 20 – 40 ms at 3T). To compare BOLD sensitivity between scanners and TEs, we determined maximum statisticaltscores per TE for all relevant brain areas (motor cortex, visual cortex, amygdala, and OFC) for individual subjects and group analyses. Additionally, T2* values were determined per scanner for the relevant brain areas.
RESULTS: Maximumtscores were significantly lower in the relevant brain areas on the open 1T compared with the 3T for single subjects but not for group analyses. The optimal TE for fMRI on an open 1T MR imaging system was found to be approximately 70 ms.
CONCLUSIONS:Although for single-subject studies as used in diagnostics, 3T was found to be superior, fMRI on an open 1T MR imaging scanner is suitable for research designed to analyze data at a group level.
ABBREVIATIONS:AAL⫽automated anatomic labeling; BOLD⫽blood oxygen level– dependent; EPI⫽echo-planar imaging; FA ⫽flip angle; fMRI ⫽functional MR imaging; MNI ⫽Montreal Neurological Institute; Nd⫽nondetectable; OFC⫽orbitofrontal cortex; TE⫽echo time; TR⫽ repetition time
O
pen MR imaging scanners are designed to scan specific patient groups that cannot be routinely scanned with con-ventional MR imaging scanners (eg, patients with obesity and claustrophobia and young children) and to facilitate perform-ing interventions while scannperform-ing (eg, lumbosacral injec-tions).1In particular, the rising number of patients withmor-bid obesity increases the need for adequately sized equipment for this patient group.2,3This need can be met by the
availabil-ity of vertical-field open MR imaging scanners with vertical instead of cylindrical bores. However, advanced applications, such as fMRI, are not yet well-explored on open MR imaging scanners. fMRI is used to investigate neuronal activity by mea-suring BOLD contrast in the brain and can be conducted on conventional MR imaging scanners in both clinical and re-search settings. Successful application of fMRI on an open MR
imaging scanner could make this technique available for the above-mentioned patient groups.
Most fMRI studies have been conducted on conventional MR imaging systems with a magnetic field strength ofⱖ1.5T, whereas the current standard for fMRI is at 3T. In contrast, the maximum available magnetic field strength of open MR im-aging systems is currently only 1T. Magnetic field strength affects BOLD sensitivity and has a positive linear relationship with the signal intensity–to-noise ratio.4,5Therefore, it is
ques-tionable whether an open MR imaging system with a lower magnetic field strength can be used for fMRI. To date, only a small number of studies have been published using fMRI with standard 1T scanners,6-9testing motor,6,8,9visual,7language,6 and executive9functions. Whereas these studies indicated that
fMRI is feasible for these functions at a magnetic field strength of 1T, to our knowledge, fMRI has not been tested on an open MR imaging scanner.
Apart from the magnetic field strength, various other scan-ning parameters may also affect the BOLD contrast. An im-portant parameter is TE. At the optimal TE, contrast in T2* relaxation is maximal between brain regions with low and high levels of deoxyhemoglobin concentration, assumed to reflect differences in regional neural activity.10Theoretically, the op-timal TE coincides with the local T2* but also depends on the magnetic field strength of the scanner.
The aim of this study was 2-fold. The first aim was to
in-Received June 18, 2010; accepted after revision September 9.
From the Departments of Nuclear Medicine (E.v.d.G., J.B.) and Radiology (P.F.C.G., A.J.N.), and Amsterdam Institute for Addiction Research (W.v.d.B., D.J.V.), Academic Medical Center, University of Amsterdam, Amsterdam, the Netherlands
Paper previously presented as a traditional poster at: International Society for Magnetic Resonance in Medicine, May 1–7, 2010; Stockholm, Sweden.
Please address correspondence to Elsmarieke van de Giessen, MD, Department of Nuclear Medicine (F2N), Academic Medical Center, Meibergdreef 9, 1105 AZ Amsterdam, the Netherlands; e-mail: [email protected]
indicates article with supplemental on-line table.
DOI 10.3174/ajnr.A2383
FUNCTIONAL
ORIGINAL
vestigate whether BOLD sensitivity on an open MR imaging scanner with a field strength of 1T is suitable for fMRI for diagnostic and/or research purposes. The second aim was to identify the optimal TE for fMRI on the open 1T scanner. To this end, both motor and affective paradigms were performed by healthy subjects while being scanned at different TEs in an open 1T MR imaging scanner, the results of which were com-pared with those from a standard 3T MR imaging scanner, also acquired at different TEs.
Materials and Methods
Subjects
Twelve normal-weight healthy adults without claustrophobia (5 men,
7 women; age, 26.7⫾2.4 years; range, 23–32 years; 10 right-handed,
1 left-handed, 1 ambidextrous) were included in the study. None of the subjects had a history of head trauma, seizures, or brain pathol-ogy; a current psychiatric or neurologic illness; or current use of psy-chotropic medication. All subjects gave written informed consent for the study, which was approved by the local medical ethics committee.
Experimental Design
All subjects underwent 2 scanning sessions on an open 1T whole-body scanner (Panorama; Philips Best, the Netherlands) and 1 scan-ning session on a 3T whole-body scanner (Intera; Philips Healthcare) on different days. In both scanners, the subjects performed a motor paradigm 5 times and an affective paradigm 5 times, both scanned at 5 different TEs in random order. The motor paradigm was a finger-tapping task consisting of 5 rest blocks alternating with 5 blocks of right-handed finger-tapping, cued by a visual stimulus. During each block, 10 functional MR imaging scans were acquired, resulting in 100 scans per task. The affective paradigm consisted of 5 blocks of neutral pictures, 5 blocks of positive valence pictures, and 5 blocks of pictures of negative valence, presented in pseudorandom order. Positive and negative valence pictures were intended to induce positive and nega-tive emotions, respecnega-tively, by displaying, for example, a happy child or a disgustingly dirty toilet. Pictures were selected from the Interna-tional Affective Picture System data base (csea.phhp.ufl.edu/media. html). Five different versions of the affective task were used so that subjects viewed each picture only once, to control for habituation
effects. Each picture was shown for 3500 ms. Each block lasted 10 scans, resulting in 150 scans per session.
Imaging Parameters
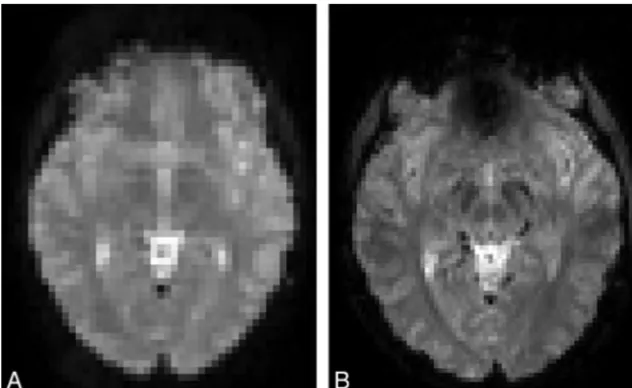
During each paradigm, gradient echo-planar images were acquired with optimal protocol settings for both scanners (Fig 1). Scanning parameters for the open 1T scanner were the following: TR, 3200 ms;
FA, 90°; matrix, 64⫻64; voxel size, 3.4⫻3.4⫻4.5 mm; 27 sections;
no parallel imaging; gap, 0.45 mm; ascending scan order. On the open 1T scanner, a 4-channel head coil was used. Scanning parameters for the conventional 3T scanner were based on our standard fMRI
pro-tocol: TR, 2600 ms; FA, 90°; matrix, 96⫻96; voxel size, 2.3⫻2.3⫻
3.0 mm; number of sections, 40; parallel imaging (sensitivity encod-ing) factor, 2.5; gap, 0.3 mm; ascending scan order. On the 3T scan-ner, an 8-channel head coil was used. To determine the optimal TE, a range of 5 different TEs was chosen per scanner (open 1T: 40, 50, 60, 70, 80 ms; 3T: 20, 25, 30, 35, 40 ms). Additionally, T2* maps were acquired on both scanners as an extra tool to determine the optimal TE per scanner by using a multiecho 2D gradient-echo sequence (TR, 110 ms; 20 echoes; echo spacing, 4 ms starting at 1.6 ms; FA, 30°; other scanning parameters were identical to the EPI protocols). High-reso-lution T1-weighted 3D images (TR/TE, 9.8/3.3 ms; FA, 8°; matrix,
256⫻256; voxel size, 1.2⫻1.2⫻1.2 mm; number of sections, 120)
were acquired on the conventional 3T MR imaging scanner for ana-tomic reference.
Statistical Analysis
Functional scans were analyzed by using SPM5 (Wellcome Depart-ment of Imaging Neuroscience, London, United Kingdom). All scans underwent slice-timing correction, motion correction, coregistration to the anatomic reference scan, and normalization to the standard MNI 152 brain, including resampling to 3.0-mm isotropic voxels and
spatial smoothing (Gaussian kernel, full width at half maximum⫽8
mm). One scanning session was excluded from analysis because of motion exceeding 2 mm (affective task scan on an open 1T scanner;
TE, 40 ms). Next, a statisticaltmap was created per individual for each
scanning session (ie, per TE for both motor and affective paradigms).
Maximum statisticaltscores were determined in preselected brain
areas—that is, left motor cortex (AAL: left precentral gyrus) for the
[image:2.594.135.451.43.237.2]motor paradigm, and visual cortex (AAL: left and right calcarine sul-cus, left and right lingual gyrus, left and right cuneus, left and right inferior and medial occipital cortex), amygdala (AAL: left and right amygdala), and OFC (AAL: left and right superior, medial, and infe-rior OFC) for the affective paradigm. These areas are known to show BOLD signal-intensity changes by the paradigms used.
For the single-subject analyses, the mean maximum statisticalt
scores for 12 subjects were calculated for each area of interest for each TE. In addition, group analyses of the 12 subjects were performed for
each TE for both paradigms by a mixed-effect 1-samplettest analysis.
On the statisticaltmaps of the group analyses, the maximum
statis-ticaltscores were again determined in the preselected brain areas. For
both single-subject and group analyses, activity-correlated signal-in-tensity changes were considered undetectable when none of the voxels
in the preselected brain areas reached atvalue⬎1.65 (P⬎.05,
uncorrected). Maximumtscores per brain area were used to compare
BOLD sensitivity among different TEs and between the 2 scanners, both at single-subject and group levels. For comparison of the results
of the single-subject analyses between the 2 scanners, attest was used
to compare the highest mean maximumtscores per brain area. For
comparison of the results of the group analyses between the 2
scan-ners, the group results of the TE with the highesttscores were
com-pared with a paired-samplesttest in SPM5 for each brain area.
The T2* maps were analyzed in the Functional MR Imaging of the Brain Software Library (www.fmrib.ox.ac.uk/fsl). On the basis of the signal-intensity decay in the multiecho readout, we calculated the T2* value per voxel. The maps were coregistered to the standard MNI 152 brain. Next, an average T2* map of the 12 scans for each scanner was made, to allow comparison of T2* values between various field strengths. The T2* values for the voxels with the same MNI
coordi-nates as the voxels in which the highesttscores were found for the
relevant brain areas were determined on the basis of the average T2* maps for both scanners.
Results
Task-correlated signal-intensity changes were detectable in the left motor cortex and visual cortex in all individual subjects for all TEs on both scanners. On the open 1T scanner, no task-correlated signal-intensity changes were detectable in 14 of 59 sessions in the right amygdala, 9 of 59 sessions in the left amygdala, 4 of 59 sessions in the right OFC, and 8 of 59 ses-sions in the left OFC. On the 3T scanner, there were no detect-able task-correlated signal-intensity changes in 6 of 60 sessions in the right amygdala, 11 of 60 sessions in the left amygdala,
and 3 of 60 sessions in the right OFC. In the left OFC, signal-intensity changes were detectable in all scans on the 3T scan-ner. Sessions in which the task-correlated signal-intensity changes were nondetectable were evenly distributed over the subjects.
When comparing the results on the open 1T scanner with those on the 3T scanner, we found the maximumtscores per TE for the single-subject analyses to be lower on the open 1T than on the 3T scanner (On-line Table) for all brain areas (left motor cortex,P⫽.002; right visual cortex,P⫽.006; left visual cortex,P⫽.002; right OFC,P⫽.018; left OFC,P⫽.001) except for the amygdala (right,P⫽.294; left,P⫽.351). In the group analyses, thetscores were generally lower on the open 1T (Fig 2), but this difference was only significant for the right OFC (P⬍.001).
The maximumtscores per brain area in the individual and group analyses were found at different TEs on both scanners. On the open 1T scanner, the highesttscores in the left motor cortex were found at TEs of 70 and 80 ms; in the visual cortex and in the amygdala, at 50, 70, and 80 ms; and in the OFC, at 40, 60, and 70 ms (On-line Table). On the 3T scanner, a TE of 40 ms resulted in the highesttscores in the left motor cortex, whereas for the visual cortex, the highesttscores were found at 20, 25, and 40 ms. For the amygdala, the highesttscores were found at 20, 25, 30, and 35 ms and for the OFC at 20 and 30 ms (On-line Table).
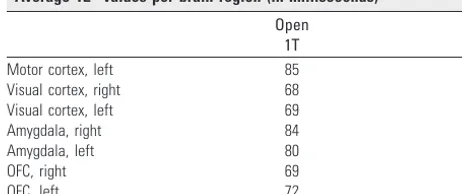
[image:3.594.55.534.42.153.2]The average T2* values per brain region are shown in the Table. For the open 1T scanner, these varied from 68 ms in the right visual cortex to 85 ms in the left motor cortex and for the 3T scanner, from 35 ms in the left amygdala to 55 ms in the left motor cortex.
Average T2* values per brain region (in milliseconds)
Open
1T 3T
Motor cortex, left 85 55
Visual cortex, right 68 40
Visual cortex, left 69 43
Amygdala, right 84 36
Amygdala, left 80 35
OFC, right 69 39
OFC, left 72 41
[image:3.594.302.533.241.338.2]Discussion
On the open 1T MR imaging scanner, task-related signal-in-tensity changes were detectable in all brain areas of interest with the group analyses. Only in the left amygdala, the activity was not detectable at 2 TEs, though at the other 3 TEs, it was detectable withtscores up to 5.7. For the individual analyses, task-related signal-intensity changes in the amygdala and OFC were detectable in fewer subjects on the open 1T scanner than on the 3T MR imaging scanner. Also,tscores per brain area were significantly lower on the open 1T scanner for all areas, except the amygdala. In addition,tscores in the amygdala and OFC were low to moderate (t⬍3.0), below standard thresh-olds for multiple comparisons even within a region-of-interest approach. These findings, therefore, indicate that the open 1T scanner lacks adequate sensitivity to detect task-related signal-intensity changes in the amygdala and OFC in individual subjects.
In contrast to these single-subject results, group analyses failed to show significant differences between data acquired on both scanners, with the exception of right OFC activity during presentation of emotional pictures, though thetscores per brain area were generally lower on the open 1T scanner than on the 3T MR imaging. This finding indicates that at a group level, loss of BOLD sensitivity on the open 1T scanner is only modest compared with a state-of-the-art 3T scanner. A likely explanation is that for single-subject analyses within-subject variance is a key factor, whereas for random effects group anal-yses, between-subject variance is essential. In the present study, between-subject variance was similar for open 1T and 3T systems, analogous to results from studies comparing fMRI on 1.5T and 3T MR imaging scanners.11-13
In the present study, we chose to compare 1T versus 3T results on the basis of optimal settings for each platform. Re-sults for different TEs showed that for the open 1T scanner, a TE of 70 ms resulted in overall highesttscores across brain areas for the group analyses. In the single-subject analyses, the highesttscores were found at 80 ms for brain areas that are not prone to susceptibility artifacts (left motor cortex and visual cortex) and at lower TEs (50 –70 ms) in areas where suscepti-bility artifacts may affect the signal intensity (amygdala, OFC). From these results, we may conclude that overall, a TE of 70 ms is presumably optimal for detecting BOLD contrast for an open 1T MR imaging scanner. However, when focusing on neural activation in the motor or visual cortex, especially in individual studies, one may consider choosing a TE higher than 70 ms. In contrast, when regions of interest include the amygdala or OFC, one should choose a TE lower than 70 ms. This suggestion is in line with previous research indicating that regions that are affected by susceptibility-induced BOLD sensitivity losses should be scanned with a reduced TE, due to faster signal-intensity decay in those regions.14
In contrast to these findings on an open 1T system, in the present study, establishing an optimal TE for the 3T scanner proved to be less straightforward. Group analyses showed that the highesttscores in the amygdala and OFC were obtained at or below a TE of 30 ms, whereas for the left motor cortex the highesttscores were found at 40 ms, and in the visual cortex, at both 20 and 40 ms. Single-subject analyses revealed a similar pattern with an optimal TE for the motor cortex at 40 ms but with TEs below 30 ms for the other brain areas. Therefore, a TE
below 30 ms is generally advisable when performing fMRI on a 3T scanner, except when focusing on dorsolateral cortical areas such as the motor cortex.
Contrary to our expectations, for the 3T scanner, the TE curves did not show a unimodal pattern (ie, a single optimal TE for each brain region). Fera et al11have reported previously
that there is likely to be a broad range of optimal TEs when scanning subjects who perform motor tasks at a TE range of 30 –200 ms on 1.5T and 3T scanners. In the present study, the wider range in TEs that we chose for the open 1T scanner (40 – 80 ms) may explain why we were able to determine opti-mal TEs for this scanner but not for the 3T scanner. In addi-tion, we observed large intraindividual variability between ses-sions, which appeared to be independent of TEs. McGonigle et al15have shown earlier that within-subject between-session
differences are an inherent part of the fMRI technique and should be taken into account when evaluating a single session of a single subject.16
The T2* values for the open 1T MR imaging scanner were observed to range from 68 to 85 ms, in agreement with our findings that a TE around 70 ms is optimal for the current fMRI protocol. Most surprising, the lowest T2* values on the open 1T scanner were found for the visual cortex, which is not particularly prone to susceptibility-induced signal-intensity decay. Possibly, this finding may reflect the fact that at a lower field strength susceptibility-induced signal-intensity drop-out is reduced. For the 3T, the broad TE optimum that we ob-served only partly overlaps with the range in T2* values that we found; the fastest signal-intensity decay was in the amygdala as expected due to susceptibility artifacts in this region.
This study tested the BOLD sensitivity on an open 1T MR imaging system for motor and affective paradigms. These par-adigms were chosen because they are well-validated and known to induce robust BOLD signal-intensity changes in specific brain regions, including areas that are prone to sus-ceptibility artifacts. However, it remains to be established whether similar results can be obtained for other paradigms. Another potential limitation of this study is that the scans on open 1T MR imaging were acquired in 2 subsessions com-pared with 1 session on the 3T MR imaging. This was done because the overall scanning protocol on the open 1T lasted longer as a result of the necessarily longer TR for the echo-planar images for fMRI and longer scanning times for the T2* map without parallel imaging. However, because the motor and affective paradigms were scanned in random order on both scanners, we are confident that this issue has not con-founded our results. Finally, this study included only healthy subjects and not subjects who were obese or claustrophobic, patient groups for whom the open 1T MR imaging scanner has been designed among other things. These patient groups may more often show suboptimal image quality due to subject mo-tion or body habitus, though even in these subjects who are highly obese, the effects of subcutaneous fat tissue around the brain on image quality will be small compared with, for exam-ple, the abdomen. However, these possible effects should be taken into account in studies with these patient groups.
Conclusions
scan-ner is less suitable for single-subject studies. The optimal TE range for fMRI on the open 1T MR imaging scanner is approx-imately 70 ms. The use of fMRI on an open 1T MR imaging scanner provides research opportunities for studying groups that are otherwise difficult to enroll, such as patients with claustrophobia and obesity.
References
1. Streitparth F, Walter T, Wonneberger U, et al.Image-guided spinal injection procedures in open high-field MRI with vertical field orientation: feasibility and technical features.Eur Radiol2010;20:395– 403
2. Uppot RN, Sahani DV, Hahn PF, et al.Impact of obesity on medical imaging and image-guided intervention.AJR Am J Roentgenol2007;188:433– 40 3. Uppot RN, Sahani DV, Hahn PF, et al.Effect of obesity on image quality:
fifteen-year longitudinal study for evaluation of dictated radiology reports.
Radiology2006;240:435–39
4. Gati JS, Menon RS, Ugurbil K, et al.Experimental determination of the BOLD field strength dependence in vessels and tissue. Magn Reson Med
1997;38:296 –302
5. Okada T, Yamada H, Ito H, et al.Magnetic field strength increase yields sig-nificantly greater contrast-to-noise ratio increase: measured using BOLD contrast in the primary visual area.Acad Radiol2005;12:142– 47
6. Papke K, Hellmann T, Renger B, et al.Clinical applications of functional MRI
at 1.0 T: motor and language studies in healthy subjects and patients.Eur Radiol1999;9:211–20
7. Lundervold A, Ersland L, Gjesdal KI, et al.Functional magnetic resonance imaging of primary visual processing using a 1.0 Tesla scanner.Int J Neurosci
1995;81:151– 68
8. van der Kallen BF, van Erning LJ, van Zuijlen MW, et al.Activation of the sensorimotor cortex at 1.0 T: comparison of echo-planar and gradient-echo imaging.AJNR Am J Neuroradiol1998;19:1099 –104
9. Boghi A, Rampado O, Bergui M, et al.Functional MR study of a motor task and the tower of London task at 1.0 T.Neuroradiology2006;48:763–71
10. Bandettini PA, Wong EC, Jesmanowicz A, et al.Spin-echo and gradient-echo EPI of human brain activation using BOLD contrast: a comparative study at 1.5 T.NMR Biomed1994;7:12–20
11. Fera F, Yongbi MN, van GP, et al.EPI-BOLD fMRI of human motor cortex at 1.5 T and 3.0 T: sensitivity dependence on echo time and acquisition band-width.J Magn Reson Imaging2004;19:19 –26
12. Meindl T, Born C, Britsch S, et al.Functional BOLD MRI: comparison of dif-ferent field strengths in a motor task.Eur Radiol2008;18:1102–13 13. van der Zwaag W, Francis S, Head K, et al.fMRI at 1.5, 3 and 7 T: characterising
BOLD signal changes.Neuroimage2009;47:1425–34; Epub 2009 May 14 14. Weiskopf N, Hutton C, Josephs O, et al.Optimized EPI for fMRI studies of the
orbitofrontal cortex: compensation of susceptibility-induced gradients in the readout direction.MAGMA2007;20:39 – 49
15. McGonigle DJ, Howseman AM, Athwal BS, et al.Variability in fMRI: an exam-ination of intersession differences.Neuroimage2000;11:708 –34