ORIGINAL RESEARCH
The Added Value of Apparent Diffusion
Coefficient to Cerebral Blood Volume in the
Preoperative Grading of Diffuse Gliomas
A. Hilario A. Ramos A. Perez-Nun˜ez E. Salvador J.M. Millan A. Lagares J.M. Sepulveda P. Gonzalez-Leon A. Hernandez-Lain J.R. Ricoy
BACKGROUND AND PURPOSE:In cerebral gliomas, rCBV correlates with tumor grade and histologic findings of vascular proliferation. Moreover, ADC assesses water diffusivity and is inversely correlated with tumor grade. In the present work, we have studied whether combined rCBV and ADC values improve the diagnostic accuracy of MR imaging in the preoperative grading of gliomas.
MATERIALS AND METHODS: One hundred sixty-two patients with histopathologically confirmed diffuse gliomas underwent DWI and DSC. Mean rCBV and ADC values were compared among the tumor groups with the Studentt test or ANOVA. ROC analysis was used to determine rCBV and ADC threshold values for glioma grading.
RESULTS: rCBV had significantly different values between grade II and IV gliomas and between grade III and IV tumors, but there were no significant differences between grade II and III gliomas (P⬎.05). Grade II and III tumors also did not differ when astrocytomas, oligodendrogliomas, and oligoastrocy-tomas were considered separately. ADC values were significantly different for all 3 grades. The ADC threshold value of 1.185⫻10⫺3mm2/s and the rCBV cutoff value of 1.74 could be used with high sensitivity in the characterization of high-grade gliomas. The area under the ROC curve for the maximum rCBV and minimum ADC was 0.72 and 0.75, respectively. The combination of rCBV and ADC values increased the area under the ROC curve to 0.83.
CONCLUSIONS:ADC measurements are better than rCBV values for distinguishing the grades of gliomas. The combination of minimum ADC and maximum rCBV improves the diagnostic accuracy of glioma grading.
ABBREVIATIONS:DSC⫽dynamic susceptibility-weighted contrast-enhanced perfusion MR imag-ing; GBM⫽glioblastoma multiforme; GBM-O⫽glioblastoma with oligodendroglial component; IR ⫽ inversion recovery; rCBV ⫽ relative cerebral blood volume; ROC ⫽ receiver operating characteristic analysis; WHO⫽World Health Organization
G
liomas are the most common primary neoplasms of the brain in adults,1,2ranging in grade from low to high. Gli-oma grading is based on the histopathologic assessment of the tumor and is critical for planning therapeutic approaches and assessing prognosis and response to therapy.2AdvancedMR imaging techniques such as DSC and DWI provide phys-iologic information that complements the anatomic infor-mation obtained from conventional MR imaging.3-6 DWI
quantifies cellularity on the basis of the premise that water diffusivity within the extracellular compartment is inversely related to the content and attenuation of the intracellular space.7The higher the tumor cellularity and grade are, the
lower the ADC is because of decreased water diffusivity.6-8
However, other factors may be complicating this relationship:
ADC increases with increased edema and increased edema is seen in high-grade tumors. DSC provides noninvasive assess-ment of tumor vascularity and angiogenesis3-6,9through the examination of the degradation of signal intensity with time associated with the first pass of a bolus of paramagnetic con-trast agent.9 Because higher vascularity corresponds to a higher tumor grade, as the grade of the astrocytoma increases, the maximum tumor CBV tends to increase.3,6,7
The aim of this study was to evaluate the diagnostic accu-racy of combined ADC and CBV values in the preoperative differentiation of diffuse gliomas. Our objectives were the fol-lowing: 1) to calculate CBV and ADC values for diffuse glio-mas included in the study, 2) to establish whether there is any difference in rCBV and ADC values in gliomas classified by tumor grade and histology, 3) to estimate a cutoff CBV and ADC value for differentiation of high- and low-grade gliomas, and 4) to investigate whether combined CBV and ADC values improve the diagnostic accuracy of MR imaging.
Materials and Methods
Study Population and Histologic Analysis
We retrospectively reviewed data obtained during a 4-year period (December 2006 –November 2010) from patients with a histopatho-logically proved diagnosis of diffuse glioma who underwent an MR imaging study at our hospital.
Diagnoses were histologically confirmed by surgical resection or
Received May 12, 2011; accepted July 20.
From the Departments of Radiology (A.H., A.R., E.S., J.M.M.), Neurosurgery (A.P-N., A.L., P.G-L.), Medical Oncology (J.M.S.), and Pathology (A.H-L., J.R.R), Hospital 12 de Octubre, Madrid, Spain.
Paper previously presented at: Annual Meeting of the American Society of Neuroradiology, June 4 –9, 2011; Seattle, Washington.
This study was partially supported by grant PS09/01977 from the Spanish Subdireccio´n General de Evaluacio´n y Fomento de la Investigacio´n (Dr. Ricoy).
Please address correspondence to A. Hilario, MD, Department of Radiology, Hospital 12 de Octubre, Avenida de Cordoba s/n 28041 Madrid, Spain; e-mail: [email protected]
Indicates open access to non-subscribers at www.ajnr.org
http://dx.doi.org/10.3174/ajnr.A2846
BRAIN
ORIGINAL
biopsy. The tumor specimens obtained were examined by 2 experi-enced neuropathologists and graded as low-grade (grade II) and high-grade (high-grades III and IV) tumors according to the 2007WHO Classi-fication of Tumours of the Central Nervous System.10Based on this
classification, anaplastic oligoastrocytomas with necrosis are consid-ered GBM-O, though some neuropathologists continue to prefer the term “grade IV oligoastrocytoma” (a term that we have used in this article).
Conventional MR Imaging
Imaging was performed with a 1.5T scanner (Signa Excite; GE Health-care, Milwaukee, Wisconsin). We performed the following anatomic sequences: a 3-plane localizer sequence, sagittal T1-weighted with an IR technique (TR⫽2400 ms, TE⫽24 ms, IR⫽750), axial T2-weighted fast spin-echo (TR⫽4100 ms, TE⫽85 ms), and FLAIR (TR⫽8000 ms, TE⫽120 ms, TI⫽2000 ms). Postcontrast axial and coronal T1-weighted with an IR technique (TR⫽2400 ms, TE⫽24 ms, IR⫽750) images were obtained after the acquisition of the per-fusion MR imaging data. All data were obtained by using 4-mm-thick sections with a 1-mm skip, a 320⫻256 matrix, and an FOV of 24⫻ 24 cm.
Dynamic Contrast–Enhanced Perfusion MR Imaging
Dynamic contrast– enhanced T2*-weighted gradient-echo echo-pla-nar images were acquired during the first pass of a bolus of gadobutrol (Gadovist, 1 mmol/mL; Berlex Laboratories, Wayne, New Jersey) at a dose of 0.1 mmol/kg. Nineteen sections were selected for perfusion MR imaging to cover the tumor on the basis of T2-weighted and FLAIR images. Imaging parameters were as follows: TR/TE⫽2000/ 21.1 ms; FOV⫽26⫻26 cm; section thickness⫽4 mm with a 0.4-mm skip, a matrix of 128⫻128, and a flip angle of 90°. A series of 40 multisection acquisitions was acquired at 0.2-second intervals. The first 8 acquisitions were performed before the contrast agent was in-jected to establish a precontrast baseline. For the eighth acquisition, gadobutrol was injected at a rate of 5 mL/s with a power injector (Spectris Solaris EP; MedRad, Indianola, Pennsylvania) followed by administration of a 20-mL bolus of saline at 5 mL/s. Immediately before dynamic imaging, a prebolus dose (2 mL)11of gadobutrol was
administered to diminish any T1 effects that might result from agent extravasation.
DWI
DWI was performed before administration of contrast medium by using a single-shot spin-echo echo-planar imaging sequence with the following parameters: TR/TE⫽8000/78.2 ms, image acquisition in
the axial plane, 5-mm contiguous sections, number of sections⫽26, FOV⫽26⫻26 cm, acquisition matrix⫽128⫻128, b-values of 0 and 1000 s/mm2, diffusion gradient encoding in 6 orthogonal directions,
and a total scanning time of 1 minute 4 seconds.
Perfusion MR Imaging Data Evaluation
DSC images were processed on an Advantage Workstation by using FuncTool (GE Healthcare).
The beginning and the end of the first-pass bolus were determined through inspection of the time–signal-intensity curve and care was taken to exclude any recirculation-related signal intensity. Cerebral blood volume refers to the amount of blood in a given region of brain tissue at any time, commonly measured in milliliters per 100 g of brain tissue. Because the CBV must be expressed relative to an inter-nal reference, we normalized it by expressing ratios relative to values measured in the normal white matter of the contralateral lobe. We have referred to these relative values as rCBV.
Color-coded rCBV maps were generated to target regions of max-imum abnormality. Two neuroradiologists placed 3 ROIs within the tumor, on areas showing the highest intratumoral rCBV on the color-coded maps. The standardized ROI was 2–3 mm2, which was used for
most of the tumor and white matter measurements. Care was taken not to include large intra- or peritumoral vessels because these can confound perfusion measurements. The maximum rCBV value in intratumoral ROIs was selected for quantitative analysis and corre-lated with corresponding specimen histopathology. This method has been demonstrated to provide the most optimal interobserver and intraobserver reproducibility.12
DWI Data Evaluation
ADC maps and values were calculated by using commercially avail-able FuncTool software with the ROIs.
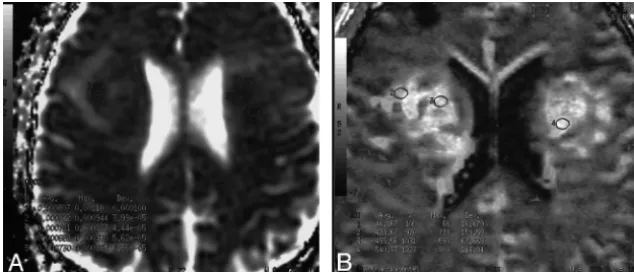
Five circular ROIs (areas ranging from 1 to 2 mm2) were manually
constructed by each neuroradiologist and placed over the whole tu-mor to select the region of the maximum hypointensity correspond-ing to the solid portion of tumor. Afterward, the minimum ADC ob-tained was selected for the analysis (Fig 1). ROIs values were expressed as 10⫺3mm2/s. The ROIs were carefully placed to avoid cystic, necrotic, and
hemorrhagic regions that might influence ADC values.
Statistical Analysis
An Access data base (Microsoft, Redmond, Washington) was created to track maximum rCBV, minimum ADC, and tumor grade of diffuse gliomas. Using the Statistical Package for the Social Sciences Version 12 software (SPSS, Chicago, Illinois), we performed statistical
[image:2.594.134.451.44.180.2]sis. Normality of distribution for all variables was determined by the Kolmogorov-Smirnov test. Mean rCBV and ADC values were com-pared among the tumor groups with the Studentttest or ANOVA. A
Pvalue⬍.05 indicated a statistically significant difference. An ROC curve analysis was obtained to determine the cutoff rCBV and ADC values that had the best combination of specificity and sensitivity for differentiating high- and low-grade gliomas. In the ROC curve, the size of the area under the curve indicated the degree of the relation-ship between rCBV or ADC values and the grade of the gliomas: the closer to 1, the stronger the relationship.
Results
Patient Population
The group consisted of 162 patients (97 men and 65 women), with ages ranging from 23 to 79 years. We investigated 32 low-grade (19.8%) and 130 high-grade gliomas (80.2%). Among high-grade tumors, 17.9% were diagnosed as grade III and 62.3% as grade IV. In regard to the histologic types, we included 119 astrocytomas, 27 oligodendrogliomas, and 16 oligoastrocytomas. The histopathologic diagnoses are pre-sented in Table 1.
Evaluation of rCBV Values for Glioma Grading
In the high-grade gliomas, the maximum rCBV ranged be-tween 0.87 and 14.60 (mean, 6.87⫾3.10). In the low-grade-glioma group, rCBV values ranged between 0.85 and 7.02 (mean, 2.36⫾1.44). rCBV measurements were significantly effective in grading glial tumors as low-grade and high-grade (P⬍.001).
If we consider grade II, III, and IV gliomas separately, rCBV values (mean) were 2.36⫾1.44; 3.77⫾2.82; and 6.87⫾3.10, respectively. Although some overlap of distribution was shown between the values of the 3 groups, rCBV values were statistically different between grade II and grade IV gliomas (P⬍.001) and between grade III and IV gliomas (P⬍.001). However, there were no statistically significant differences be-tween grade II and grade III gliomas (P⫽.157).
When only astrocytic tumors were considered, the rCBV values (mean) had statistically significant differences between high-grade (6.50⫾3.28) and low-grade tumors (2.11⫾1.58) (P⬍.001). If we investigated grade II, III, and IV astrocytomas separately, rCBV values were 2.11⫾1.58; 2.15⫾0.71; and 6.92⫾3.12, respectively. rCBV values were significantly dif-ferent between grade II and grade IV astrocytomas (P⬍.001) and between grade III and grade IV tumors (P⬍.001). How-ever, rCBV values were not significantly different between grade II and grade III astrocytomas either (P⫽1).
In the oligodendroglioma group, rCBV values (mean) were not significantly different between high-grade (4.36⫾2.80) and low-grade tumors (2.98⫾1.30) (P⫽.286).
In oligoastrocytomas, rCBV values (mean) showed statis-tically significant differences between high-grade (6.05 ⫾
3.44) and low-grade tumors (1.98⫾0.63) (P⫽.03). When we analyzed grade II, III, and IV oligoastrocytomas individually, rCBV values were 1.98⫾0.63; 5.30⫾4.34; and 6.30⫾2.97, respectively. There were no statistically significant differences between grade II and III (P⫽.573), between grade II and IV (P⫽.120), or between grade III and IV oligoastrocytomas (P⫽1).
When we compared grade II astrocytomas, oligodendro-gliomas, and oligoastrocytomas individually, rCBV values (mean) were 2.11⫾1.58; 2.98⫾1.30; and 1.98⫾0.63, re-spectively. There were no statistically significant differences in the rCBV values between astrocytomas and oligodendroglio-mas (P⫽.391), between astrocytomas and oligoastrocytomas (P⫽1), or between oligodendrogliomas and oligoastrocyto-mas (P⫽.733).
We also separated grade III gliomas into astrocytomas, oli-godendrogliomas, and oligoastrocytomas. rCBV values (mean) were 2.15⫾0.71; 4.36⫾2.80; and 5.30⫾4.034, respectively. There were no statistically significant differences in the rCBV values between astrocytomas and oligoastrocytomas (P ⫽
.267), between oligodendrogliomas and oligoastrocytomas (P⫽1), or between astrocytomas and oligodendrogliomas (P⫽.167).
On investigating grade IV astrocytomas and oligoastrocy-tomas, rCBV values (mean) were 6.92⫾3.12 and 6.30⫾2.97, respectively. Grade IV astrocytomas and grade IV oligoastro-cytomas showed no statistically significant differences in rCBV values (P⫽.698) (Fig 2).
Evaluation of ADC Values for Tumor Grades
The ADC values (mean) of solid tumor portions of the high-and low-grade gliomas were 0.7523⫾0.135 (⫻10⫺3mm2/s) and 1.2160⫾0.274 (⫻10⫺3mm2/s), respectively. Minimum
ADC values were significantly correlated in the discrimination of low- and high-grade gliomas (P⬍.001).
When grade II, III, and IV gliomas were separated, ADC values (mean) were 1.2160⫾0.274 (⫻10⫺3mm2/s), 0.9707⫾
0.228 (⫻10⫺3mm2/s), and 0.7472⫾0.131 (⫻10⫺3mm2/s), respectively. As we found in perfusion data analysis, some overlap of distribution was shown between the ADC values of grade II, III, and IV gliomas. Nevertheless, the difference in minimum ADC values was statistically significant among all 3 grades (P⬍.001).
When only astrocytomas were evaluated, ADC values (mean) were significantly different between high-grade [0.7750⫾0.1779 (⫻10⫺3mm2/s)] and low-grade tumors [1.2731⫾0.293 (⫻10⫺3mm2/s)] (P⬍.001). When grade II,
III, and IV astrocytomas were studied separately, ADC values were 1.2731⫾0.293 (⫻10⫺3mm2/s), 1.0673⫾0.276 (⫻10⫺3
[image:3.594.53.537.59.115.2]mm2/s), and 0.7456⫾0.135 (⫻10⫺3mm2/s), respectively. ADC values were significantly different between grade II and III astrocytomas (P⫽.019), between grade III and grade IV Table 1: Histopathologic diagnosis distributed by tumor grade
Histology Grade II Grade III Grade IV Total
Astrocytomas 18 (15.1%) 9 (7.6%) 92 (77.3%) (GBM) 119 (73.5%)
Oligodendrogliomas 10 (37.03%) 17 (62.97%) 27 (16.7%)
Oligoastrocytomas 4 (25%) 3 (18.8%) 9 (56.3%) (GBM-O) 16 (9.9%)
tumors (P⬍.001), and between grade III and IV astrocytomas (P⬍.001).
When we considered only oligodendroglial tumors, ADC values (mean) were not significantly different between high-grade [0.9326⫾0.199 (⫻10⫺3mm2/s)] and low-grade
tu-mors [1.0827⫾0.195 (⫻10⫺3mm2/s)] (P⫽.135).
In oligoastrocytomas, ADC values (mean) showed statisti-cally significant differences between high-grade [0.7803 ⫾ 0.759 (⫻ 10⫺3 mm2/s)] and low-grade tumors [1.2925 ⫾
0.300 (⫻10⫺3mm2/s)] (P⫽.002). When grade II, III, and IV
oligoastrocytomas were analyzed separately, ADC values were 1.2925⫾0.300 (⫻10⫺3mm2/s), 0.8410⫾0.367 (⫻10⫺3 mm2/s), and 0.7651⫾0.768 (⫻10⫺3mm2/s), respectively.
The ADC values were significantly different between grades II and III (P⫽.031) and between grades II and IV (P⫽.001). No statistically significant difference was found between the ADC values of grade III and IV oligoastrocytomas (P⫽1).
We also studied grade II gliomas in astrocytomas, oligo-dendrogliomas, and oligoastrocytomas separately. ADC val-ues (mean) were 1.2731⫾0.293 (⫻10⫺3mm2/s), 1.0827⫾ 0.195 (⫻10⫺3mm2/s), and 1.2925⫾0.300 (⫻10⫺3mm2/s),
respectively. There were no statistically significant differences in the ADC values between astrocytomas and oligodendro-gliomas (P⫽.246), between astrocytomas and oligoastrocy-tomas (P⫽1), or between oligodendrogliomas and oligoas-trocytomas (P⫽.587).
When we compared grade III astrocytomas, oligodendro-gliomas, and oligoastrocytomas separately, ADC values
(mean) were 1.0673⫾0.276 (⫻10⫺3mm2/s), 0.9326⫾0.199 (⫻10⫺3mm2/s), and 0.8410⫾0.367 (⫻10⫺3mm2/s),
respec-tively. No statistically significant differences were found be-tween the ADC values of astrocytomas and oligoastrocytomas (P⫽.630), between oligodendrogliomas and oligoastrocyto-mas (P⫽1), or between astrocytomas and oligodendroglio-mas (P⫽.490).
When grade IV astrocytomas and oligoastrocytomas were investigated, the ADC values (mean) were 0.7456⫾ 0.135 (⫻10⫺3mm2/s) and 0.7651⫾0.768 (⫻10⫺3mm2/s),
respec-tively. Grade IV astrocytomas and grade IV oligoastrocytomas did not show any statistically significant differences in ADC values (P⫽.555) (Fig 3).
[image:4.594.297.524.43.285.2]Fig 3.Boxplots show the range of minimum ADC values of 162 diffuse gliomas distributed by tumor histology and grade. The box represents the interquartile range (ie, 25%–75%); and the black bar, the median. Differences in minimum ADC values were statistically significant among grade II, III, and IV gliomas (P⬍.001). However, if we consider astrocytomas, oligodendrogliomas, and oligoastrocytomas separately, grades II and III oligodendrogliomas and grades III and IV oligoastrocytomas were not significantly different in ADC values.
Table 2: Minimum ADC and maximum rCBV values of different tumor types and grades
Type and Grade
Max rCBV (Mean)
Min ADC (Mean) (⫻10⫺3mm2/s)
Astrocytomas
Grade II 2.11⫾1.58 1.2731⫾0.293 Grade III 2.15⫾0.71 1.0673⫾0.276a
Grade IV 6.92⫾3.12a,b 0.7456⫾0.135a,b
Oligodendrogliomas
Grade II 2.98⫾1.30 1.0827⫾0.195 Grade III 4.36⫾2.80 0.9326⫾0.199 Oligoastrocytomas
Grade II 1.98⫾0.63 1.2925⫾0.300 Grade III 5.30⫾4.34 0.8410⫾0.367a
Grade IV 6.30⫾2.97 0.7651⫾0.768a
Note:—Max indicates maximum; Min, minimum.
aSignificantly different from grade II (P⬍.01). bSignificantly different from grade III (P⬍.01).
[image:4.594.54.271.44.336.2] [image:4.594.299.532.404.540.2]Table 2 summarizes minimum ADC values and maximum rCBV values of different tumor types and grades.
Combination of rCBV and ADC Values in the Grading of Gliomas
According to the ROC curves, the rCBV cutoff value of 1.74 showed high sensitivity (100%) in the characterization of high-grade gliomas.
The ADC threshold value of 1.185⫻10⫺3mm2/s
gener-ated the best combination of sensitivity (97.6%) and specific-ity (53.1%) in the discrimination of high- and low-grade gliomas.
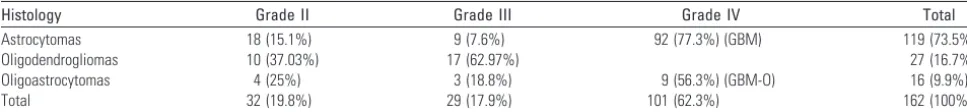
If we want to study the data obtained by the combination of perfusion and diffusion MR imaging, ADC and rCBV values should be considered as dichotomic variables. In that setting, the area under the ROC curve was 0.72 and 0.75 for the max-imum rCBV and minmax-imum ADC, respectively. Combination of rCBV and ADC values increased the area under the ROC curve to 0.83 (Fig 4).
Table 3 represents the sensitivity, specificity, positive pre-dictive value, and negative prepre-dictive value for CBV, ADC, and their combination in the differentiation of high-grade from low-grade gliomas.
Discussion
Accurate grading of gliomas is of utmost importance because the therapeutic approach and prognosis differ considerably according to tumor grade.5,13Whereas conventional MR
im-aging provides information on contrast enhancement, mass
effect, edema, and necrosis, it is not always accurate for the precise grading of gliomas.5
Although previous studies have suggested that contrast en-hancement alone is not sufficient to predict tumor grade14
because some low-grade gliomas demonstrate contrast en-hancement while some high-grade tumors do not,13,15the
ex-tent of contrast enhancement has been traditionally used as a mark of malignancy.13,16
Advanced MR imaging techniques such as perfusion and diffusion MR imaging have demonstrated utility for the as-sessment of brain tumors.5 Thus, MR imaging perfusion methods allow the creation of CBV maps that are potentially useful in the characterization of gliomas because tumor ag-gressiveness and growth are associated with endothelial neo-vascularization. rCBV measurements correlate with tumor grade and histologic findings of increased vascularity of the tumor.5,16,17 Previous studies published between 1999 and
2005 (n⫽ⱕ33 patients)2,14,18,19found a range of rCBV values from 1.11 to 1.69 and from 3.64 to 7.32 in low-grade and high-grade gliomas, respectively. These values are comparable with our findings in our series of 162 patients, with mean rCBV values of 6.85 and 2.36 for high-grade and low-grade gliomas, respectively.
Several studies4,5,20,21 have found statistically significant
discrimination between high-grade and low-grade gliomas. Our findings are in agreement with these results, demonstrat-ing significant differences (P⬍.001) in the rCBV values be-tween high- and low-grade tumors. We have also found that rCBV values were statistically different (P⬍.001) between grade II and IV gliomas and between grade III and IV gliomas. These results differ from those published by Hakyemez et al,2 in which no statistically significant difference between grades III and IV was demonstrated (P⬎.05,n⫽33). An explana-tion of the differences in the interpretaexplana-tion between the 2 stud-ies could be the variations in the number of patients included in the studies (162 versus 33). Even more, our results sup-port histologic findings that most grade III gliomas differ from grade IV tumors by the presence of microvascular proliferation.
We could not demonstrate significant differences between grade II and grade III gliomas (P⫽.295). This finding is in accordance with the fact that most intermediate, or grade III,
[image:5.594.54.532.46.208.2]Fig 4.ROC curve analysis showing the effect of using rCBV (A) and ADC (B) as individual or combined (C) variables in differentiating high- and low-grade gliomas. The area under the ROC curve for the maximum rCBV, minimum ADC, and a combination of both parameters is 0.72; 0.75; and 0.83, respectively.
Table 3: Sensitivity, specificity, PPV, and NPV for rCBV, ADC, and their combination in the differentiation of high-grade from low-grade gliomas
Sensitivity Specificity PPV NPV
Max rCBVⱖ1.74 94.4% 50.0% 88% 69.6% Min ADCⱕ1.185 97.6% 53.1% 89% 85% Max rCBVⱖ1.74 OR
Min ADCⱕ1.185
98.4% 31.3% 84.7% 83.3%
Max rCBVⱖ1.74 AND Min ADCⱕ1.185
93.5% 71.9% 92.8% 74.2%
[image:5.594.52.285.280.355.2]tumors lack microvascular proliferation in histopathologic studies and are quite similar to grade II gliomas in the perfu-sion analysis. Grade II and III tumors were also not signifi-cantly different when astrocytomas, oligodendrogliomas, and oligoastrocytomas were considered separately. In 2004, Lev et al22stated that grade II oligodendrogliomas have greater rCBV
values than grade II astrocytomas. Although no significant differences have been demonstrated in our series between grade II astrocytomas and oligodendrogliomas, the rCBV oli-godendroglioma values tended to be superior to the astrocy-toma ones.
Similar series published in 1999 and 2005 by Lev and Rosen23and Hakyemez et al2found a sensitivity of 100% in
discriminating the high- and low-grade tumors with the use of 1.5 and 2 as a rCBV threshold value, respectively. A large series (n ⫽73) published in 2004 by Law et al20 found an rCBV threshold value of 1.75 with a sensitivity of 95% and specificity of 57.5%. In our study of 162 gliomas, we found similar results to those of Law et al20(sensitivity, 94.4%; specificity, 50%) by
using a cutoff value of 1.74. Our results are also in agreement with those published by Lev et al22and show us that as the
threshold level is lowered, the specificity is decreased and some low-grade gliomas are falsely identified as high-grade and will be treated more aggressively.2In our group of patients, on the other hand, sensitivity decreased to 91.2% when the rCBV cutoff value was increased to 3.29. These results are in agree-ment with those published by Shin et al,24who reported 91%
sensitivity and 83% specificity for a cutoff value of 2.9 in a group of 17 gliomas. With these cutoff values, some high-grade gliomas would be misidentified as low-high-grade tumors and would be treated conservatively, resulting in a potentially rapid death.2
Some authors25suggested that quantitative perfusion
im-aging predicts tumor biologic activity and survival better than histopathologic grade does. In our study, 8 patients with biopsy-proved grade II tumors showed increased rCBV, sug-gesting a higher grade than the one proposed from the pathol-ogy study. Clinical worsening at short-term follow-up be-tween 3 and 9 months, combined with a new histologic analysis, confirmed the diagnosis of high-grade tumors pro-posed on the initial perfusion imaging. We are in agreement with the above argument that DSC can be used to predict clinical outcome in patients with low-grade gliomas, indepen-dent of pathologic findings.
DWI allows assessing the cellularity of tumors in a nonin-vasive form because cellular and subcellular elements impede water mobility26and quantitative information from the
re-striction of water molecule movement can be observed in cal-culating the ADC.13,27–29Thus, brain neoplasms with higher
cellularity or with a higher grade show a significant reduction in ADC values.18,27In our series of 162 diffuse gliomas, we
found a significant difference in the minimum ADC value for differentiating the low- and high-grade gliomas (P⬍.001). These findings are similar to those reported previously by Lee et al (n⫽16),13Kono et al (n⫽17),27and Calli et al (n⫽
31),30with high-grade gliomas showing a significant reduc-tion in ADC values and increased signal intensity on DWI. Our findings also agree with those demonstrated by Yamasaki et al.28This similarity suggests an inverse relationship between
ADC and glial tumors of WHO grades II–IV.
Most of the published studies to date have evaluated the diffusion properties in high- and low-grade gliomas. We have gone one step further and have studied the ADC values in the gliomas classified by grade and histology. Similar to the data previously published by Yang et al31in a small series of 17
patients, we have demonstrated, in a larger series (n⫽162), that the difference in minimum ADC values was statistically significant among all 3 grades of gliomas and astrocytomas (P⬍.001). According to this, ADC measurements are better than rCBV values in distinguishing the grades of gliomas and astrocytic tumors. However, we did not find differences among the tumor grades when there was an oligodendroglial component.
In our experience, the mean ADC value was 0.7523 ⫾ 0.135⫻10⫺3mm2/s for grade IV gliomas and lower than ADC
values published by Stadnik et al32and Sugahara et al (n⫽
20),18who reported mean ADC values of 1.14⫻10⫺3mm2/s and 1.2⫾0.4⫻10⫺3mm2/s, respectively. The reason for our lower ADC values may be that we always sampled the mini-mum ADC value from the solid portion of the tumor. The cutoff value of 1.185⫻10⫺3mm2/s for the minimum ADC
generated the best combination of sensitivity (97.6%) and specificity (53.1%) in the discrimination of high- and low-grade gliomas.
In the present study, we were interested in determining whether combined data from rCBV and ADC values could improve the diagnostic accuracy of perfusion and diffusion alone. This is the first work that studies the combination of DWI and perfusion MR imaging as a diagnostic tool in the presurgical evaluation of gliomas in a large series of pa-tients. Our results show that the area under the ROC curve for the maximum rCBV was 0.72 and for the minimum ADC, 0.75. According to these results, the classification ac-curacy based on minimum ADC was higher than that based on maximum rCBV. When we combined both rCBV and ADC values, the area under the ROC curve increased to 0.83. Hence, we may conclude that the combination of ADC and rCBV values increases the diagnostic accuracy of MR imaging in the preoperative grading of gliomas. Kim and Kim17also found an adjunctive value of perfusion MR
imaging (pulsed arterial spin-labeling) and ADC scoring in the glioma grading compared with conventional images alone. However, there have been few reports of the simul-taneous use of perfusion and diffusion imaging in glioma grading, and further studies will be needed.
Conclusion
Our results in a series of 162 patients with diffuse gliomas show that ADC and rCBV maps can serve as a noninvasive method of approximating tumor grade. We have demon-strated that ADC measurements are better than rCBV values in distinguishing the grades of glioma. Although further stud-ies will be needed to confirm the utility of combined diffusion-weighted and perfusion MR imaging, our results also suggest that the combination of minimum ADC and maximum rCBV improves the diagnostic accuracy of MR imaging in the pre-operative determination of glioma grade.
Disclosures: Jose´ Ricoy—RELATED:Grant: Health Research Fund PS09/01977.
References
1. Warmuth C, Gu¨nther M, Zimmer C.Quantification of blood flow in brain tumors: comparison of arterial spin labeling and dynamic susceptibility-weighted contrast-enhanced MR imaging.Radiology2003;228:523–32 2. Hakyemez B, Erdogan C, Ercan I, et al.High-grade and low-grade gliomas:
differentiation by using perfusion MR imaging.Clin Radiol2005;60:493–502 3. Hirai T, Murakami R, Nakamura H, et al.Prognostic value of perfusion MR imaging of high-grade astrocytomas: long-term follow-up study.AJNR Am J Neuroradiol2008;29:1505–10
4. Bulakbasi N, Kocaoglu M, Farzaliyev A, et al.Assessment of diagnostic accu-racy of perfusion MR imaging in primary and metastatic solitary malignant brain tumors.AJNR Am J Neuroradiol2005;26:2187–99
5. Rollin N, Guyotat J, Streichenberger N, et al.Clinical relevance of diffusion and perfusion magnetic resonance in assessing intra-axial brain tumors. Neuro-radiology2006;48:150 –59
6. Sadeghi N, D’Haene N, Decaestecker C, et al.Apparent diffusion coefficient and cerebral blood volume in brain gliomas: relation to tumor cell density and tumor microvessel density based on stereotactic biopsies.AJNR Am J Neuro-radiol2008;29:476 – 82
7. Cha S.Update on brain tumor imaging: from anatomy to physiology.AJNR Am J Neuroradiol2006;27:475– 87
8. Gupta RK, Cloughesy TF, Sinha U, et al.Relationships between choline mag-netic resonance spectroscopy, apparent diffusion coefficient and quantitative histopathology in human glioma.J Neurooncol2000;50:215–26
9. Cha S, Knopp EA, Johnson G, et al.Intracranial mass lesions: dynamic con-trast-enhanced susceptibility-weighted echo-planar perfusion MR imaging.
Radiology2002;233:11–29
10. Louis DN, Ohgaki H, Wiestler OD, et al, eds.WHO Classification of Tumours of the Central Nervous System.4th ed. Lyon, France: IARC Press; 2007 11. Lacerda S, Law M.Magnetic resonance perfusion and permeability imaging in
brain tumors.Neuroimaging Clin N Am2009;19:527–57
12. Wetzel SG, Cha S, Johnson G, et al.Relative cerebral blood volume measure-ments in intracranial mass lesions: interobserver and intraobserver repro-ducibility study.Radiology2002;224:797– 803
13. Lee EJ, Lee SK, Agid R, et al.Preoperative grading of presumptive low-grade astrocytomas on MR imaging: diagnostic value of minimum apparent diffu-sion coefficient.AJNR Am J Neuroradiol2008;29:1872–77
14. Knopp EA, Cha S, Johnson G, et al.Glial neoplasms: dynamic contrast-enhanced T2*-weighted MR imaging.Radiology1999;211:791–98
15. McKnight TR, Lamborn KR, Love TD, et al.Correlation of magnetic resonance spectroscopic and growth characteristics within grade II and III gliomas.
J Neurosurg2007;106:660 – 66
16. Law M, Yang S, Wang H, et al.Glioma grading: sensitivity, specificity, and predictive values of perfusion MR imaging and proton MR spectroscopic im-aging compared with conventional MR imim-aging.AJNR Am J Neuroradiol
2003;24:1989 –98
17. Kim HS, Kim SY.A prospective study on the added value of pulsed arterial spin labeling and apparent diffusion coefficients in the grading of gliomas.
AJNR Am J Neuroradiol2007;28:1693–99
18. Sugahara T, Korogi Y, Kochi M, et al.Usefulness of diffusion-weighted MRI with echo-planar technique in the evaluation of cellularity in gliomas.J Magn Reson Imaging1999;9:53– 60
19. Aronen HJ, Gazit IE, Louis DN, et al.Cerebral blood volume maps of gliomas: comparison with tumor grade and histologic findings.Radiology1994;191: 41–51
20. Law M, Yang S, Babb JS, et al.Comparison of cerebral blood volume and vascular permeability from dynamic susceptibility contrast-enhanced perfu-sion MR imaging with glioma grade.AJNR Am J Neuroradiol2004;25:746 –55 21. Boxerman JL, Schmainda KM, Weisskoff RM.Relative cerebral blood volume maps corrected for contrast agent extravasation significantly correlate with glioma tumor grade, whereas uncorrected maps do not.AJNR Am J Neurora-diol2006;27:859 – 67
22. Lev MH, Ozsunar Y, Henson JW, et al.Glial tumor grading and outcome pre-diction using dynamic spin-echo MR susceptibility mapping compared with conventional contrast-enhanced MR: confounding effect of elevated rCBV of oligodendrogliomas.AJNR Am J Neuroradiol2004;25:214 –21
23. Lev MH, Rosen BR.Clinical applications of intracranial perfusion MR imag-ing.Neuroimaging Clin N Am1999;9:309 –31
24. Shin JH, Lee HK, Kwun BD, et al.Using relative cerebral blood flow and vol-ume to evaluate the histopathologic grade of cerebral gliomas: preliminary results.AJR Am J Roentgenol2002;179:783– 89
25. Law M, Young RJ, Babb JS, et al.Gliomas: predicting time to progression or survival with cerebral blood volume measurements at dynamic suscepti-bility-weighted contrast-enhanced perfusion MR imaging.Radiology2008; 247:490 –98
26. Kwee TC, Galban CJ, Tsien C, et al.Comparison of apparent diffusion coeffi-cients and distributed diffusion coefficoeffi-cients in high-grade gliomas.J Magn Reson Imaging2010;31:531–37
27. Kono K, Inoue Y, Nakayama K, et al.The role of diffusion-weighted imaging in patients with brain tumors.AJNR Am J Neuroradiol2001;22:1081– 88 28. Yamasaki F, Kurisu K, Satoh K, et al.Apparent diffusion coefficient of human
brain tumors at MR imaging.Radiology2005;235:985–91
29. Kitis O, Altay H, Calli C, et al.Minimum apparent diffusion coefficients in the evaluation of brain tumors.Eur J Radiol2005;55:393– 400
30. Calli C, Kitis O, Yunten N, et al.Perfusion and diffusion MR imaging in en-hancing malignant cerebral tumors.Eur J Radiol2006;58:393– 403 31. Yang D, Korogi Y, Sugahara T, et al.Cerebral gliomas: prospective comparison
of multivoxel 2D chemical-shift imaging proton MR spectroscopy, echo-pla-nar perfusion and diffusion-weighted MRI.Neuroradiology2002;44:656 – 66 32. Stadnik TW, Chaskis C, Michotte A, et al.Diffusion-weighted MR imaging of