http://www.scirp.org/journal/ns Natural Science, 2017, Vol. 9, (No. 12), pp: 421-436
https://doi.org/10.4236/ns.2017.912040 421 Natural Science
Estimated Carbon Sequestration in a Temperate Forest in
Idaho of USA
Zhaohua Dai1,2,3, Richard A. Birdsey1, Alexa J. Dugan1
1USDA Forest Service, Newtown Square, PA, USA; 2Commission for Environmental Cooperation, Montreal, Canada;
3School of Forest Resources and Environmental Science, Michigan Technological University, Houghton, MI, USA
Correspondence to: Zhaohua Dai,
Keywords: Disturbances, Insects, Fire, Biomass, Forest-DNDC, Spatially-Explicit Modeling Approach, REDD Received: October 31, 2017 Accepted: December 26, 2017 Published: December 29, 2017 Copyright © 2017 by authors and Scientific Research Publishing Inc.
This work is licensed under the Creative Commons Attribution International License (CC BY 4.0).
http://creativecommons.org/licenses/by/4.0/
ABSTRACT
Assessing carbon (C) sequestration in forest ecosystems is fundamental to supply informa-tion to monitoring, reporting and verificainforma-tion (MRV) for reducing deforestainforma-tion and forest degradation (REDD). The spatially-explicit version of Forest-DNDC (FDNDC) was eva-luated using plot-based observations from Nez Perce-Clearwater National Forest (NPCNF)
in Idaho of United States and used to assess C stocks in about 16,000 km2. The model
eval-uation indicated that the FDNDC can be used to assess C stocks with disturbances in this temperate forest with a proper model performance efficiency and small error between
ob-servations and simulations. Aboveground biomass in this forest was 85.1 Mg C ha−1 in 2010.
The mean aboveground biomass in the forest increased by about 0.6 Mg C ha−1 yr−1 in the
last 20 years from 1990 to 2010 with spatial mean stand age about 98 years old in 2010. Spa-tial differences in distributions of biomass, net primary production and net ecosystem product are substantial. The spatial divergence in C sequestration is mainly associated with the spatial disparities in stand age due to disturbances, secondly with ecological drivers and species. Climate variability and change can substantially impact C stocks in the forest based on the climatic variability of spatial climate data for a 33-year period from 1981 to 2013. Temperature rise can produce more biomass in NPCNF, but biomass cannot increase with an increase in precipitation in this forest. The simulation with disturbances using observa-tions and estimates for the time period from 1991 to 2011 showed the effects of disturbances on C stocks in forests. The impacts of fires and insects on C stocks in this forest are highly dependent on the severity, the higher, the more C loss to atmosphere due to fires, and the more dead woods produced by fires and insects. The rates of biomass increase with an in-crease in stand age are different among the species. The changes in forest C stocks in the forest are almost species specific, non-linear and complex. The increase in aboveground
https://doi.org/10.4236/ns.2017.912040 422 Natural Science biomass with an increase in stand age can be described by a high-order polynomial.
1. INTRODUCTION
Forests have been known an important terrestrial carbon (C) sink [1-6]. Generally, C sequestration in
forests can be expressed by using CO2 flux measurements. Recent development and applications of eddy
flux measurement technology reflect these metrics [7-11]. However, CO2 flux is highly impacted by
changing environmental factors, including topography, climate, hydrogeology, soil, vegetation and various
disturbances [12-14]. Therefore, there are large uncertainties in the flux estimation using this technology
due to large differences in environmental conditions and inadequate equipment to cover large enough areas to do the assessments for large regions.
Although understanding C sequestration in forests is fundamental for REDD, it is impossible for us to conduct intensive inventories everywhere to know C stocks and long-term C dynamics in forests in large regions, such as nationwide or continent-wide, because of limitations in personnel, equipment, funds and complex environmental conditions. However, we can do this by means of computer models, which are developed from expert knowledge, long-term experiences, and observations. Recent applica-tions of biogeochemical C models for assessing forests response to land use change and natural and
hu-man disturbances reflect their merits [2, 15-21]. Accordingly, application of these effective tools is
fun-damental to evaluate the responses of forests to climate change and the role of forests in mitigating global warming, and to effectively assess C stocks and long-term dynamics for forest management and restoration.
The main objective of this study was to use the spatially-explicit and process-based model Forest- DNDC (FDNDC) to simulated spatiotemporal C dynamics, involving threefold: 1) to evaluate the model performance using observations from sample plots in Nez Perce-Clearwater National Forest in Idaho of USA, 2) to assess spatiotemporal C stocks for the forest, and 3) to estimate the responses of C sequestra-tion to disturbances and climate variability. To achieve the first objective, FDNDC was evaluated using the data of FIA (Forest Inventory and Analysis) sample plot data to simulate C dynamics for Nez Perce-Clearwater National Forest. To achieve the other two objectives, the evaluated model was used to assess spatiotemporal C stocks in the forest and the responses of C sequestration to climate variability and disturbances using spatial climate data for a 33-year period from 1981 to 2013 and spatial disturbance in-formation for fires, insects and harvest occurred in the period 1991-2011.
2. METHODS AND DATA
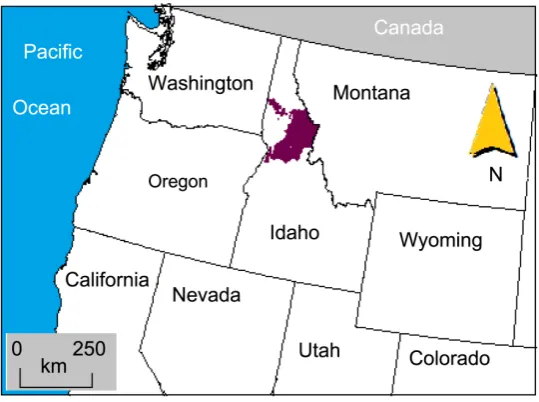
2.1. Site DescriptionThe study site, Nez Perce-Clearwater National Forest (NPCNF), is a temperate forest, located in
northern Idaho of USA (45.27˚N - 47.13˚N, 114.3˚W - 117.0˚W) (Figure 1). The forest area is over
16,000 km2 at present. Geographical gradient alters greatly; the slope ranges from 1 to 52% with a mean
of 10%; the elevation varies between about 390 and 2710 m above mean sea level, with a mean of over 1400 m.
Climate in this forest area alters substantially with changing gradient; precipitation increases with an increment in the altitude, but air temperature is converse. Mean annual precipitation was 550 - 1730 mm
over the forest in the 33-year period from 1981 to 2013 based on the Daymet data (http://daymet.ornl.gov/),
with a regional mean of 1100 mm and an annual precipitation range of 400 - 2440 mm over space and time in the same period. Spatial difference in long-term mean temperature was large in the last 33-year period, ranged from 0.0˚C to 9.6˚C across this forest with a regional mean of about 5.1˚C in the same time period, and the annual mean over the time and space ranged from −4˚C to 12˚C. Because of changing in the
alti-tude, the snow is different place-to-place, ranged from 5 to 760 kg m−2 yr−1, with an average of 300 kg m−2
https://doi.org/10.4236/ns.2017.912040 423 Natural Science
Figure 1. Nez perce clearwater national forest in Idaho
(purple area), USA.
There are 55 soil series in the area of NPCNF due to complex geographical topography and climate, they are distributed on different slopes. Soil type ranges from loamy sand to sandy clay loam, but the main soil type is loam; the clay content is between 2.5% and 50.0%, the mean is about 11.3%. The acidity of the soils is different, pH 4.8 - 8.2, with a mean pH of 6.2, based on the data obtained from NRC downloaded
from www.nrc.org. The rock content in the soils varies largely, ranging from 0% to 97%, with a mean of
about 30%, substantially increasing or decreasing with an increase or decrease in slopes (R2 = 0.11, n =
1056, P 0.01), and the soil organic matter is between 0.25% and 50%, with an average of 2.15%, on the
basis of the NRC data.
There are over 20 tree species in this forest, but the main species are coniferous, including fir (
Pina-ceae) family [Douglas fir (Pseudotsuga menziesii), grand fir (Abies grandis), and subalpine fir (Abies
lasi-ocarpa)], spruce (Picea engelmannii), lodgepole pine (Pinus contorta) and ponderosa pine (Pinus
ponde-rosa), western redcedar (Thuja plicata). Due to disturbances (see Data below), stand age ranged from
seedling to 818 years old in 2010 based on the data of FIA plots in the NPCNF [22].
2.2. Data
Climate data for a 33-year period from 1981 to 2013 were obtained from Daymet database
(http://daymet.ornl.gov/). Spatial climatic data points used for this study were over 1000, about 4.2 km
resolution on average. A poly-point map was created using ArcGIS for the spatial climate data. Soil data for NPCNF, including map and physiochemical soil properties, were obtained from NRC database,
downloaded from www.nrc.org. The data of vegetation species/types and inventories used to calibrate
and validate the model FDNDC for modeling C dynamics in this forest were obtained from the FIA da-tabase.
Disturbance map for NPCNF were derived from the Landsat TM time series using the Vegetation
Change Tracker [23] (Figure 2). The disturbance types were fire, harvest/thinning and insect, identified
using Monitoring Trends in Burn Severity (MTBS, http://www.mtbs.gov/), Forest Service Activity
Track-ing System (FACTS, http://www.fs.fed.us/nrm/index.shtml), and Aerial Detection Survey (ADS,
http://www.fs.fed.us/). Disturbance magnitudes in NPCNF were initially identified using post-disturbance
change in modeled live aboveground carbon (for harvests) or percent canopy cover (for fires, insects,
abiotic), then calibrated with FIA sample plots (www.fia.fs.fed.us/tools-data). Disturbance magnitudes
https://doi.org/10.4236/ns.2017.912040 424 Natural Science
Figure 2. Disturbances occurred in 1991-2011 in
nez perce clearwater national forest, Idaho, USA.
resolution gridded disturbance magnitude datasets were nearest-neighbor interpolated to 90-m resolu-tion.
To simulate spatial C stocks in NPCNF, the spatial datasets, including soil properties, vegetation and climate data, were alimented to 90 m resolution, as same as the resolution used for disturbances. The po-lygonal vegetation and soil and poly-point climate and disturbance maps were sequentially joined (over-lapped) to create spatial units (polygons) using ArcGIS 10 to assess spatial C stocks in this forest.
2.3. Forest-DNDC
FDNDC is a spatially explicit biogeochemical model used to simulate forest growth and C and N
dy-namics in forest ecosystems and emissions of trace gases such as CO2, CH4 and N2O based on the balance
of water, light, and nutrients in forest ecosystems [2, 25, 26]. Vegetation is divided into three layers, i.e., over-story (dominant canopy), understory (saplings) and ground-growth (sedges and moss/lichen). Each of the vegetation layers is simulated based on competition for energy and nutrients and plant physiological process responses to variations in environmental conditions. The soil profile is divided into multiple lay-ers, 1 - 5 cm in thickness; soil conditions and the dynamics of C and N in each soil layer are modeled hourly. This model has been widely tested and used for estimating greenhouse gas (GHG) emissions from forested wetland and upland ecosystems and assessing C sequestration in forests in a wide range of
climat-ic regions, from boreal to tropclimat-ical [11, 26-32]. The model structure, algorithms and parameterization can
be found in the model manual (http://www.dndc.sr.unh.edu) and publications [25-28].
2.4. Model Performance Evaluation
[image:4.595.182.419.72.355.2]https://doi.org/10.4236/ns.2017.912040 425 Natural Science information for vegetation, soil, and disturbances were verified, and then the model was independently parameterized using these plot-based information for evaluating the model performance. The key
[image:5.595.60.540.148.683.2]para-meters are presented in Table 1.
Table 1. Key vegetation and soil parameters for Forest-DNDC*.
Parameter Parameter
Initial leaf N (%) Leaf start TDD
AmaxA (μmol g−1 s−1) Wood start TDD
AmaxB Leaf end TDD
Optimum photosynthetic temperature (˚C) Wood end TDD
Minimum photosynthetic temperature (˚C) Leaf N re: translocation
AmaxFrac Senescence start day
Growth respiration fraction Leaf C/N
Dark respiration fraction Wood C/N
Wood maintenance respiration fraction Leaf retention years
Root maintenance respiration fraction C reserve fraction
Light half saturation constant C fraction of dry matter
Respiration Q10 Specific leaf weight (g m−2)
Canopy light attenuation Minimum wood/leaf
Water use efficiency Leaf geometry
Intercept of vapor pressure deficit Maximum N storage (kg N ha−1)
Slope of vapor pressure deficit Maximum wood growth rate
Maximum leaf growth rate (% yr−1) Coefficient of stem density (0 - 1)#
Overstory species Overstory age
Understory species Understory age
Ground growth (sedge and moss) Daily minimum temperature (˚C)
Daily maximum temperature (˚C) Daily precipitation (mm)
Spatial soil, climate, vegetation and hydraulic parameters
Soil organic carbon (%) Hydraulic conductivities (cm·hr−1)
pH Wilting point (0 - 1)
Clay (%) Capacity (0 - 1)
Soil depth (cm, ≤150 cm) Porosity (0 - 1)
Over-story species Over-story age
Understory species Understory age
Ground growth (sedge and moss) Daily minimum temperature (˚C)
Daily maximum temperature (˚C) Daily precipitation (mm)
*: Values for vegetation, soil and climate are spatially based, data were obtained from FIA, NRC and
Day-met (see Site Description and Data); #: Usually, the coefficient of stem density is the ratio of forest to the
https://doi.org/10.4236/ns.2017.912040 426 Natural Science To prevent bias from individual method, model performance was evaluated employing four
quantita-tive methods [32, 33]: the coefficient of determination (R2, squared correlation coefficient), model
perfor-mance efficiency (E) [34], percent bias (PBIAS), and the RRS [the ratio of the root mean squared error
(RMSE) to SD (standard deviation)] [35].
The key variable used to evaluate model performance is E (−∞, 1), and it is calculated as
(
)
(
)
2
2
1 i i
i x y E x x − = − −
∑
∑
(1)where xi, x and yi are observed values, observed mean and simulated results, respectively. The
evalu-ation variables, PBIAS and RRS are computed, respectively, as
(
)
100
PBIAS i i
i
x y
x
−
=
∑
×∑
(2)RM S
D
RR SE
S
= (3)
where SD is the observation standard deviation; RMSE is the root mean squared error, the equation is
(
)
2RMSE xi yi
n
−
=
∑
(4)where n is the number of samples, or the pairs of the observed and simulated values; and the R2 is
(
)(
)
(
)
(
)
2 2 2 2 i i i ix x y y
R
x x y y
− −
= − −
∑
∑
∑
(5)Model performance rating ranges are: 0.25 ≤ E < 0.5 (satisfactory), 0.5 ≤ E < 0.75 (good), and E ≥ 0.75 (excellent or very good); a PBIAS between −25 and 25 and a RRS less than 0.7 are considered satisfactory [32, 35, 36].
FDNDC was run for a 225-year period starting from 1788 when the oldest one of the 584 FIA plots regenerated to evaluate the model for assessing C stocks in NPCNF.
Because there were no available climate data for the period before 1981 and disturbance data for the period before 1991, the 33-year climate data and 21-year disturbance information (see Section 2.2) were repeated for the simulated historical period based on the assumption that the climatic pattern and the type and magnitude of disturbances in history were similar with those for observation periods in this forest. 2.5. Model Parameterization for Assessing Spatial Carbon Stocks
The model was configured to simulate spatial C dynamics in NPCNF. Accordingly, the joined map mentioned above was used to generate spatial simulation units using the tools of FDNDC (see details in
the Forest-DNDC User’s Guide, http://www.dndc.sr.unh.edu). The model was parameterized for those
spatial simulation units using spatial vegetation, soil, climatic and disturbance information. The model was run to simulate the spatial C dynamics in NPCNF and C stocks for the period 1990-2012.
3. RESULTS
3.1. Model Evaluation
The result of the model calibration using 203 sample plots with a stand age range of 4 - 215 years old in 2012 and all main tree species in NPCNF showed that the simulated aboveground biomass using
https://doi.org/10.4236/ns.2017.912040 427 Natural Science
Figure 3. (a) Biomass (Mg C ha−1) simulated vs.
ob-served for the model calibration (red dash line, 1:1);
(b) Biomass (Mg C ha−1) simulated vs. observed for the
model validation (red dash line, 1:1).
slope (0.97) of the regression model between simulation and observation that was approximate 1.0 and an
intercept (11.25 Mg C ha−1) that was about 13.8% of the observed mean (79.77 Mg C ha−1). The simulated
mean (83.65) was about 4.9% higher than the observed.
The result of the simulation for model validation against observations from 381 sample plots is
plot-ted in Figure 3(b), indicating that FDNDC performed properly well with a proper slope (0.94) and a small
intercept (5.87 Mg C ha−1, about 7.4% of observation average) of the regression model between observation
and simulation. The simulated mean (80.34 Mg C ha−1) was only about 1.9% higher than the observed
(78.83 Mg C ha−1). The four quantitative evaluation variables (Table 2) concluded consistently that
FDNDC performed excellently to estimate C sequestration in this temperate forest in Idaho in USA with high performance efficiency; based on the model performance rating, FDNDC performance for assessing
C stocks in stands over the temperate forest was within the range of “very good” (E ≥ 0.75; RRS ≤ 0.7; −25
≤ PBIAS ≤ 25) [35, 36].
3.2. Spatiotemporal Carbon Sequestration
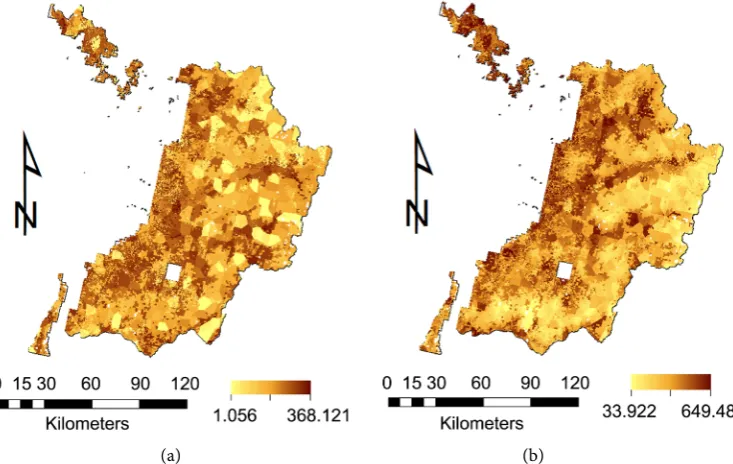
The C sequestration in the temperate forest varies considerably in space, aboveground biomass
(Figure 4(a)) and net primary production (NPP) (Figure 4(b)) in this forest ranged from 1.1 to 368.1 Mg
C ha−1 (Figure 4(a)) with a mean of 85.1 Mg C ha−1 and 33.9 to 649.5 g C m−2 with a mean of 238.7 g C
m−2, respectively, in 2010. Mean aboveground biomass increased annually by about 0.6 Mg C ha−1 in this
forest in the period 1990-2012, excluding the harvested wood products and dead woods due to distur-bances of fires and insects.
[image:7.595.171.426.72.362.2]https://doi.org/10.4236/ns.2017.912040 428 Natural Science
Table 2. Results from model performance*.
Calibration Validation
Variable Value Variable Value
R2 0.91 R2 0.85
E 0.88 E 0.83
PBIAS −0.10 PBIAS −0.02
RRS 0.35 RRS 0.41
a 0.97 a 0.94
b 11.25 b 5.87
*: R2, coefficient of determination; E, model performance efficiency; PBIAS, percent
bias; RRS, the ratio of the root mean squared error (RMSE) to SD (standard
devia-tion); a and b, the slope and intercept of the regression model between observations
and simulations.
(a) (b)
Figure 4. (a) Spatial aboveground biomass (Mg C ha−1) in NPCNF (~16,000
km2) in 2010; (b) Spatial NPP (g C m−2) in NPCNF (~16,000 km2) in 2010.
and soils, but the impacts of climate and soils are smaller than the stand age. The biomass from spatial si-mulation for 855 FIA plots were extracted to compare the sisi-mulation with observations. The results
showed that the simulated mean biomass (81.4 Mg C ha−1) was approximately to the observation (79.7 Mg
C ha−1). The simulated belowground biomass, including live and dead roots, was 23.3 Mg C ha−1, about
11% higher than the value estimated (21.0 Mg C ha−1) by FIA.
C sequestration varies temporally, and there are differences among species in NPCNF. The results from the simulation showed that net primary productivity (NPP) reached the peak at different ages
[image:8.595.116.483.337.569.2]https://doi.org/10.4236/ns.2017.912040 429 Natural Science (a)
(b)
Figure 5. (a) Annual net primary productivity (NPP) vs stand age in NPCNF, Idaho,
USA; (b) Aboveground biomass (Mg C ha−1) vs stand age in NPCNF, Idaho, USA;
Sub-alpine species includes subSub-alpine fir and subSub-alpine spruce.
were at about age ≥18 years old. The NPP correlation to stand age was significant (P < 2.4E−73), described by
(
)
Age 0 1
NPP =K ×Age+
∑
mj= Kj× ln Age j (6)where Age is the stand age; K0 and Kj are coefficients; j=1, 2,,m. However, the value of m is
dif-ferent specie-to-species in this forest, m = 2 for grand fir, subalpine fir, spruce, subalpine spruce, western
larch and ponderosa, the m = 3 for western cedar and lodgepole pine, and m = 6 for Douglas fir, except for
those coefficients that are different. This difference indicates that there are some differences in C seques-tration rate among the species in the forest.
The interannual changes in NPP were caused principally by climate. The fluctuation exhibited that the sensitivity of different species to climate variability in this forest was different, Grand fir was more sen-sitive to climate in this forest than Douglas fir and ponderosa pine, indicating that climate change can im-pact NPP in this forest.
[image:9.595.107.493.71.483.2]dif-https://doi.org/10.4236/ns.2017.912040 430 Natural Science
ferent from NPP in this forest, a quartic polynomial (e.g., m = 4 in Equation (7)) may better describe the
relationship for all main species in this forest (P < 9.3E−275), as follows
(
)
Age 0 1
AGB =K ×Age+
∑
mj= Kj× ln Age j (7)where AGB is accumulative aboveground wood mass (Mg C ha−1); others are as same as those used in
Eq-uation (6). However, the changes in AGB with stand age were different species-to-species although their growth curves were similar and nonlinear. Subalpine species (subalpine fir and subalpine spruce) have lower growth rates than others, but their AGB can continuously increase with an increment in stand age for a longer period.
3.3. Impact of Disturbances on Carbon Stocks
Disturbances affect substantially C stocks in NPCNF. Main disturbances occurred in this forest area
were insects, fire and harvest. Total disturbed area was about 1062.14 km2 within the 21 years period from
1991 to 2011, about 859.88, 116.42 and 85.84 km2 disturbed by insects, harvest and fires, respectively. These
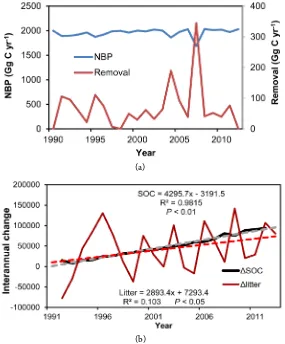
factors caused a substantial decrease in NBP (net biome production) (Figure 6(a)), especially harvest
(a)
[image:10.595.157.442.295.639.2](b)
Figure 6. (a) Impact of disturbances on NBP, and C removal
https://doi.org/10.4236/ns.2017.912040 431 Natural Science
and canopy fires that were main factors reducing C stocks inthe forest. The total harvested C was 763.54
Gg C in the 21 years with a mean of 36.36 Gg C yr−1. However, fires removed about 1742.38 Gg C in the 21
years with a mean of 82.97 Gg C yr−1, indicated that fires plaid an important role in removing C from the
forest, reduced forest floor. No matter what type the fires are, canopy or ground fires, they can cause a de-crease in forest floor.
Changes in forest floor in the forest (Figure 6(b)) reflected disturbances that impacted substantially
the C stocks in this forest; a substantial increase in forest floor was caused by harvest due to harvest resi-dues, but a substantial decrease in forest floor reflected that a severe fire occurred. Total C loss to atmos-phere from this forest due to fires in the 21 years was over 950 Gg C, including C loss from forest floor and canopy. Accordingly, there were substantial interannual changes in forest floor in this forest due to dis-turbance events.
There were about 4100 Gg C of deadwoods produced in the period 1991-2011 due mainly to fire and insects, excluded those deadwoods decomposed slowly in natural conditions. However, insects played very limited role in directly removing C from the forest, their main role was to produce a large amount of
deadwoods. Accordingly, accumulative mean deadwood was about 34.3 Mg C ha−1 in 2003 based on FIA
plot data.
4. DISCUSSION
4.1. Model EvaluationThe model performance evaluated using observations from 584 sample plots in NPCNF shows that
the FDNDC can perform well to assess C stocks in this forest, with high model performance efficiency (E ≥
0.83, R2 ≥ 0.85), proper slope (a ≥ 0.94) and intercept of the regression model between the observation and
simulation. The mean error between the observation and simulation was 9.7%. The four evaluation
va-riables (E, R2, PBIAS and RRS in Table 2) concluded consistently that this model was applicable for
as-sessing C stocks in NPCNF with a proper model performance efficiency. 4.2. Differences between Observation and Simulation
This model over-estimated live aboveground biomass for this forest by about 9.7%. This error may be mainly because of unknown historical disturbances before 1991 that we assumed that the disturbances oc-curred before 1991 were as same as those in the 21-year recorded period 1991-2011, including disturbance types and magnitudes. The assumption can cause an overestimation of live aboveground biomass and un-derestimation of deadwoods in this forest. However, the total aboveground wood mass for simulation
(110.7 Mg C ha−1), including live and dead woods, was only about 2.9% less than the observation (114.0
Mg C ha−1) for 855 FIA plots in 2003, indicated that the simulated mean biomass growth rate might be
slightly lower than the actual value for this forest.
4.3. Impact of Disturbances on Carbon Stocks in Forests
Wild fires are not uncommon, and their impact on C stocks in forests may be different fire-to-fire. The results simulated for the fires in NPCNF showed that those fires had produced a large amount of dead
woods and C loss to atmosphere. The wild fire occurred in NPCNF in 2000 burned the forest of 31.7 km2
with a mean canopy loss of about 35.2% based on the estimate of the canopy loss to fires. Based on the
si-mulation using fire disturbance data (Figure 2), the fires left dead woods of about 94.4 Gg C and caused a
loss of over 40 Gg C to air due mainly to a high fuel loading, including dead woods and forest floor in this forest, so that the forest floor in the burnt area was lower in 2001 than pre-fire in 2000; and total C loss to atmosphere from burning was over 50 Gg C in 2000 if the fine branches and leaves of live trees burnt were included.
https://doi.org/10.4236/ns.2017.912040 432 Natural Science
1993-1994 were over 481.9 Gg C due to the outbreak of insects over 65.7 km2. Because the decomposition
of dead woods, especially standing dead woods, is slow, there are a large amount of dead woods in this forest; total dead woods, produced by all factors, simulated and observed for NPCNF were 29.3 and 34.33
Mg C ha−1 in 2003, respectively, indicating that deadwoods are an important C pool in this forest.
Harvest is a common anthropogenic disturbance, substantially impacts C stocks in forests. Harvest removed forest product of about 763.5 Gg C from NPCNF in 1991-2011. However, harvest is different from other disturbances. If those harvested woods were used in longer life commercial products, C storage should increase substantially. However, harvest may increase wild fire severity due to fuel loading added
by harvest based on the findings of Stone et al. [37], and harvest can leave a large amount of dead roots,
those dead roots and residues left by harvesting can cause a subsequent increase in soil CO2 flux due to
decomposition.
4.4. Effect of Climate Variability on Carbon Sequestration
The impact of climate variability on C stocks in NPCNF was estimated using the Daymet climate data for a 33-year period 1981-2013. The results show that climate variability can substantially impact C stocks
in the forest in NPCNF (Figure 7). Annual mean aboveground biomass in NPCNF can increase
substan-tially with an increase in temperature (Figure 7(a)), at a rate of about 248 kg C ha−1 yr−1 per ˚C on average.
(a)
(b)
Figure 7. (a) Impact of air temperature on annual mean
above-ground biomass (kg C ha−1 yr−1) in Nez perce clearwater national
forest within 100 years; (b) Impact of precipitation on annual
mean aboveground biomass (kg C ha−1 yr−1) in Nez perce
[image:12.595.147.457.316.646.2]https://doi.org/10.4236/ns.2017.912040 433 Natural Science The impact of temperature on C sequestration in this forest is completely different from that in tropical
semidry forests where the C sequestration can decrease with an increase in temperature [32]. This is due
mainly to lower temperature in this forest (about 5.1˚C averaged from 1981 to 2013) than that in the trop-ical dry forests, such as the forests in the Yucatan Peninsula of Mexico (the mean of 26.5˚C for the period
1981-2012) [32]. Temperature rise can increase the length of growing seasons in this forest such that the
biomass can increase with an increment in mean air temperature in this forest.
Biomass can substantially decrease small with an increase in precipitation in this forest (Figure 7(b);
P < 0.001), at a rate of about 98.5 kg C ha−1 yr−1 per 100 mm. However, there are some divergences in the
impact of precipitation on C stocks in this forest among the vegetation types. The biomass in the forest-lands dominated by Ponderosa pine, subalpine fir and subalpine spruce does not decrease substantially with an increase in precipitation (R = 0.107, n = 204, P > 0.1 for subalpine fir and spruce; R = 0.145, n =
51, P > 0.2 for ponderosa pine). Compared to the tropical dry forests where the ratio of precipitation to
potential evapotranspiration (RPPE) is less than 1.0, such as the forests in the Yucatan Peninsula in
Mex-ico where the ratio is only about 0.8 [38], the biomass in this forest does not increase with an increment in
precipitation due to the RPPE ≥ 1.0 in this forest.
5. CONCLUSIONS
The results from model evaluation indicate that the model Forest-DNDC can be applied for assessing C sequestration in NPCNF in Idaho of USA with a high model performance efficiency (E > 0.8) and a small error between observation and simulation. The slightly overestimated live biomass and small unde-restimated deadwood for this forest might be related to unavailable disturbance information for the time period before 1991 that was assumed as same as the observed period from 1991 to 2011.
There are some differences in C sequestration rates among species in the forest. The relationship be-tween NPP and stand age can alter from quadratic to sextic polynomial. Although AGB in this forest can increase at a rate of quartic polynomial with an increment in stand age, there are substantial divergences in the growth rate among the species. The subalpine species have lower growth rates, but they can conti-nuously increase for a longer time than other species.
Temperature rise can increase biomass in this forest. This is mainly related to low air temperature (long-term mean of 5.1˚C) in this forest. Accordingly, an increase in temperature may increase the length of growing seasons such that forest production can increase with an increase in temperature in this forest. However, precipitation increase cannot produce more biomass in this forest because this forest has ade-quate precipitation (long-term mean of 1100 mm).
REFERENCES
1. Trettin, C.C., Laiho, R., Minkkinen, K. and Laine, J. (2006) Influence of Climate Change Factors on Carbon Dynamics in Northern Forested Peatlands. Canadian Journal of Soil Science, 86, 269-280.
https://doi.org/10.4141/S05-089
2. Miehle, P., Livesley, S.J., Feikema, P.M., Li, C. and Arndt, S.K. (2006) Assessing Productivity and Carbon Se-questration Capacity of Eucalyptus globules Plantation Using the Process Model Forest-DNDC: Calibration and Validation. Ecological Modeling, 192, 83-94. https://doi.org/10.1016/j.ecolmodel.2005.07.021
3. Birdsey, R.A., Jenkins, J.C., Johnson, M., Huber-Sannwald, E., Amiro, B., de Jong, B., Barra, J.D.E., French, N., Garcia-Oliva, F., Harmon, M.E., Heath, L.S., Jaramillo, V.J., Johnsen, K., Law, B.E., Marin-Spiotta, E., Masera, O., Neilson, R., Pan, Y. and Pregitzer, K.S. (2007) North American Forests. In: King, L., Dilling, A.W., Zim-merman, G.P., Fairman, D.M., Houghton, R.A., Marland, G., Rose, A.Z. and Wilbanks, T.J., Eds., The First State
of the Carbon Cycle Report (SOCCR): The North American Carbon Budget and Implications for the Global
Carbon Cycle, a Report by the US Climate Change Science Program and the Subcommittee on Global Change
https://doi.org/10.4236/ns.2017.912040 434 Natural Science 4. Ryan, M.G. (2008) Forests and Carbon Storage (June 4, 2008), US Department of Agriculture, Forest Service,
Feb. 8, 2013. http://www.fs.fed.us/ccrc/topics/carbon.shtml
5. Pan, Y., Birdsey, R.A., Fang, J., Hounghton, R., Kauppi, P.E., Kurz, W.A., Phillips, O.L., Shvidenko, A., Lewis, S.L., Ganadell, J.G., Ciais, P., Jackson, R.B., Pacala, S.W., McGuire, D., Piao, S., Rautiainen, A., Sitch, S. and Hayes, D. (2011) A Large and Persistent Carbon Sink in the World’s Forests. Science, 333, 988-993.
https://doi.org/10.1126/science.1201609
6. Charman, D.J., Beilman, D.W., Blaauw, M., Booth, R.K., Brewer, S., Chambers, F.M., Christen, J.A., Galle-go-Sala, A., Harrison, S.P., Hughes, P.D.M., Jackson, S.T., Korhola, A.K., Mauquoy, D., Mitchell, F.J.G., Pren-tice, I.C., van der Linden, M., De Vleeschouwer, F., Yu, Z.C., Alm, J., Bauer, I.E., Corish, Y.M.C., Garneau, M., Hohl, V., Huang, Y., Karofeld, E., Le Roux, G., Loisel, J., Moschen, R., Nichols, J.E., Nieminen, T.M., MacDo-nald, G.M., Phadtare, N.R., Rausch, N., Dillasoo, U., Swingdles, G.T., Tuittila, E.-S., Ukommaanaho, L., Vali-ranta, M., van Bellen, S., van Geel, B., vitt, D.H. and Zhao, Y. (2013) Climate-Related Changes in Peatland Car-bon Accumulation during the Millennium. Biogeosciences, 10, 929-944.
7. Baldocchi, D.D. (2003) Assessing the Eddy Covariance Technique for Evaluating Carbon Dioxide Exchange Rates of Ecosystems: Past, Present and Future. Global Change Biology, 9, 479-492.
https://doi.org/10.1046/j.1365-2486.2003.00629.x
8. Hutley, L.B., Leuning, R., Beringer, J. and Cleugh, H.A. (2005) The Utility of the Eddy Covariance Techniques as a Tool in Carbon Accounting: Tropical Savanna as a Case Study. Australian Journal of Botany, 53, 663-675.
https://doi.org/10.1071/BT04147
9. Barr, A.G., Morgenstern, K., Black, T.A., McCaughey, J.H. and Nesic, Z. (2006) Surface Energy Balance Closure by the Eddy-Covariance Method above Three Boreal Forest Stands and Implications for the Measurement of the CO2 Flux. Agricultural and Forest Meteorology, 140, 322-337. https://doi.org/10.1016/j.agrformet.2006.08.007 10. Oren, R., Hsieh, C., Stoy, P., Albertson, J., McCarthy, H.R., Harrell, P. and Katul, G.G. (2006) Estimating the
Uncertainty in Annual Net Ecosystem Carbon Exchange: Spatial Variation in Turbulent Fluxes and Sampling Errors in Eddy-Covariance Measurements. Global Change Biology, 12, 883-896.
https://doi.org/10.1111/j.1365-2486.2006.01131.x
11. Kurbatova, J., Li, C., Varlagin, A., Xiao, X. and Vygodskaya, N. (2008) Modeling Carbon Dynamics in Two Ad-jacent Spruce Forests with Different Soil Conditions in Russia. Biogeosciences, 5, 969-980.
https://doi.org/10.5194/bg-5-969-2008
12. Pietch, S.A., Hasenauer, H., Kucera, J. and Cermak, J. (2003) Modeling Effects of Hydrological Changes on the Carbon and Nitrogen Balance of Oak in Floodplains. Tree Physiology, 23, 735-746.
https://doi.org/10.1093/treephys/23.11.735
13. He, H.S., Hao, Z., Mladenoff, D.J., Shao, G., Hu, Y. and Chang, Y. (2005) Simulating Forest Ecosystem Response to Climate Warming Incorporating Spatial Effects in North-Eastern China. Journal of Biogeography, 32, 2043- 2056. https://doi.org/10.1111/j.1365-2699.2005.01353.x
14. Pacific, V.J., McGlynn, B.L., Riveros-Iregui, D.A., Epstein, H.E. and Welsch, D.L. (2009) Differential Soil Respi-ration Response to Changing Hydrologic Regimes. Water Resources Research, 45, W07201.
https://doi.org/10.1029/2009WR007721
15. Chen, J.M., Ju, W., Cihlar, J., Price, D., Liu, J., Chen, W., Pan, J., Balck, A. and Barr, A. (2003) Spatial Distribu-tion of Carbon Sources and Sinks in Canada’s Forests. Tellus, 55B, 622-641.
https://doi.org/10.4236/ns.2017.912040 435 Natural Science
https://doi.org/10.1890/03-4049
17. Mo, X., Chen, J.M., Ju, W. and Black, T.A. (2008) Optimization of Ecosystem Model Parameters through Assi-milating Eddy Covariance Flux Data with an Ensemble Kalman Filter. Eclogical Modelling, 217, 157-173.
https://doi.org/10.1016/j.ecolmodel.2008.06.021
18. Dai, Z., Trettin, C.C., Li, C., Sun, G., Amatya, D.M. and Li, H. (2013) Modeling the Impacts of Climate Variabil-ity and Hurricane on Carbon Sequestration in a Coastal Forested Wetland in South Carolina. Natural Science, 5, 375-388. https://doi.org/10.4236/ns.2013.53051
19. Hlasny, T., Barcza, Z., Fabrika, M., Balazs, B., Churkina, G., Pajtik, J., Sedmak, R. and Turcani, M. (2011) Cli-mate Change Impacts on Growth and Carbon Balance of Forests in Central Europe. Climate Research, 47, 219-236. https://doi.org/10.3354/cr01024
20. He, L., Chen, J.M., Pan, Y., Birdsey, R. and Kattge, J. (2012) Relationship between Net Primay Productivity and Forest Stand Age in U.S. Forests. Global Biogeochemical Cycles, 26, GB3009.
https://doi.org/10.1029/2010GB003942
21. Miao, Z., Lathrop Jr., R.G., Xu, M., La Puma, I.P., Clark, K.L., Hom, J., Skowtonski, N. and Tuyl, S.V. (2011) Simulation and Sensitivity Analysis of Carbon Storage and Fluxes in the New Jersey Pinelands. Environmental
Modelling and Software, 26, 1112-1122. https://doi.org/10.1016/j.envsoft.2011.03.004
22. O’Connell, B.M., LaPoint, E.B., Turner, J.A., Ridley, T., Pugh, S.A., Wilson, A.M. and Waddell, K.L. (2014) For-est Inventory and Analysis Database Description and Users Guide for Phase 2 Manual Version 6.0.1.
http://www.fia.fs.fed.us/
23. Huang, C., Goward, S.N., Maske, J.G., Thomas, N., Zhu, Z. and Vogelmann, J.E. (2010) An Automated Ap-proach for Reconstructing Recent Forest Disturbance History using Dense Landsat Time Series Stacks. Remote
Sensing of Environment, 114, 183-198. https://doi.org/10.1016/j.rse.2009.08.017
24. Healey, S.P., Yang, Z., Cohen, W.B. and Pierce, J.D. (2006) Application of Two Regression-Based Methods to Estimate the Effects of Partial Harvest on Forest Structure using Landsat Data. Remote Sensing of Environment, 101, 115-126. https://doi.org/10.1016/j.rse.2005.12.006
25. Li, C., Aber, J., Stange, F., Butter-Bahl, K. and Papen, H. (2000) A Process-Oriented Model of N2O and NO Emissions from Forest Soils. 1. Model Development. Journal of Geophysical Research: Atmospheres, 105, 4369-4384. https://doi.org/10.1029/1999JD900949
26. Stange, F., Butterbachl, K., Papen, H., Zechmeister-Boltenstern, S., Li, C. and Aber, J. (2000) A Process-Oriented Model of N2O and NO Emissions from Forest Soils. Journal of Geophysical Research, 105, 4385-4398.
https://doi.org/10.1029/1999JD900948
27. Zhang, Y., Li, C., Trettin, C.C., Li, H. and Sun, G. (2002) An Integrated Model of Soil, Hydrology and Vegeta-tion for Carbon Dynamics in Wetland Ecosystems. Global Biogeochemical Cycles, 16, 1-17.
https://doi.org/10.1029/2001GB001838
28. Li, C., Cui, J., Sun, G. and Trettin, C.C. (2004) Modeling Impacts of Management on Carbon Sequestration and Trace Gas Emissions in Forested Wetland Ecosystems. Environmental Management (Supplement), 33, S176-S186. https://doi.org/10.1007/s00267-003-9128-z
29. Kiese, R., Li, C., Hilbert, D.W., Papen, H. and Butterbach-Bahl, K. (2005) Regional Application of PnET-DNDC for Estimating the N2O Source Strength of Tropic Rainforests in the Wet Tropics of Australia. Global Change
Biology, 11, 128-144. https://doi.org/10.1111/j.1365-2486.2004.00873.x
30. Kesik, M., Bruggemann, N., Forkel, R., Kiese, R., Knoche, R., Li, C., Seufert, G., Simpson, D. and Butter-bach-Bahl, K. (2006) Future Scenarios of N2O and NO Emissions from European Forest Soils. Journal of
Geo-physical Research, 111, G02018. https://doi.org/10.1029/2005JG000115
https://doi.org/10.4236/ns.2017.912040 436 Natural Science Temporal Variations in CH4, CO2 and N2O Fluxes in a Forested Watershed. Water, Air, and Soil Pollution, 223, 253-265. https://doi.org/10.1007/s11270-011-0855-0
32. Dai, Z., Birdsey, R.A., Johnson, K.D., Dupuy, J.M., Hernandez-Stefanoni, J.L. and Richardson, K. (2014) Mod-eling Carbon Stocks in a Secondary Topical Dry Forest in the Yucatan Peninsula, Mexico. Water, Air, and Soil
Pollution, 225, 1925. https://doi.org/10.1007/s11270-014-1925-x
33. Dai, Z., Amatya, D.M., Sun, G., Trettin, C.C., Li, C. and Li, H. (2011) Climate Variability and Its Impact on Forest Hydrology on South Carolina Coastal Plain, USA. Atmosphere, 2, 330-357.
https://doi.org/10.3390/atmos2030330
34. Nash, J.E. and Sutcliffe, J.V. (1970) River Flow Forecasting through Conceptual Models—Part I: A Discussion of Principles. Journal of Hydrology, 10, 282-290. https://doi.org/10.1016/0022-1694(70)90255-6
35. Moriasi, D., Arnold, J., Liew, M.W.V., Bingner, R., Harmel, R. and Veith, T. (2007) Model Evaluation Guide-lines for Systematic Quantification of Accuracy in Watershed Simulations. ASABE, 50, 885-899.
https://doi.org/10.13031/2013.23153
36. Dai, Z., Johnson, K.D., Birdsey, R.A., Hernandez-Stefanoni, J.L. and Dupuy, J.M. (2015) Assessing the Effect of Climate Change on Carbon Sequestration in a Mexican Dry Forest in the Yucatan Peninsula. Ecological
Com-plexity, 24, 46-56. https://doi.org/10.1016/j.ecocom.2015.09.004
37. Stone, C., Hudak, A. and Morgan, P. (2004) Forest Harvest Can Increase Subsequent Forest Fire Severity.
Pro-ceedings of the 2nd International Symposium on Fire Economics, Planning, and Policy: A Global Review,
Cor-doba, 19-22 April 2004.
38. Bauer-Gottwein, P., Gondwe, B.R.N., Charvet, G., Marin, L.E., Rebolledo-Vieyra, M. and Merediz-Alonso, G. (2011) Review: The Yucatan Peninsula Karst Aquifer, Mexico. Hydrogeology Journal, 19, 507-524.