ORIGINAL RESEARCH
Apparent Diffusion Coefficient with Higher
b-Value Correlates Better with Viable Cell Count
Quantified from the Cavity of Brain Abscess
V. Tomar A. Yadav R.K.S. Rathore S. Verma R. Awasthi V. Bharadwaj B.K. Ojha K.N. Prasad R.K. Gupta
BACKGROUND AND PURPOSE:DWI by using higher b-values provides tissue diffusivity with less T2 shinethrough effect. VCD in the abscess cavity correlates with ADC values. The purpose of this study was to investigate which b-value⫺derived ADC correlates better with VCD.
MATERIALS AND METHODS: Thirty patients with brain abscess underwent conventional MR imaging and DWI withb⫽1000, 2000, and 3000 s/mm2on a 3T MR imaging scanner. ADC values were quantified by placing regions of interest inside the abscess cavity in all sections where the lesion was apparent on coregistered ADC maps derived from different b-values. VCD was measured on pus aspirated.
RESULTS: An increase in b-value was associated with a decrease in ADC values in normal parenchyma as well as in the abscess cavity. The most significant negative correlation of VCD was observed with b⫽3000 s/mm2(r⫽ ⫺0.98,P⫽.01).
CONCLUSIONS:VCD in the abscess cavity can be best assessed atb⫽3000 s/mm2secondary to the reduction in the T2 shinethrough effect. DWI withb⫽ 3000 s/mm2is of promising value in the assessment of the therapeutic response of brain abscess.
ABBREVIATIONS:ADC ⫽ apparent diffusion coefficient; CNWM ⫽ contralateral normal white matter; DWI⫽diffusion-weighted imaging; FLAIR⫽fluid-attenuated inversion recovery; FWM⫽ frontal white matter; GM⫽gray matter; spp⫽species; VCD⫽viable cell density; WM⫽white matter
B
rain abscess is a focal suppurative process within the brain parenchyma.1 The incidence of brain abscess is highly variable. Brain abscesses comprise 1%–2% and up to 8% of all the patients with intracranial space-occupying lesions seen in the developed and developing countries, respectively.2 De-spite significant advances in diagnosis and treatment, brain abscess remains a potentially fatal central nervous system in-fection.3The abscess cavity contains inflammatory cells with intact cell membranes and nuclei, necrotic tissue debris, pro-teinaceous exudates, bacterial metabolites, and cytosolic amino acids, with or without the brain abscess’s causative organism.4CT and conventional MR imaging are the main noninva-sive modalities used to diagnose brain abscess. However, the imaging features of brain abscesses are nonspecific and may simulate those of cystic rim-enhancing mass lesions of varying etiologies.5DWI is widely used in the detection and
character-ization of a large number of brain pathologies, such as stroke, abscess, encephalitis, and tumors involving the central ner-vous system.6,7DWI has been shown to be useful in distin-guishing brain abscess from necrotic or cystic brain tumors.8,9 The restriction of diffusion in brain abscess is mainly influ-enced by the attenuation of viable inflammatory cells present in the pus, irrespective of the etiology of the abscess.10Treated brain abscesses have higher ADCs compared with untreated abscesses, and return to low ADCs suggests reactivation of the disease.11Recently a few studies have shown the utility of high b-values in the diagnosis of various disease conditions.12-19 Theoretically, higher b-value DWI provides better contrast with its reflection of more tissue diffusivity and less T2 shinethrough effect.13,14 However, at 1.5T or lower field strengths, higher b-values are not usually used in clinical prac-tice due to inferior signal intensity–to-noise ratios.15-17
It has been shown in vitro that the magnitude of diffusion in intracellular water molecules is an order smaller than that in the extracellular space.20,21The water diffusion in biologic tis-sues can be described in terms of 2 main components: water molecules of low mobility with slow diffusion (either bound to macromolecules or confined within the cell membrane) and of high mobility with high diffusion (mostly extracellu-lar).22,23The acquisition of DWI up tob⫽4000 s/mm2 am-plifies the sensitivity of DWI to assess water diffusion proper-ties and enables the separation of signals arising from the intracellular and extracellular water molecules.20,21 Hence, DWI should be sensitive to several physiologic and morpho-logic characteristics of the tissues, which are associated with the diffusion of the low and high mobility of water molecules. Two water compartments separated with different diffusion coefficients (ie, extracellular water for the compartment with
Received February 10, 2011; accepted after revision March 28.
From the Department of Radiodiagnosis (V.T., A.Y., R.A., R.K.G.) and Microbiology (K.N.P.), Sanjay Gandhi Post Graduate Institute of Medical Sciences, Lucknow, India; Department of Neurosurgery (V.B., B.K.O.), Chhatrapati Sahuji Maharaj Medical University, Lucknow, Uttar Pradesh, India; and Department of Mathematics and Statistics (S.V., R.K.S.R.), Indian Institute of Technology, Kanpur, Uttar Pradesh, India.
Abhishek Yadav received financial support from grant 5/9/62/2008-RHN funded by Indian Council of Medical Research, New Delhi, India. Rishi Awasthi acknowledges financial support (grant 3/1/JRF/43/MPD/2007; 33342) from the Indian Council of Medical Research, New Delhi, India.
Please address correspondence to Rakesh K. Gupta, MD, Department of Radiodiagnosis, Sanjay Gandhi Post Graduate Institute of Medical Sciences, Raebarely Rd, Lucknow, UP, India, 226014; e-mail: [email protected] or [email protected]
Indicates open access to non-subscribers at www.ajnr.org
high ADC) have been explained on the basis of the biexponen-tial fit model for water signal-intensity decay with different b-values.20-22This biexponential diffusion property of water has been used in functional task-activation assessments.24
The purpose of this study was to investigate which b-value⫺ derived ADC correlates better with VCD. We computed a bi-exponential fit to understand which component is influenced by the high b-value in the abscess cavity.
Materials and Methods
Study Design
Thirty-five patients with suspected intracranial abscess (24 males and 11 females; mean age, 25 years; ranging from 9 to 47 years of age) admitted to the Department of Neurosurgery, Chhatrapati Sahuji Maharaj Medical University, Lucknow, India, from August 2009 to December 2010 and 10 healthy controls (ranging from 23 to 45 years of age) were enrolled in the study prospectively. These subjects un-derwent conventional MR imaging and DWI in the Department of Radiodiagnosis, Sanjay Gandhi Post Graduate Institute of Medical Sciences, Lucknow, India, on a 3T MR imaging scanner (Signa Hdxt; GE Healthcare, Milwaukee, Wisconsin) with a 12-channel head coil. Institutional ethics approval and informed consent from all patients or their nearest kin were obtained before the investigation. Diagnosis of brain abscess was suggested on the basis of diffusion imaging in 30 patients and formed the basis of inclusion for the study protocol design. The diagnosis was confirmed in all these 30 patients after surgery.
MR Imaging Protocol
The conventional MR imaging protocol included T2-weighted fast spin-echo with TE/ TR/NEX⫽88/4400 ms/1.2; number of sections⫽
42; section thickness⫽3 mm; FOV⫽240 mm; T2 FLAIR with TE/
TR/NEX⫽140/9000 ms/2; number of sections⫽42; section
thick-ness⫽3 mm; FOV⫽240 mm; and spin-echo T1 FLAIR with TE/TR/
NEX/flip angle⫽14/1300 ms/1/65°; number of sections⫽42; section
thickness⫽3 mm; FOV⫽240 mm with image matrix⫽256⫻256
and no intersection gap.
All patients underwent DWI atb⫽1000, 2000, and 3000 s/mm2.
DWI parameters were the following: TE⫽93.2 ms; TR⫽7075 ms;
NEX⫽2.0; number of sections⫽42; section thickness⫽3 mm;
FOV⫽240 mm; image matrix⫽128⫻128 with no interslice gap.
Postcontrast T1-weighted images were acquired after intravenous in-jection of gadadiamide dimeglamine (Omniscan, Oslo, Norway) at a dose of 0.1 mmol/kg of body weight.
Culture of Abscess Aspirate
All patients underwent surgery within 24 hours of imaging. The pus was collected in a sterilized vial and snap-frozen in liquid nitrogen immediately after surgery/aspiration. At the same time, 1–2 mL of aspirated pus was inoculated into BACTEC Plus Aerobic/Anaerobic media (Becton Dickinson, Sparks, Maryland) to isolate the aerobic, facultative anaerobic, and anaerobic bacteria for the confirmation of the diagnosis of etiologic agents. The inoculated media were incu-bated at 37°C, and growth was monitored in BACTEC 9050 (Becton Dickinson) for 5 days. Media with positive growth were subcultured on appropriate solid media and incubated aerobically and anaerobi-cally at 37°C. Anaerobic incubation was carried out in jars filled with a gas mixture of nitrogen gas (80%–90%), carbon dioxide (5%–10%), and deuterium (5%–10%), through an Anoxomat system (Mart
Mi-crobiology, Drachten, the Netherlands). All of the isolates were iden-tified by standard biochemical tests as described previously.25
Cul-tures and smear examinations were performed forMycobacterium
tuberculosisas well as for fungi in all cases.26
Viable Cell Count
In this study, the viability of the cells was calculated by a hemocytom-eter (Burker-Turk; Erma, Tokyo, Japan) after diluting pus 100- to 1000-fold in white blood cell diluting solution and expressed as cells/ milliliter as described previously.10Inflammatory cells (leukocytes) with intact cell membranes and nuclei, as identified by 0.5% trypan blue staining, were referred to as viable cells. The method for the calculation of cell attenuation has been described elsewhere.10,27
Data Analysis
A Java-based Image J plug-in (http://rsb.info.nih.gov/ij) was devel-oped to generate the ADC maps from DWI datasets with different b-values.
Biexponential Fit and Its Quantification
The diffusion-weighted signal intensity in case of biexponential decay is given by
1) S共b兲⫽S共0兲共ffastexp关⫺b䡠Dfast兴⫹fslowexp关⫺b䡠Dslow兴兲,
whereS(b) is the signal intensity in the presence of a diffusion gradi-ent,S(0) is the signal intensity in the absence of a diffusion gradient, DfastandDsloware the fast and slow ADCs, andffastandfslow
repre-sent the respective fractional contributions to the signal intensity. Withafast⫽S(0)⫺aslow⫽S(0)ffast, equation 1 can be written as
2) S共b兲⫽afast共exp关⫺b䡠Dfast兴⫺exp关⫺b䡠Dslow兴兲
⫹S共0兲exp共⫺b䡠Dslow兲.
Coregistration was done between datasets with different b-values before fitting of equation 2 to obtain the ADCs of fast and slow diffusing components. Also the conventional ADC maps were calcu-lated by using the monoexponential diffusion equation, S(b) ⫽ S(0)exp(⫺b 䡠 D) from the above coregistered datasets with different b-values from patients as well as controls.28The mean ADCs, ADC
fast,
and ADCslowcomponents were calculated by placing elliptic or
circu-lar regions of interest (40 – 60 mm2) on any 1 of the above maps (and applying the same region of interest on other maps) inside the abscess cavity in all sections where the lesion was present. Similarly mean ADC values were also quantified from the CNWM and GM regions of the each patient with brain abscess in each section as they were from the abscess cavity.
Statistical Analysis
Bivariate analysis of the Pearson correlation was performed to study the relationship between mean ADC values, fast and slow ADC values, and VCD quantified from the abscess cavity. An independent Student ttest was also performed to see any changes in ADC values quantified from the abscess cavity, CNWM, and GM regions of patients with brain abscess as well as FWM and GM regions of healthy controls at different b-values. All statistical analyses were performed by using the Statistical Package for the Social Sciences, Version 16.0 (SPSS, Chi-cago, Illinois).
BRAIN
ORIGINAL
Results
Clinical and Laboratory Examination
The predisposing factors were recognized in 24 cases: otitis media (n⫽15), congenital heart disease (n⫽3), postopera-tive infection (n⫽1), steroid therapy (n ⫽2), head injury (n⫽1), and pulmonary tuberculosis (n⫽2). In the remaining 6 patients, the source of infection could not be ascertained. Of a total of 30 brain abscesses, 18 were found to be pyogenic, 1 was fungal, and 3 were confirmed as tubercular on a culture of aspirated pus. The micro-organisms isolated on culture and confirmed by standard biochemical test were aerobic Strepto-coccispp (n⫽10),Staphylococcus aureus(n⫽1),Bacteroides
spp (n⫽2),Nocardiaspp (n⫽1),Histoplasma capsulatum
(n⫽1), mixed microbes (aerobic and anaerobic) (n⫽4), and tubercular (n⫽3). Eight cases were sterile and were consid-ered pyogenic due to the presence of acute inflammatory cells and the absence ofMycobacteriumspp and fungal growth on microscopy and culture. In the abscess cavity, the VCD varied from 6000 to 11 000 cells/mm3.
Imaging Findings
Brain abscesses were located in the frontal lobe (n⫽3), pari-etal lobe (n⫽4), temporal lobe (n⫽10), parietotemporal
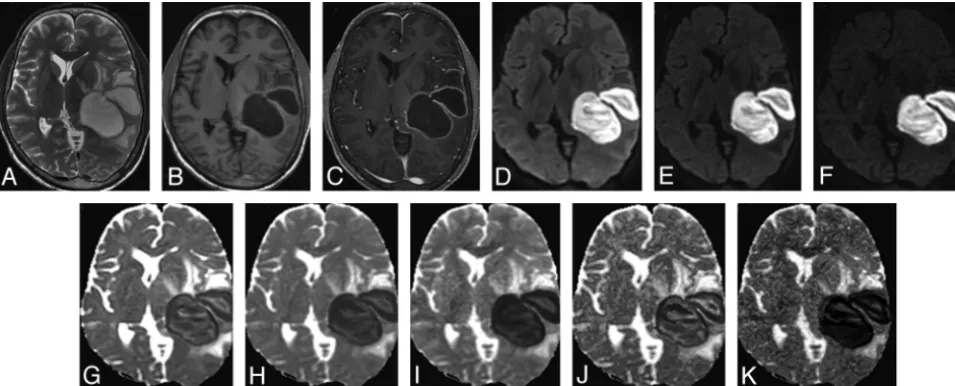
lobe (n⫽4), and cerebellum (n⫽9). The brain abscess ap-peared hyperintense on T2-weighted images with a peripheral hypointense rim (Fig 1A) and iso- to hypointense on T1-weighted images (Fig 1B). Postcontrast study showed rim enhancement (Fig 1C). A few brain abscesses showed homo-geneous hyperintensity on DWI (Fig 1D⫺F), with corre-sponding homogeneous hypointensity on ADC images (Fig 1G⫺I). However, most brain abscesses showed heterogeneity on DWI and corresponding ADC images.
Quantification of ADC
The mean ADC values of the abscess cavity, CNWM, and GM regions quantified by placing regions of interest on ADC maps obtained from different b-values are summarized in Table 1. On independent Studentttests, a significant decrease in mean ADC values was observed in the abscess cavity at different b-values. In CNWM, there was no significant difference among mean ADC values obtained from different b-values. In GM regions, there was a significant difference only between mean ADC values ofb⫽1000 andb⫽3000 s/mm2(Table 1). In healthy controls, we observed significant differences in mean ADC values quantified from FWM and GM regions at different b-values (Table 1).
Fig 1.A 16-year-old male patient with brain abscess.A,T2-weighted image shows bilobed centrally hyperintense lesions with a peripheral hypointense rim and surrounding edema in the left tempoparietal region causing mass effect.BandC, The lesion shows central hypointensity with a peripheral isointense rim on the T1-weighted image (B) and rim enhancement on the postcontrast T1-weighted image (C).D⫺F, DWI at b-values of 1000 (D), 2000 (E), and 3000 s/mm2(F), respectively, show intense hyperintensity inside the lesions with maximal
suppression of free water at 3000 s/mm2
(F).G⫺I, ADC maps generated from DWI at different b-values (1000, 2000, and 3000 s/mm2
) show a decrease in signal intensity inside the lesions with increasing b-values, suggestive of maximal suppression of extracellular water.JandK, The fast (J) and slow (K) component ADC maps derived from the biexponential fit in the abscess cavity have values of (1.11⫾0.06)⫻10⫺3
s/mm2
and (0.15⫾0.23)⫻10⫺3
s/mm2
[image:3.594.56.534.44.237.2], respectively. Pus culture showedS aureus.
Table 1: ADC values quantified from the abscess cavity, CNWM, and GM of patients with brain abscess and the WM and GM of healthy controls at different b-values
Regions
ADCa
PValue A (b⫽1000) B (b⫽2000) C (b⫽3000)
Patients (n⫽30)
Abscess cavity 0.59⫾0.20 0.48⫾0.13 0.39⫾0.11 A vs B⫽.05; A vs C⫽.01, B vs C⫽.05 CNWM 0.64⫾0.04 0.63⫾0.11 0.62⫾0.14 A vs B⫽.86, A vs C⫽.80, B vs C⫽.93 GM 0.74⫾0.04 0.71⫾0.12 0.71⫾0.02 A vs B⫽.37, A vs C⫽.01, B vs C⫽.97 Healthy controls (n⫽10)
WM 0.82⫾0.02 0.68⫾0.02 0.58⫾0.02 A vs B⫽.01, A vs C⫽.01, B vs C⫽.01 GM 0.78⫾0.03 0.71⫾0.01 0.64⫾0.02 A vs B⫽.01, A vs C⫽.01, B vs C⫽.01 a
(Mean⫾SD)⫻10⫺3
s/mm2
[image:3.594.51.533.335.434.2]On independent Studentttests, no significant difference was observed between ADCfastof brain abscess lesions, CNWM,
and GM regions of patients with brain abscess. ADCslowof the
abscess cavity was found to be significantly lower than the ADCslowof the GM of patients with brain abscess (Table 2).
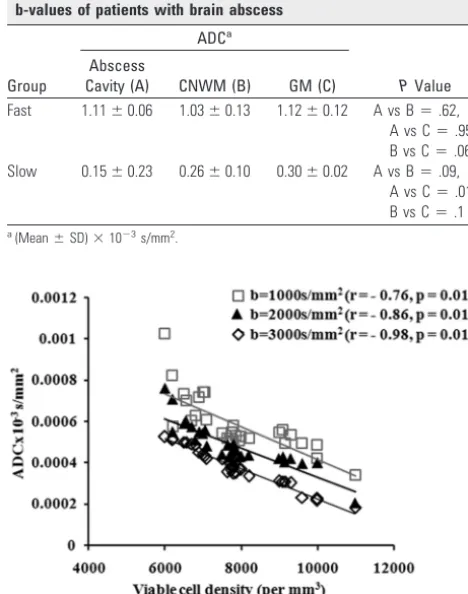
On bivariate analysis by using the Pearson correlation, a significant negative correlation was observed between the VCD and mean ADC values from different b-values (b⫽1000 s/mm2,r⫽ ⫺0.76,P⫽.01;b⫽2000 s/mm2,r⫽ ⫺0.86,P⫽ .01; andb⫽3000 s/mm2,r⫽ ⫺0.98,P⫽.01) (Fig 2). No significant correlation was observed between VCD and fast and slow ADC components computed through biexponential fit (ADCfast[r⫽ ⫺0.17,P⫽.56] and ADCslow[r⫽ ⫺0.15,P⫽
.58]).
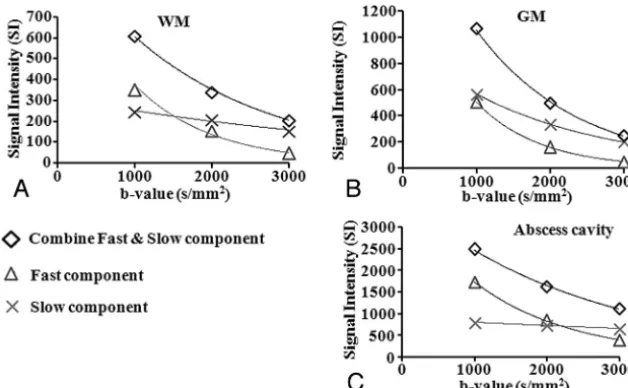
The biexponential fit of combined and fast components revealed a decrease in signal intensity with increasing b-values in the WM and GM regions and abscess cavity (Fig 3A⫺C). However, there was a gradient in decrease in the signal inten-sity of the slow component moving from GM to WM regions with not much change in the abscess cavity as a function of b-values (Fig 3A⫺C).
Discussion
In this study, significantly low mean ADC values were ob-served in the abscess cavity at different b-values. With increas-ing b-values, ADC values decreased in the abscess cavity, GM, and CNWM regions of brain. The decrease in ADC values
betweenb⫽1000 andb⫽3000 s/mm2was significant in the GM of patients and controls, while it also showed only a sig-nificant decrease from FWM in healthy controls. Although there was a significant negative correlation of VCD with all 3 b-values, the correlation atb⫽3000 s/mm2was found to be close to 1. The quantification of fast and slow components of ADC by using a biexponential fit in the abscess cavity did not correlate with VCD.
It has been shown by in vivo and ex vivo experiments that the increase in cell attenuation in brain abscesses negatively correlates with mean ADC values.10The mean ADC values measured from the abscess cavity showed trends similar to those exhibited by cellular tumors in humans26and animal tumor models.27It has been reported that b-value is inversely proportional to ADC.29 DeLano et al14 have reported that when b-values increase from 1000 to 3000 s/mm2, ADC values decrease from 30% to 35% for the same regions of interest. The authors related it to the biexponential decay in signal in-tensity. The signal-intensity decay observed in their study as a function of b factor is in close agreement with our results from a biexponential model in the abscess cavity of these patients (Fig 3A⫺C).
It has been reported that the ADC of viable tissue is a result of independent contributions from the intracellular and extra-cellular compartments.30,31Therefore, at least 2 factors con-tribute to a decrease in ADC values with increasing cell atten-uation. The first is that tissues with high cell attenuation have a large fraction of intracellular water compared with tissues with low cell attenuation. The intracellular water has presum-ably lower ADC than the extracellular water due to a higher content of diffusion barriers in the intracellular compart-ment.30Second, tissues with high cell attenuation have small extracellular compartments compared with tissues with low cell attenuation. The mobility and mean ADC decrease in tis-sues with high cellularity results in low ADC because of small extracellular water content. The influence of this factor is strengthened because the ADC is biased toward the diffusion coefficient of the compartment with the longest T2 (ie, the extracellular compartment).31
On the biexponential fit model, we observed a decrease in signal intensity of the fast component as we moved from low to high b-values. The strongest correlation of VCD with ADC values atb⫽3000 s/mm2can be attributed to the fact that on increasing diffusion weighting, there is a decrease in T2 shinethrough effect, resulting in removal of fast components, which in turn is responsible for more precise measurements of ADC values of the intact inflammatory cells inside the abscess cavity. The absence of any change in signal intensity of the slow component inside the abscess cavity further suggests that mainly the fast component is probably responsible for the T2 shinethrough effect, which is removed on increasing the diffusion-weighting.
On the basis of biexponential fit, the fast and slow diffusion components of water have been described in human brain and interpreted as from extracellular and intracellular compart-ments, respectively.32,33Le Bihan24has suggested that fast and slow components of the water diffusion correspond to 2 dif-ferently structured water pools, rather than specific water compartments. He proposed a model where both the slow and fast components of water diffusion originate partly in the in-Table 2: Mean values of fast and slow components of ADC
quantified from the abscess cavity, CNWM, and GM at different b-values of patients with brain abscess
Group
ADCa
PValue Abscess
Cavity (A) CNWM (B) GM (C)
Fast 1.11⫾0.06 1.03⫾0.13 1.12⫾0.12 A vs B⫽.62, A vs C⫽.95, B vs C⫽.06 Slow 0.15⫾0.23 0.26⫾0.10 0.30⫾0.02 A vs B⫽.09,
A vs C⫽.01, B vs C⫽.1 a(Mean⫾SD)⫻10⫺3s/mm2.
Fig 2.Scatterplot shows correlation between VCD with mean ADC values measured from different b-values (b⫽1000, 2000, and 3000 s/mm2
[image:4.594.50.284.68.365.2] [image:4.594.51.286.78.177.2]tracellular space and partly in the extracellular space.24 Al-though we observed the best correlation with ADC atb⫽3000 s/mm2, we did not observe any correlation of fast and slow components of the ADC with the actual cell count, suggesting that these 2 components may not represent the extra- and intracellular water compartments, respectively. Our results further confirm that these 2 components of water diffusion originate from the 2 different pools rather than from the 2 different compartments of water.
The viable inflammatory cells in the abscess cavity are the result of active inflammation, and a decrease in inflammatory cells is considered a marker for the response to therapy. This has been shown by serial ADC measures in which an increase in ADC indicates a response, while a decrease in its value sug-gests reactivation of the disease.11Similar results have been shown by using serial fractional anisotropy measurements in brain abscess, in which an increase in fractional anisotropy is associated with upregulation of inflammatory cytokines and increased inflammatory cells, while the reverse is true when there is a positive response.34,35Usiskin et al36have also used serial high b-values (up tob⫽3000 s/mm2) to assess the re-sponse to highly active antiretroviral therapy in a case of pro-gressive multifocal leukoencephalopathy. Our data suggest that ADC maps derived fromb⫽3000 s/mm2may be ideal for quantification of intact inflammatory cells in the abscess cav-ity and may be able to predict therapeutic response much bet-ter than ones obtained fromb⫽1000 s/mm2.
Various authors have used b-values up to 5000 s/mm2to demonstrate the biexponential fit in human brain.22,23,29In the current study, we used b-values up to 3000 s/mm2, which may be suboptimal to demonstrate the biexponential fit and may be considered a limitation.
Conclusions
The viability of cells, a measure of disease activity, can be best quantified by ADC values derived by usingb⫽3000 s/mm2 DWI. This may be used in the future to assess the therapeutic response to antibiotics in patients with brain abscess. The fast
and slow components of diffusivity may not truly represent the extracellular and intracellular compartments and may simply represent the free and bound water present in the tissue.
References
1. Gupta RK, Hasan KM, Mishra AM, et al.High fractional anisotropy in brain abscesses versus other cystic intracranial lesions.AJNR Am J Neuroradiol
2005;26:1107–14
2. Osenbach RK, Loftus CM.Diagnosis and management of brain abscess. Neu-rosurg Clin N Am1992;3:403–20
3. Kao PT, Tseng HK, Liu CP, et al.Brain abscess: clinical analysis of 53 cases. J Microbiol Immunol Infect2003;36:129 –36
4. Poptani H, Gupta RK, Jain VK, et al.Cystic intracranial mass lesions: possible role of in vivo MR spectroscopy in its differential diagnosis.Magn Reson Im-aging1995;13:1019 –29
5. Garg M, Gupta RK, Husain M, et al.Brain abscess: etiological categorization with in vivo proton MR spectroscopy.Radiology2004;230:519 –27 6. Le Bihan D, Breton E, Lallemand D, et al.MR imaging of intravoxel incoherent
motions: application to diffusion and perfusion in neurologic disorders. Radiology1986;161:401– 07
7. Kim YJ, Chang KH, Song IC, et al.Brain abscess and necrotic or cystic brain tumor: discrimination with signal intensity on diffusion-weighted MR imag-ing.AJR Am J Roentgenol1998;171:1487–90
8. Desbarats LN, Herlidou S, Marco G, et al.Differential MRI diagnosis between brain abscesses and necrotic or cystic brain tumors using the apparent diffu-sion coefficient and normalized diffudiffu-sion-weighted images.Magn Reson Im-aging2003;21:645–50
9. Desprechins B, Stadnik T, Koerts G, et al.Use of diffusion-weighted MR imag-ing in differential diagnosis between intracerebral necrotic tumors and cere-bral abscesses.AJNR Am J Neuroradiol1999;20:1252–57
10. Mishra AM, Gupta RK, Saksena S, et al.Biological correlates of diffusivity in brain abscess.Magn Reson Med2005;54:878 – 85
11. Cartes-Zumelzu FW, Stavrou I, Castillo M, et al.Diffusion-weighted imaging in the assessment of brain abscesses therapyAJNR Am J Neuroradiol2004;25: 1310 –17
12. Seo HS, Chang KH, Na DG, et al.High b-value diffusion (bⴝ3000 s/mm2
)MR imaging in cerebral gliomas at 3T: visual and quantitative comparisons with bⴝ1000 s/mm2.AJNR Am J Neuroradiol2008;29:458 – 63. Epub 2007 Dec 7
13. Mardor Y, Roth Y, Ochershvilli A, et al.Pretreatment prediction of brain tu-mors’ response to radiation therapy using high b-value diffusion-weighted MRI.Neoplasia2004;6:136 – 42
14. DeLano MC, Cooper TG, Siebert JE, et al.High-b-value diffusion-weighted MR imaging of adult brain: image contrast and apparent diffusion coefficient map features.AJNR Am J Neuroradiol2000;21:1830 –36
15. Burdette JH, Durden DD, Elster AD, et al.High b-value diffusion-weighted MRI of normal brain.J Comput Assist Tomogr2001;25:515–19
[image:5.594.137.451.44.238.2]16. Kim HJ, Choi CG, Lee DH, et al.High b-value diffusion-weighted MR imaging of hyperacute ischemic stroke at 1.5T.AJNR Am J Neuroradiol2005;26:208 –15 17. Tha KK, Terae S, Yamamoto T, et al.Early detection of global cerebral anoxia: improved accuracy by high-b-value diffusion-weighted imaging with long echo time.AJNR Am J Neuroradiol2005;26:1487–97
18. Meyer JR, Gutierrez A, Mock B, et al.High-b-value diffusion-weighted MR imaging of suspected brain infarction.AJNR Am J Neuroradiol 2000;21: 1821–29
19. Burdette JH, Elster AD.Diffusion-weighted imaging of cerebral infarctions: are higher B values better?J Comput Assist Tomogr2002;26:622–27 20. van Zijl PC, Moonen CT, Faustino PJ, et al.Complete separation of
intracellu-lar and extracelluintracellu-lar information in NMR spectra by diffusion weighting.Proc Natl Acad Sci U S A1991;88:3228 –32
21. Pilatus U, Shim H, Artemov D, et al.Intracellular volume and apparent diffu-sion constants of perfused cancer cell cultures, as measured by NMR.Magn Reson Med1997;37:825–32
22. Niendorf T, Dijkhuizen RM, Norris DG, et al.Biexponential diffusion attenu-ation in various states of brain tissue: implicattenu-ations for diffusion-weighted imaging.Magn Reson Med1996;36:847–57
23. Mulkern RV, Gudbjartsson H, Westin CF, et al.Multi-component apparent diffusion coefficients in human brain.NMR Biomed1999;12:51–52 24. Le Bihan D.The ‘wet mind’: water and functional neuroimaging.Phys Med
Biol2007;52:R57– 60. Epub 2007 Mar 9
25. Prasad KN, Mishra AM, Gupta D, et al.Analysis of microbial etiology and mortality in patients with brain abscess.J Infect2006;53:221–27
26. Gupta RK, Cloughesy TF, Sinha U, et al.Relationships between choline mag-netic resonance spectroscopy, apparent diffusion coefficient and quantitative histopathology in human glioma.J Neurooncol2000;50:215–26
27. Lyng H, Haraldseth O, Rofstad EK.Measurement of cell density and necrotic
fraction in human melanoma xenograft by diffusion weighted magnetic res-onance imaging.Magn Reson Med2000;43:828 –36
28. Awasthi R, Verma SK, Haris M, et al.Comparative evaluation of dynamic contrast-enhanced perfusion with diffusion tensor imaging metrics in assess-ment of corticospinal tract infiltration in malignant glioma.J Comput Assist Tomogr2010;34:82– 88
29. Brugieres P, Thomas P, Maraval A, et al.Water diffusion compartmentation at high b values in ischemic human brain.AJNR Am J Neuroradiol2004;25: 692–98
30. Szafer A, Zhong J, Gore JC.Theoretical model for water diffusion in tissues. Magn Reson Med1995;33:697–12
31. Duong TQ, Ackerman JJH, Ying HS, et al.Evaluation of extra- and intracellular apparent diffusion in normal and globally ischemic rat brain via 19F NMR. Magn Reson Med1998;40:1–13
32. Sehy JV, Ackerman JJ, Neil JJ.Evidence that both fast and slow water ADC components arise from intracellular space.Magn Reson Med2002;48:765–70 33. Clark CA, Le Bihan D.Water diffusion compartmentation and anisotropy at
high b values in human brain.Magn Reson Med2000;44:852–59
34. Gupta RK, Nath K, Prasad A, et al.In vivo demonstration of neuroinflamma-tory molecule expression in brain abscess with diffusion tensor imaging. AJNR Am J Neuroradiol2008;29:326 –32
35. Nath K, Ramola M, Husain M, et al.Assessment of therapeutic response in patients with brain abscess using diffusion tensor imaging.World Neurosurg
2010;73:63– 68